

0 引言
产业园区是为实现发展目标而规划的特殊区域,其不仅拉动了国家、地方经济的发展,也影响了城市扩张及空间格局演变及城市土地利用[1]。基于产业园视角,研究人类社会、经济活动对土地利用变化的影响,探讨其对城市空间发展的贡献以及向绿色园区转型等仍是目前关注的重要问题。
产业园区的现有研究涉及规划、环境、产业升级、运营状况、产业集群等多方面。然而对于园区各类问题研究所用的数据多基于统计数据或测验数据,如一些学者使用自然社会经济数据、国家批准文件、已发布案例研究等数据,研究了工业园区或老工业用地的转型升级[2-3]。除了产业园内部产业结构调整与转型,园区整体朝绿色协调方向发展也至关重要,通过了解工业的发展信息和规划信息,力图构建生态系统模型以实现生态工业园的绿色循环共生[4⇓-6]。部分学者用夜间灯光数据、MODIS影像数据对园区污染问题和园区对周围环境的影响进行分析[6⇓⇓⇓-10],为改善园区环境质量和城市可持续发展提供建议。也有学者针对典型园区面临的问题,利用地形图、航空照片、现状照片、访谈信息等大数据,探究园区的发展对于土地利用的影响,为提高土地利用效率、合理规划城市用地提供坚实的基础[11⇓-13]。
上述研究虽然从多个角度剖析了产业园存在的问题,但研究数据多依托政府工作报告、统计公报及统计年鉴等,这些数据人为影响因素较大,且具有周期性和时效性限制,无法进行持续动态监测[14]; 另外空间分辨率是许多研究的限制因素[15],如部分夜间灯光数据、MODIS影像等空间分辨率低,无法满足长时序、高精度精细化研究。就现有产业园时空分布研究来看,缺乏有效映射产业园区时间、空间变化的直观数据和动态数据。鉴于此,本文从彩钢板建筑群视角出发,借助Google Earth影像提取产业园区及其周边的彩钢板建筑群数据,其具有精度高、时间序列长及与产业园区相关性高等优势,同时辅以其他数据,长时序系统研究了青海省西宁市产业园区的时空分布特征及规律,研究结果将为产业园区的量化研究提供数据基础。
1 研究区概况及数据源
1.1 研究区概况
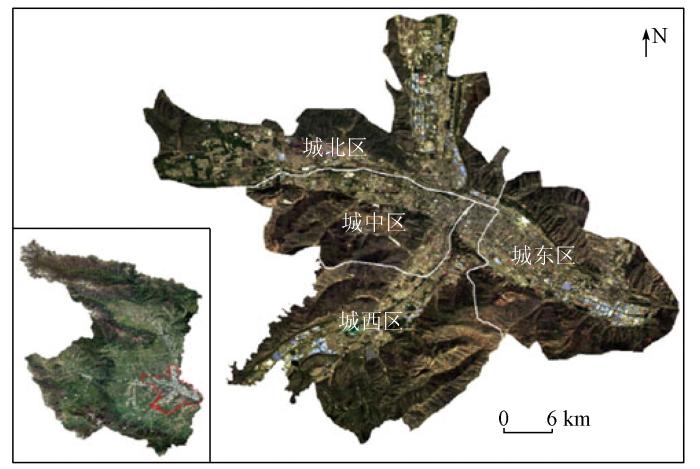
西宁市地处中国西北地区、青海省东部、湟水中游河谷盆地,中心坐标为101°77'E,36°62'N。西宁以其独特的地势条件和优越的地理位置成为青藏高原的门户,是中西部绒毛资源的重要枢纽。此外,西宁市是典型的旅游城市,随着城市化进程不断推进,产业园区亦发展迅捷,顾及西宁市特殊川道型地理特征和旅游业可持续发展,其产业园区的时空分布特征是否具有一定规律,是否切合城市发展定位,均有待研究。本研究涵盖了西宁市城东区、城北区、城西区和城中区,面积476.5 km2,包含3个(国家级)经济技术开发区和众多地方级园区。研究区概况如图1所示。
图1
1.2 研究数据
2)产业园区数据。结合Google Earth影像和前瞻数据研究院收录的产业园数据得到2005—2020年产业园区边界数据。
3)西宁市路网数据。路网数据源于OpenStreetMap,路网属性包含了经纬度、道路名称、道路分级(主要道路、铁路、二级道路、三级道路、自行车道、人行道)。
2 研究方法
2.1 网络核密度
核密度估计(kernel density estimation,KDE)是利用核密度函数计算对象的聚集密度,被广泛应用于点模式分析、犯罪热点分析以及经济活动空间分布分析等[20],其易于实现并能较好地反映地理现象空间分布中的距离衰减效应[21]。平面核密度结果虽能够表达事物的相近程度或聚集密度,但对于沿线路分布的设施难以准确表达[22]。考虑到西宁市产业园数目相对较少且园区大多与道路联系紧密,平面核密度很难确定合适的带宽适用于所有园区,而网络核密度(network kernel density estimation,NKDE)分析受道路网约束,能够完整显示周围设施的密度情况。与平面核密度相似,搜索带宽h的取值对网络核密度的结果有很大的影响。通过比较不同的搜索半径和单位网络长度的结果,确认带宽1 000 m的条件下密度图平滑且园区分布细节能很好表达。网络核密度表达式如下[23-24]:
式中:
2.2 标准差椭圆
标准差椭圆(standard deviational ellipse,SDE)是揭示区域某地理要素空间分布特征的常用分析方法,能够精确揭示地理要素在空间上的分布中心、离散和方向趋势[25]。SDE模型主要包括椭圆的重心坐标、长轴与短轴、旋转角4个要素,重心坐标代表着某地理要素在空间分布的相对中心位置; 长轴和短轴分别反映了地理要素空间分布的方向和范围,长短轴差异越大,扁率值越高,地理要素空间分布的方向性越突出[26]。以西宁市产业园平均分布中心为重心,通过构建产业园的空间分布椭圆,来解释西宁市产业园区随时间发展变化的方向、强度及其空间离散趋势,同理得到彩钢板建筑群的标准差椭圆,以此来分析产业园区的空间分布及方向变化。计算公式为:
式中:
2.3 等扇分析法
式中:
3 结果与分析
3.1 产业园规模变化
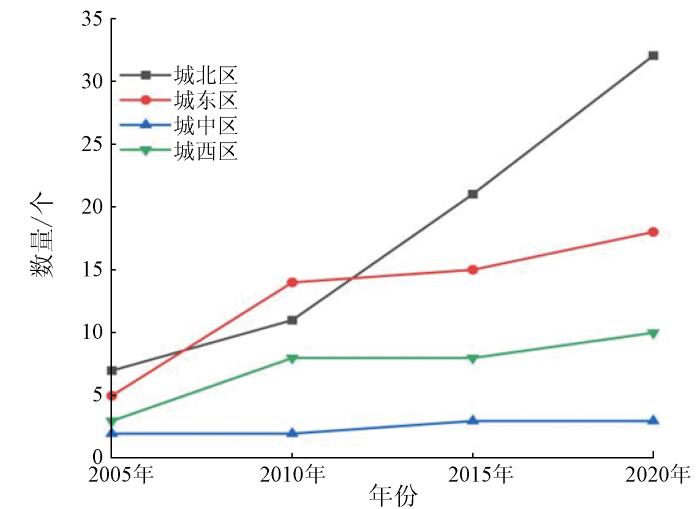
根据前瞻产业园区收录的产业园区名录和位置数据,结合Goole Earth影像和统计年鉴数据进行筛选,剔除重复以及错误的数据,最终得到2005—2020年西宁市不同区内产业园数量。西宁市产业园区数量变化如图2所示,通过研究分析发现,西宁市产业园总量由2005年的17个增加至2020年63个,表明15 a间西宁市产业园规模不断扩展,建成区不断完善。然而受地形和交通区位影响,不同区域产业园发展并不均衡,其中城北区在2010—2020年间数量增长迅猛,增长率达到65%,至2020年城北区产业园区数量占比达到50.8%,其规模超过其他3区的总和,对整个城市的发展起着至关重要的作用。城东区数量仅次于城北区,与城中区和城西区变化情况一致,均呈现前后2个阶段增量显著,中间阶段增长缓慢,说明在2010—2015年间,城市整体发展放缓。
图2
3.2 产业园时空分布分析
3.2.1 产业园区与彩钢板建筑群的时空耦合分析
从2005年开始到2020年,每5 a为一个周期,选取4景 Google Earth影像提取彩钢板建筑群和产业园区边界矢量数据。利用SANET软件,对研究区域内2005—2020年产业园区数据和彩钢板数据分别做网络核密度分析,结合产业园区与彩钢板建筑群的网络核密度结果分析产业园在周期内的聚集密度和周期分布特征。
利用遥感影像可直观看出产业园与彩钢板建筑相关性分布。图3是西宁市南川工业园区在2005—2020年的局部Google Earth影像,从图中不难看出同一产业园中彩钢板建筑群规模随时间的变化明显,这种从无到有、从疏到密的变化过程表征着产业园的发展历程和扩张程度。
图3
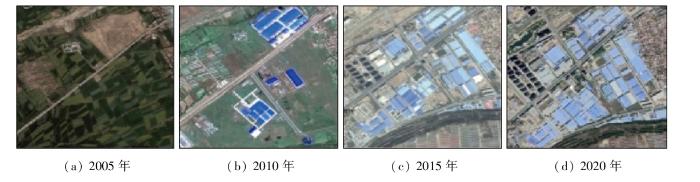
图3
西宁市南川工业园(局部)彩钢板建筑群
Fig.3
Nanchuan Industrial Park (partial) color steel plate building complex, Xining City
进一步从聚集特征来分析二者的关联,以2020年网络核密度图为例,在ArcGIS中对产业园区和彩钢板建筑群的网络核密度图叠置分析,采用自然间断法确定最优密度等级,将叠加后的聚集密度分为3个等级,分别为低耦合区、中耦合区和高耦合区。结果如图4。
图4
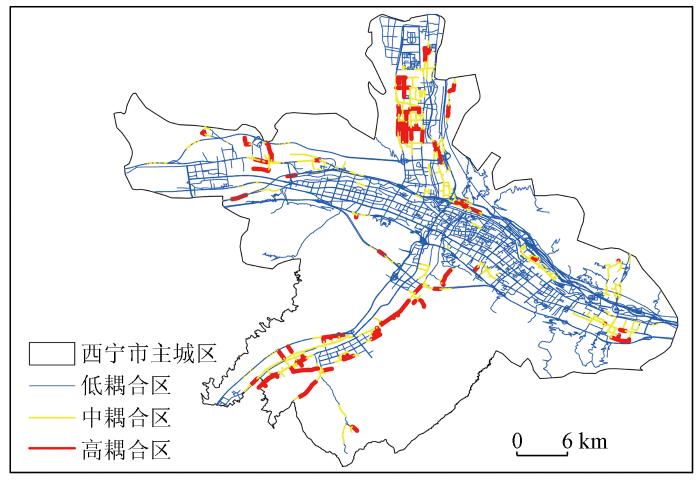
图4
彩钢板建筑与产业园耦合度
Fig.4
The coupling degree of color steel plate building and industrial park
1)高耦合区域以大型产业园为主。其中城北区以西宁市(国家级)经济技术开发区为核心,四周分布着青海华鼎工业园、青海装备制造配套产业园、青海生科产业园、珠峰集团冬虫夏草产业园等以生产制造业为主的大型产业园; 城中区西宁(国家级)经济技术开发区南川工业园区局部区域密布彩钢板建筑群。
2)高度耦合区域与中度耦合区域大多分布于城市四周,与两者网络核密度结果一致。虽然高密度聚集区大致吻合,但2005年和2020年局部区域聚集度并不一致,2005年科技类园数目居多,2020年创业园数量急速增长,两类园区均以第三产业为主,其建筑大多为永久性建筑,故两者分布存在局部偏差。综上所述,彩钢板建筑群与产业园区存在着高度耦合,其高密度聚集区基本一致且局部偏差对整体分布影响不大,说明彩钢板建筑群在一定程度上能够表征产业园区的空间位置、区域特征以及时空分布。
3.2.2 产业园区时空分布特征
图5
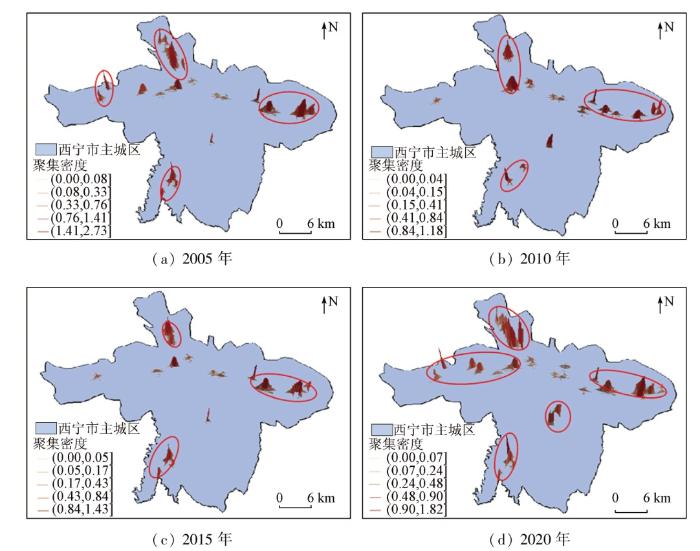
图5
西宁市产业园网络核密度图
Fig.5
Network nuclear density map of Industrial Park in Xining City
图6
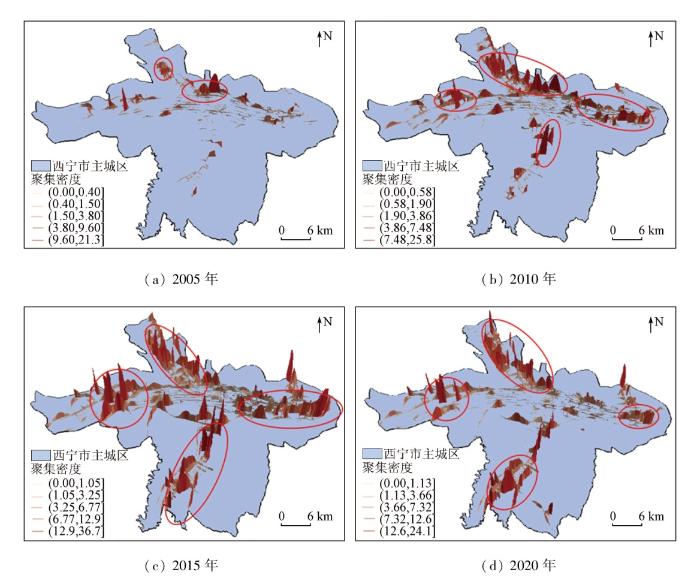
图6
西宁市彩钢板网络核密度图
Fig.6
Nuclear density map of color steel plate network in Xining City
结合图6中彩钢板建筑群来看,2005年彩钢板建筑群高密度聚集区域主要在城北小片区域,2010年在全市都有明显增加,新增高密度聚集区沿城市边缘分布。2015年彩钢板数量达到顶峰,聚集区域成片分布,高密度聚集区形成明显“十字型”结构,该时期产业园区发展成四大核心区域,分别位于城北区经二路、城东区金和路、城北区青藏高速附近和城中区宁贵高速附近。2020年彩钢板规模骤然减小,高密度聚集区呈圆环形分布于城市外围,产业园基本形成四周高密度聚集 、中心低密度聚集的分布模式,符合西宁市“内生活,外生产”的空间布局。
图7
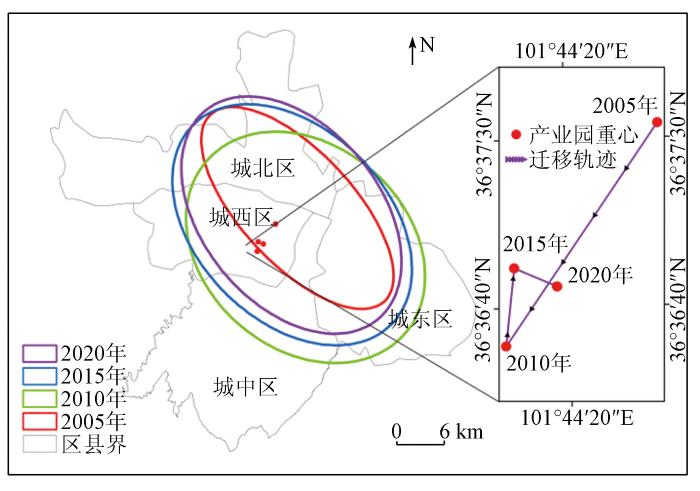
图8
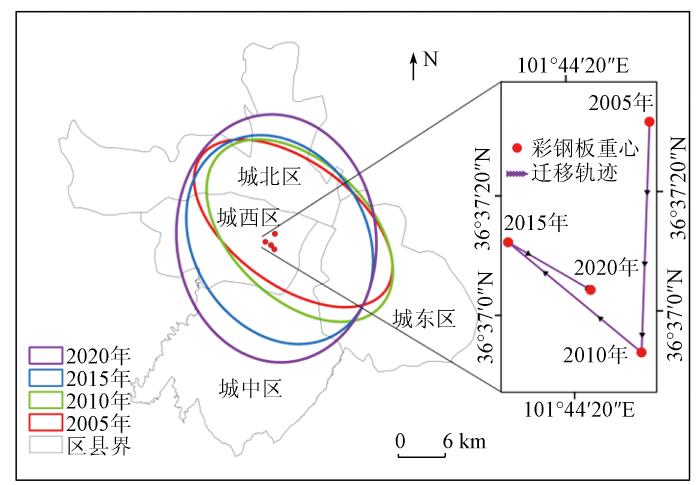
图8
西宁市彩钢板重心迁移
Fig.8
The center of gravity of color steel plate in Xining City was relocated
3.2.3 产业园区空间扩散特征
表1 西宁市2005—2020年产业园扩张指数
Tab.1
| 扇面 | 2005—2010年 | 2010—2015年 | 2015—2020年 |
|---|---|---|---|
| N | 0.001 2 | 0.084 4 | 0.001 0 |
| NE | 0.016 5 | 0.045 7 | 0.014 1 |
| NEE | 0.023 3 | 0.033 5 | 0.019 6 |
| NNE | 0.009 3 | 0.059 9 | 0.008 1 |
| E | 0.032 8 | 0.008 5 | 0.027 0 |
| ES | 0.050 3 | 0.018 1 | 0.036 3 |
| EES | 0.179 6 | 0.008 5 | 0.026 9 |
| ESS | 0.293 9 | 0.008 4 | 0.019 7 |
| S | 0.531 5 | 0.006 0 | 0.014 1 |
| SSW | 1.550 4 | 0.004 0 | 0.007 7 |
| SW | 3.218 1 | 0.000 0 | 0.000 8 |
| SWW | 2.072 6 | 0.000 0 | 0.000 0 |
| W | 1.026 4 | 0.000 0 | 0.000 0 |
| WN | 0.000 0 | 0.043 0 | 0.000 0 |
| WWN | 0.000 0 | 0.073 1 | 0.000 0 |
| WNN | 0.181 8 | 0.000 5 | 0.000 0 |
图9
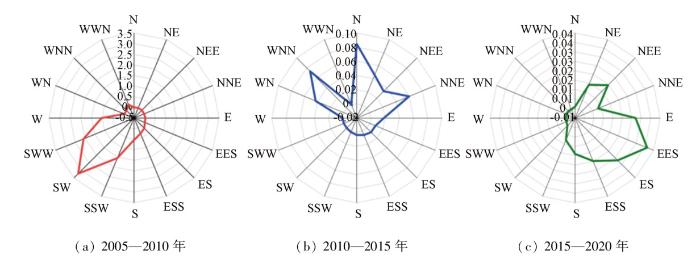
图9
西宁市产业园扩张变化雷达图
Fig.9
Radar map of the expansion and change of industrial parks in Xining City
在第二阶段中,北(N)和西北北(WNN)方向上扩张强度高,但是该阶段的整体扩张强度比第一阶段低,产业园的发展处于稳定上升期。随着西宁市产业结构的不断优化,加大第三产业不断发展,一方面力求打造高新技术产业、创新创业聚集区,加速发展高原生物技术,另一方面依托北川工业园区为基地,大力发展铝业加工,促进对外开放,导致该阶段园区向北扩张力度加大。
第三阶段在东东南(EES)有大幅度的扩张,北东东(NEE)方向有小幅度扩张。在“十三五”规划中,将东川工业园、南川工业园作为发展重点项目的两大产业园,在一定意义上促进了城东区和城中区的发展,这也使得在2015—2020年间产业园向东南方向扩张。
4 结论
本文结合彩钢板建筑群数据、产业园区相关数据与其他辅助数据,运用网络核密度、标准差椭圆等扇分析法对西宁市产业园区的时空分布格局进行研究,得到以下几点结论:
1)从产业园宏观规模变化趋势来看,2005—2020年间西宁市的产业园区数量持续增长,规模不断扩大,然而园区发展存在区域不均衡,其中城北区园区规模最大且逐年增长速度最快,其次,2010—2015年间园区增长速率较小,从侧面反映出该阶段城市化进程缓慢。
2)从聚集特征来看,产业园区的高密度聚集区域逐渐增多,初始城东区与城北区有两大高密度聚集区,2015年以后城中区与城西区也开始出现高密度聚集区。彩钢板建筑群的网络核密度图能更直观地显示出园区由单一的高密度聚集区向多区域高密度聚集区发展的过程,新增产业园依城市边缘呈高密度聚集分布。就空间分布特征而言,产业园区在2005—2020年间均呈现“西北-东南”向分布,辅以彩钢板建筑群标准差椭圆发现,产业园区椭圆扁率减小且面积增大,表明园区不断扩张且方向性逐渐不明显。
3)产业园区扩张强度表明在2005—2010年产业园区扩张速度最快,扩张强度达到9.18,其中,在SWW方向扩张强度最大。园区扩张强度随着时间递减,在2015—2020年间扩张强度减至0.17,表明园区的发展逐渐趋于稳定,只在小区域范围内小幅度扩张。
与其他研究相比,本研究的突出点在于利用彩钢板建筑这种大量存在于产业园的临时性建筑,对产业园区的时空分布进行辅助分析,能够更加清晰、直观地表征产业园的分布规律。本文研究的局限性在于没能量化表达彩钢板建筑群与产业园区的时空关联,后续将考虑在上述研究的基础上,研究彩钢板建筑群与产业园区时空关联的量化表达方法,重点分析其在时间、空间、时空维度上关联表达模型等。
参考文献
Expansion of industrial parks in the Beijing-Tianjin-Hebei urban agglomeration: A spatial analysis
[J].
Creative destruction path selection for industrial park transformation and upgrading under the concept of character town in the era of big data
[J].
Industrial transformation and urban economic efficiency evolution:An empirical study of the Yangtze River economic belt
[J].
China’s green transformation through eco-industrial parks
[J].
Research on spatial planning of petrochemical industrial parks from the perspective of symbiosis:Example of Yueyang green chemical industry park
[J].
Air Pollutants and CO2 emissions in industrial parks and evaluation of their green upgrade on regional air quality improvement:A case study of seven cities in Henan Province
[J].
Do industrial parks generate intra-heat island effects in cities? New evidence,quantitative methods,and contributing factors from a spatiotemporal analysis of top steel plants in China
[J].
Multiple pollutants in groundwater near an abandoned Chinese fluorine chemical park:Concentrations,correlations,and health risk assessments
[J].
Air pollution effects of industrial transformation in the Yangtze River Delta from the perspective of spatial spillover
[J].
DOI:10.1007/s11442-021-1929-6
[本文引用: 1]

The Yangtze River Delta (YRD) is a region in China with a serious contradiction between economic growth and environmental pollution. Exploring the spatiotemporal effects and influencing factors of air pollution in the region is highly important for formulating policies to promote the high-quality development of urban industries. This study uses the spatial Durbin model (SDM) to analyze the local direct and spatial spillover effects of industrial transformation on air pollution and quantifies the contribution of each factor. From 2008 to 2018, there was a significant spatial agglomeration of industrial sulfur dioxide emissions (ISDE) in the YRD, and every 1% increase in ISDE led to a synchronous increase of 0.603% in the ISDE in adjacent cities. The industrial scale index (ISCI) and industrial structure index (ISTI), as the core factors of industrial transformation, significantly affect the emissions of sulfur dioxide in the YRD, and the elastic coefficients are 0.677 and -0.368, respectively. The order of the direct effect of the explanatory variables on local ISDE is ISCI>ISTI>foreign direct investment (FDI)>enterprise technological innovation (ETI)>environmental regulation (ER)> per capita GDP (PGDP). Similarly, the order of the spatial spillover effect of all variables on ISDE in adjacent cities is ISCI>PGDP>FDI>ETI>ISTI>ER, and the coefficients of the ISCI and ISTI are 1.531 and 0.113, respectively. This study contributes to the existing research that verifies the environmental Kuznets curve in the YRD, denies the pollution heaven hypothesis, indicates the Porter hypothesis, and provides empirical evidence for the formation mechanism of regional environmental pollution from a spatial spillover perspective.
Influence of spatial characteristics of green spaces on microclimate in Suzhou Industrial Park of China
[J].
DOI:10.1038/s41598-022-13108-1
PMID:35650391
[本文引用: 1]
Continuous urban development leads to urban heat island effects. Research suggests that urban green spaces can help effectively reduce urban heat island effects in the summer. Previous studies have mainly focused on the influence of different underlying surfaces on air cooling and humidification. There is a lack of in-depth research on the relationship between park structure and microclimatic effects. Here, we examined the main landscape parameters of green spaces in 15 parks located in Suzhou Industrial Park (SIP) with a subtropical maritime monsoon climate zone during the summer to analyze their influence on the microclimate. We adopted a multiple regression method to perform a quantitative analysis of the correlation between the factors and the cooling and humidifying effects. We used one-way ANOVA (analysis of variance) and multiple linear regression statistical analysis methods to study the influence of woodland density and water bodies on the microclimatic effect of the green areas. The result shows that the average cooling and humidifying effect of medium-size green spaces was most significant during high-temperature hours in the daytime. Also, the result shows that the shape and size of water areas within a green space have a significant influence on local cooling and humidification.© 2022. The Author(s).
Analysis of Three-Dimensional space expansion characteristics in old industrial area renewal using GIS and Barista:A case study of Tiexi district,Shenyang,China
[J].
Does industrial land sprawl matter in land productivity? A case study of industrial parks of South Korea
[J].
Changing imbalance:Spatial production of national high-tech industrial development zones in China (1988-2018)
[J].
Life cycle assessment of reduction of environmental impacts via industrial symbiosis in an energy-intensive industrial park in China
[J].
Suitability of satellite remote sensing data for yield estimation in northeast Germany
[J].
兰州市安宁区彩钢棚时空变化
[J].
Temporal and spatial change of color steel sheds in Anning district of Lanzhou City
[J].
中国西北城市的彩钢板建筑群消防救援优化分析——以兰州市为例
[J].
Analysis on fire rescue optimization of color steel building complexes in northwest China:A case study of Lanzhou
[J].
兰州市彩钢板建筑时空聚集特征及其对城市热岛效应影响分析
[J].
Spatial-temporal aggregation characteristics of color steel plate buildings in Lanzhou and their influence on urban heat island effect
[J].
设施POI分布热点分析的网络核密度估计方法
[J].
DOI:10.11947/j.AGCS.2015.20140538
[本文引用: 1]
设施POI(point of interest)在城市地理空间中往往聚集分布,呈现热点特征。对该类POI分布热点的分析大多采用基于欧氏距离的空间密度估计,忽略了城市空间通达、连接是沿着街道路径的事实,从而很难准确、客观地反映城市功能的热点布局。本研究针对该缺陷,利用基于网络路径距离的核密度计算方法确定热点的区域密度,并提出了一种简单、高效的网络分析算法。该算法扩展二维栅格膨胀操作,以一维形态算子的连续扩展计算POI在网络单元上的密度值,通过评价试验表明,该算法比现有算法具有更好的性能和可扩展性。通过实际POI数据分析发现,考虑街道网络约束的热点范围可凸显设施功能沿交通网络布局的空间特征,为区域规划、导航以及地理信息查询等应用提供有价值的空间知识与信息服务。
Network kernel density estimation for the analysis of facility POI hotspots
[J].
DOI:10.11947/j.AGCS.2015.20140538
[本文引用: 1]
The distribution pattern of urban facility POIs (points of interest) usually forms clusters (i.e. "hotspots") in urban geographic space. To detect such type of hotspot, the methods mostly employ spatial density estimation based on Euclidean distance, ignoring the fact that the service function and interrelation of urban feasibilities is carried out on the network path distance, neither than conventional Euclidean distance. By using these methods, it is difficult to exactly and objectively delimitate the shape and the size of hotspot. Therefore, this research adopts the kernel density estimation based on the network distance to compute the density of hotspot and proposes a simple and efficient algorithm. The algorithm extends the 2D dilation operator to the 1D morphological operator, thus computing the density of network unit. Through evaluation experiment, it is suggested that the algorithm is more efficient and scalable than the existing algorithms. Based on the case study on real POI data, the range of hotspot can highlight the spatial characteristic of urban functions along traffic routes, in order to provide valuable spatial knowledge and information services for the applications of region planning, navigation and geographic information inquiring.
新疆典型绿洲城乡聚落规模体系特征及空间重构——以渭干河—库车河三角洲绿洲为例
[J].
DOI:10.11821/dlxb202204006
[本文引用: 1]
随着乡村振兴战略的提出及实施,城乡关系也进入融合发展新时期,厘清典型地域城乡聚落规模体系的演变过程及现状特征并探明其空间重构与优化路径对实现农业农村现代化具有重要的现实意义。本文以新疆塔里木盆地北缘渭干河—库车河三角洲绿洲(简称“渭库绿洲”)为例,利用2009—2018年土地利用数据,采用GIS空间分析及位序—规模法则等方法,刻画了渭库绿洲城乡聚落规模体系特征;依据乡村振兴多级目标的理论内涵,探讨了渭库绿洲城乡聚落体系空间重构模式及优化路径。结果表明:① 渭库绿洲城镇村体系建设过程中城镇主导作用较弱,城乡聚落规模总体扩张较快,城乡人口与聚落增长反差较大,乡村人地关系失调特征明显;② 渭库绿洲城乡聚落规模分布整体服从位序—规模法则,零星聚落“摆尾”现象加剧且空间无序扩张特征显著,城乡聚落空间分布特征具有明显的县城、中心乡镇、干渠及道路指向性,但向中心乡镇空间集聚趋势不明显;③ 渭库绿洲城乡聚落规模体系空间重构的首要举措是整治零星斑块,对典型样区设定了3个优化目标并对空间重构路径进行了逻辑解析,提出了5种整治方向。基于乡村振兴多级目标,构建以土地要素流动为关键的空间重构方案,对促进渭库绿洲城乡聚落规模体系结构优化与功能协调、实现乡村振兴具有重要现实意义。
Characteristics and spatial reconstruction of an urban-rural settlement scale system in a typical oasis in Xinjing:A case study of the Ugan-Kuqa River Delta oasis
[J].
核密度估计法支持下的网络空间POI点可视化与分析
[J].
DOI:10.11947/j.AGCS.2015.20130538
[本文引用: 1]
城市空间POI点的分布模式、分布密度在基础设施规划、城市空间分析中具有重要意义, 表达该特征的核密度法(kernel density estimation)由于顾及了地理学第一定律的区位影响,比其他密度表达方法(如样方密度、基于Voronoi图密度)占优.然而,传统的核密度计算方法往往基于二维延展的欧氏空间,忽略了城市网络空间中设施点的服务功能及相互联系发生于网络路径距离而非欧氏距离的事实.本研究针对该缺陷,给出了网络空间核密度计算模型,分析了核密度方法在置入网络结构中受多种约束条件的扩展模式,讨论了衰减阈值及高度极值对核密度特征表达的影响.通过实际多种POI点分布模式(随机型、稀疏型、区域密集型、线状密集型)下的核密度分析试验,讨论了POI基础设施在城市区域中的分布特征、影响因素、服务功能.
The visualization and analysis of POI features under network space supported by kernel density estimation
[J].
DOI:10.11947/j.AGCS.2015.20130538
[本文引用: 1]
The distribution pattern and the distribution density of urban facility POIs are of great significance in the fields of infrastructure planning and urban spatial analysis. The kernel density estimation, which has been usually utilized for expressing these spatial characteristics, is superior to other density estimation methods (such as Quadrat analysis, Voronoi-based method), for that the Kernel density estimation considers the regional impact based on the first law of geography. However, the traditional kernel density estimation is mainly based on the Euclidean space, ignoring the fact that the service function and interrelation of urban feasibilities is carried out on the network path distance, neither than conventional Euclidean distance. Hence, this research proposed a computational model of network kernel density estimation, and the extension type of model in the case of adding constraints. This work also discussed the impacts of distance attenuation threshold and height extreme to the representation of kernel density. The large-scale actual data experiment for analyzing the different POIs' distribution patterns (random type, sparse type, regional-intensive type, linear-intensive type) discusses the POI infrastructure in the city on the spatial distribution of characteristics, influence factors, and service functions.
A new procedure using network analysis and kernel density estimations to evaluate the effect of urban configurations on pedestrian mobility
[J].
Unfolding spatial-temporal patterns of taxi trip based on an improved network kernel density estimation
[J].
国家湿地公园时空格局特征
[J].
DOI:10.31497/zrzyxb.20190103
[本文引用: 1]
采用标准差椭圆、点模式分析、统计分析等方法,运用ArcGIS可视化技术,从时间和空间视角分析国家湿地公园的空间格局特征,并探究其与城市的区位关系。研究表明:(1)国家湿地公园在时间序列上分为试点起步阶段、发展与成长阶段和规范发展阶段,各地发展不均衡,“质”的发展不同步于“量”,正式国家湿地公园处于规范发展的起步时期;(2)多尺度空间研究表明正式国家湿地公园空间以聚集分布形态为主,随机分布为辅,整体呈东北—西南分布格局,形成2个高密度热点区和3个中密度次热点区;(3)从城市尺度看,正式国家湿地公园呈现较大空间异质性,具有偏向城市规划区内或靠近城市规划区分布的特征;(4)正式国家湿地公园呈现为人口格局主导特征,响应了胡焕庸线的指导意义。
Spatial-temporal pattern characteristics of national wetland park
[J].
中国渔业经济效率评价及发展趋势预测
[J].
Evaluation and development trend prediction of China’s fishery economy
[J].
文化产业成长对城市空间形态演变的影响——以西安市核心区为例
[J].
DOI:10.11821/dlyj020200139
[本文引用: 1]
基于扩展强度指数、等扇分析法、核密度分析及空间句法等方法,运用1998年、2008年、2018年3个时期的文化产业企业地理数据、夜间灯光数据及城市道路网轴线模型分析西安市核心区文化产业空间成长与城市空间形态演变的特征,探究二者空间关系与作用机制。结果表明:① 西安市核心区文化产业沿“东北-西南”走向扩展,其空间集聚格局逐渐由“单核”“一带两核”向“一轴一带两核”演变。② 核心区城市外部空间形态沿“东北-西南”走向扩展,内部空间形态由“团状单核”“条带状主次双核”向“团带状双核”演变。③ 核心区文化产业成长与城市空间形态演变呈显著的关联性,即不同时期二者空间扩展方向基本一致,空间形态格局演变高度耦合。④ 核心区文化产业先导型发展模式推动城市外部空间形态的扩展,而填充型发展模式,包括在城市建成区的空间扩展与向既有产业集聚区的持续集聚推动着城市内部空间形态的优化。研究对完善文化产业空间研究体系,提升产业空间支撑城市空间转型的协同度方面具有重要意义。
The influence of spatial growth of cultural Industry on the evolution of urban spatial morphology:Taking the core region of Xi’an as a case study
[J].
基于空间句法的扩张强度指数及其在城镇扩展分析中的应用
[J].
DOI:10.11821/dlxb201608002
[本文引用: 1]
扩张强度指数(Expand Intensity Index, EII)是目前城市扩展数量特征研究的常用指标,用以表征城市扩张程度和速度,但该指标是从城市扩张的结果,即从城市用地面积变化角度对物质空间变化的简单描述与分析,忽略了人在空间中的感受,未能从城市扩张的动因角度揭示城市扩张特征,缺乏对城市外部空间形态演变模式的深入研究,不能反映人在城市扩展空间上的活动。本文从交通网络对城市扩张的驱动作用入手,基于空间句法,提出一种新的扩张强度指数——基于空间句法的扩张强度指数(Space Syntax Expand Intensity Index, SS-EII),SS-EII包涵可反映空间集聚和离散程度的句法变量,可用于分析空间可达性的变化等情况。与传统扩张强度指数相比,SS-EII是基于空间句法从城市扩张的驱动力方面计算扩张强度,不仅关注城市扩张的结果,同时关注交通对城市扩张模式、方向的导向作用和人主观感知下城市空间的变化。将SS-EII应用于广东省棉湖镇2002-2014年期间的城镇扩展特征分析中,研究结果表明,SS-EII可用于分析比较建成区不同方向的扩张速率与建设状况,其计算结果与棉湖镇建成区实际扩张情况相符,与EII相关度R2达0.95以上。
Space syntax expand intensity index and its applications to quantitative analysis of urban expansion
[J].
Urban expansion patterns and their driving forces based on the center of gravity-GTWR model:A case study of the Beijing-Tianjin-Hebei urban agglomeration
[J].
