

0 引言
自2020年提出“碳达峰、碳中和”目标以来,我国积极推进生态结构绿色转型,助推高质量发展。在“双碳”背景下,高效开展遥感生态评价与分析对及时掌握生态状况、制定科学合理的生态保护政策具有重要作用。
目前,中国在轨遥感卫星已达200余颗[1],海量丰富的遥感数据为生态评价提供了多样的选择,为改进生态评价方式、提升评价效率提供了客观条件。早期的生态评价往往基于单一遥感指标,但由于生态环境各要素既相互制约又有所区别,单一指标并不能对生态环境的整体状况进行客观的衡量,之后出现的各综合指数又存在数据获取困难、计算繁琐等弊端,导致应用效率较低。为解决上述问题,徐涵秋[2]在2013年提出了遥感生态指数(remote sensing ecological index, RSEI),将生态系统的各部分集成为整体指标,实现了仅以影像为数据源进行定量化的生态评价,从而简化评价过程、提高评价效率。10 a间,学者们在发挥其生态评价优势的同时将其应用于变化检测领域,取得了显著成果。
为了解RSEI模型、系统获知模型当前的应用状况,进而更好地将其应用于生态评价过程,本文基于RSEI相关文献,阐述其产生背景和计算方法; 总结RSEI模型在生态指标维度压缩和区域适应性调整方面的问题及改进方向; 通过对研究现状的了解,归纳RSEI模型在区域生态评价和区域生态变化监测方面的应用、发展趋势和局限性; 最后分析了近年来制约RSEI发展的重要因素以及当前采取的措施,并展望了未来的重点研究方向,以期为后续研究提供思路。
1 RSEI提出背景
表1 RSEI提出之前的几种综合评价指数
Tab.1
| 名称 | 提出时间 | 提出国家/组织 | 单一指数个数 | 评价指数/方面 |
|---|---|---|---|---|
| 环境质量指数(environmental quality index,EQI) | 1993年 | 美国环境保护署 | 20 | 水、土地、建筑、社会人口环境等[12] |
| 省域生态环境质量指数(provincial environmental quality index,PEQI) | 2000年 | 中国 | 13 | 地形起伏度、土壤侵蚀模数、物种丰富度、水/耕地/植被资源指数等[13] |
| 环境综合指数(environmental performance index,EPI) | 2006年 | 美国耶鲁大学和哥伦比亚大学 | 40 | 生物群落保护、草地损失、环境卫生、温室气体排放量、土地覆盖等[14] |
| 生态环境状况指数(ecological index,EI) | 2006年 | 中国国家环境保护总局 | 6 | 生物丰度、植被覆盖、水网密度、土地胁迫、污染负荷和环境限制指数[15] |
2 RSEI原理与研究现状
RSEI是一个用以评价区域生态质量的综合指标,由4个人类能直观感觉生态条件优劣的单一指标以主成分分析(principal components analysis,PCA)的方式集成[16]。单一指标包括绿度、湿度、干度和热度。绿度即比值植被指数,用于度量生态环境的植被覆盖程度和植被类型; 湿度包括降水量、蒸散发量、土壤水分等因素,反映生态环境的含水程度; 干度代表生态系统的干旱程度和水分利用效率; 热度代表环境温度状况[27]。上述指数度量了生态环境固碳能力和参与水循环能力,是生态环境优劣性的重要参考。PCA是一种对多变量进行信息综合的常用数学方法,分析后的第一主分量(PC1)集中了大部分的特征,可以很好地代表各指标的信息[2],因此,RSEI采用PCA方法来集成各单一指标。
2.1 RSEI计算方法
1)绿度。通常由归一化植被指数(normalized difference vegetation index,NDVI)表示,公式为:
式中
2)湿度。为了有效减少数据冗余,进而更加精确地反演出土壤湿度,常采用缨帽变换的湿度分量表征[28]。TM和ETM+传感器的湿度指标分别为:
式中
OLI传感器的湿度指标公式为:
式中
3)干度。干度由裸土指数(soil index,SI)和建筑指数(index-based built-up index,IBI)合成,计算方法为:
式中
4)热度。热度指标由地表温度(land surface temperature,LST)来代表,计算公式为:
式中:
式中:
5)计算RSEI。在正规化[2]和PCA后取PC1,经简单数学处理即可获得初始生态指数
再经过正规化得到
式中
2.2 RSEI研究现状
RSEI提出后,因其具有数据来源简单、对生态状况模拟效果好等优点而得到广泛认同,为更全面了解RSEI指数在生态监测与评价领域的研究与应用价值,对2013—2022年10 a间RSEI的相关文献进行分析。经统计,截止到2022年,中国知网(CNKI)可查询到与RSEI有关文献共510篇(中文415篇,英文95篇),Web of Science(WOS)共计129篇。图1是RSEI自提出到目前为止CNKI及WOS发文量的折线-簇状柱形统计图,从图中可以看出,近5 a来与RSEI有关的研究呈快速上升趋势。
图1
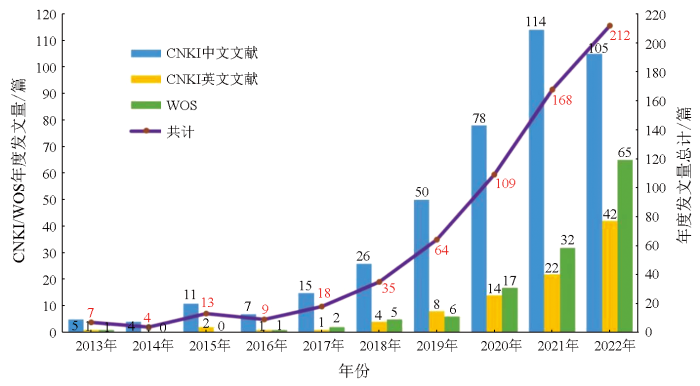
图2
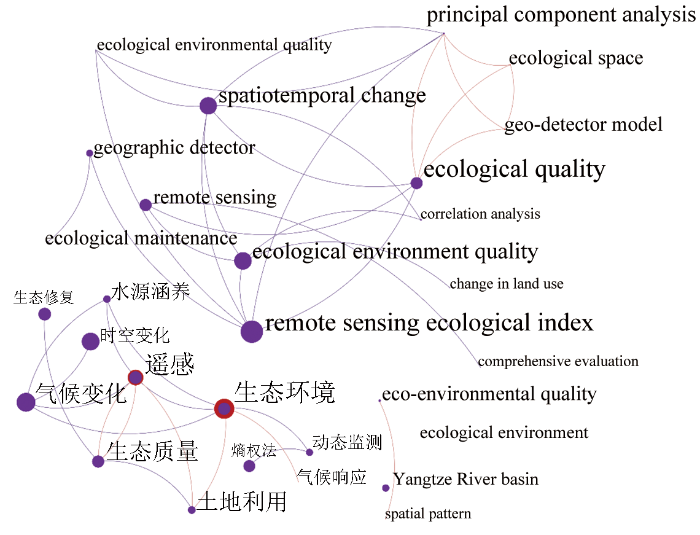
综合上述图表内容,从发文数量的统计图反映出RSEI在10 a间研究热度呈稳步提升的趋势,尤其是近5 a的增幅较大。关键词图谱呈现的文献类型大部分为应用型,说明RSEI模型的应用难度不高,能够推广至实际工作中; 文献主题集中于生态质量的评价与生态变化状况的监测,说明上述2方面是RSEI的主要应用领域。
3 RSEI存在问题及改进
3.1 生态指标维度压缩
实现单一指标高效集成是RSEI模型构建的一大难题,原有单一指标分别反映了区域生态不同方面的特征,而指标集成的实质是各指标生态信息的集成和数据维度的压缩。RSEI采用PCA来集成各单一指标,此方法有2个显著优点: ① PCA生成的荷载值客观确定各指标权重,实现了非人为主观定权[31]; ② 通过旋转坐标轴可将多维特征空间中的数据集中于少数几个特征分量,从而在保留大部分信息的基础上实现去相关性、降维和数据压缩。然而,部分学者认为PCA存在一定局限性,会影响RSEI的计算结果,需通过修改RSEI模型或替换PCA来规避这一影响,有关PCA是否适用于单一指标集成的问题也引发了学界的持续讨论,具体如表2所示。
表2 PCA是否适用于单一指标集成的讨论
Tab.2
| 问题 | 观点/讨论 | 修改方式 | 局限性 |
|---|---|---|---|
| 是否仅用第一主成分(PC1)构建RSEI0 | 仅用PC1信息利用不充分[32] | 以PC1,PC2,PC3的贡献率为权重 | PC2,PC3无生态学意义[33] |
| 批驳: PC2和PC3会干扰原有生态信息,不能忽略主分量包含的遥感信息而仅考虑增加信息量[34] | |||
| PCA高值的生态意义不定 | PC1不能保证较高的贡献率,PCA变换后高值部分代表的生态优劣性不定[35] | 权重计算采用熵权法,之后采用指数和法计算RSEI | 比RSEI更复杂 |
| PCA评价、权重确定方法的合理性 | 除利用PCA构建RSEI外,结合其他方式综合评价的可靠性更高[36] | 以层次分析法、熵值法结合博弈论思想确定组合权重 | 模型构建复杂 |
| 大面积建立RSEI指标权重的方法(基于数值的权重评估法)不利于计算和决策认知[37] | 建立基于知识粒化熵的RSEI确定方法 | 指标变异性大小计算较为复杂 | |
| 特征向量方向存在不确定性 | ①特征向量及其方向决定RSEI结果及空间分布,空间分布的随机性导致无法批量计算RSEI; ②特征向量方向不影响特征值贡献率,也不影响同一分量中各指标的绝对值; ③NDVI和Wet的方向、LST与NDSI的方向在PC1中相同[38] | 人工修改PC1的特征向量方向,取NDVI和Wet的特征向量的绝对值和NDSI和LST的相反绝对值,使用PC1代替1-PC1计算生态环境质量指数 | 需人工修改特征向量方向 |
| 是否适用PCA模型 | 构成RSEI的4个指标间可能存在弱线性或非线性关系[39-40] | 利用核主成分分析构建非线性遥感生态指数 nRSEI | 算法论证不充分、精度验证不合理[31] |
| 批驳: 指标间呈强相关关系且改进后的nRSEI还会出现过拟合、数据爆炸等问题,核主成分分析的应用不合理[31] | |||
由上表可知,用PCA算法进行指标集成在生态信息保留、模型计算结果稳定性方面存在争议。然而,为了使集成后的RSEI能有效评价生态状况,改进的算法也必须满足以下条件: 第一,计算后的综合指数是原有单一指标生态信息的有机整合,须兼顾信息完整性和真实性; 第二,简单易行,具有鲁棒性; 第三,指标权重计算合理,保留单一指标间呈现出的相互关系。10 a间,虽然针对PCA指标集成的改进算法众多,但都因存在扭曲生态信息[32⇓-34]、模型计算复杂[35⇓-37]、存在人为干预[38]或错误评估指标相关关系[39-40]等问题而未得到学界公认,因此,目前采用PCA算法集成单一指数仍是主流。未来,将会有更多用于单一指标集成的方法被提出,但只有在满足改进条件、遵循遥感基础知识的前提下实现最大化保留生态信息、保证计算结果的稳定性的算法才可能成为替代PCA的更优算法。另外,除指标集成过程,集成前后的正规化和遥感建模共线性、模型普适性等方面也将是生态指标维度压缩问题的研究重点。
3.2 模型区域适应性调整
虽然RSEI单一指标的选取标准为适用于陆地生态系统,但随着模型逐渐推广,当RSEI的应用扩展至森林、草原、湿地等不同类型的研究区时,生态结构的差异会导致RSEI的应用效果无法在所有研究区达到最佳,为了能有所侧重地进行生态评价,大量研究采用替换或增加指标的方式调整RSEI指数,例如为解决半干旱或干旱地区城区和绿洲面积少、干度指标失去代表性的问题构建的SA-RSEI[41],ARSEI[42],ORSEI[43],DRSEI[44],以及为适应流域特征构建的改进RSEI[45]、考虑到大气污染和空气颗粒物的影响构建的ARSEI[46]和RSEInew[47]、为体现人类活动强度构建的IRSEI[48]、为消除水体和水生植被影响构建的WRSEI[49]等,对于有明显特征的研究区,如沙漠、流域、有严重污染和密集人口的城市等,在契合模型构建原理和遥感基础知识的前提下,添加指数能更好地反映研究区生态状况,提升模型应用灵活性和评价准确性。
上述改进指数以适应特定土地类型为目的,具有较强的针对性,然而,对于不同土地类型研究区都呈现出的通用性局限,也需要进行相应模型调整。例如,尺度是影响区域生态评估结果的重要因素之一,尺度差异巨大指标合成后的RSEI影像质量显著低于同尺度指标合成影像,同时,不同尺度范围内各生态要素相互作用还会使生态系统呈现不同的功能和结构, RSEI使用行政边界划分区域[50]是相对不准确的。为减小尺度影响,Zhu等[51]通过构建MW-RSEI将RSEI的结果区域化; Jiang等[52]通过滑动窗口进行索引优化并与标准化、翻转和映射方法相结合,以适应大规模监测需求。除尺度外,影像获取时间的差异[53]、传感器的不一致[54]、大规模噪声的影响[55]等也会影响RSEI计算结果,基于通用性局限进行的适应性调整对于不同研究区同样适用,这些改进模型经验证后可发展为通用性模型以提升评估准确性。
4 RSEI应用状况分析
4.1 区域生态状况评价
评价研究区生态环境质量是RSEI指数解决的实际问题之一,也是RSEI模型与其他遥感监测过程结合的出发点。生态环境的评价主要包含2部分内容: 界定某一区域生态“优”或“劣”以及获得区域生态“优”或“劣”的分布。
生态质量评估的定量基础为RSEI指数的数值大小,之后形成RSEI生态评价模型,将生态质量分为差、较差、中等、良好、优5个等级,各等级范围及意义如表3所示。
表3 RSEI对应生态等级及意义
Tab.3
| RSEI范围 | 生态等级 | 生态系统 | 生物多样性 | 生态服务功能 |
|---|---|---|---|---|
| (0.8,1.0] | 优 | 稳定 | 丰富 | 完好 |
| (0.6,0.8] | 良好 | 基本稳定 | 较丰富 | 良好 |
| (0.4,0.6] | 中等 | 较脆弱 | 较贫乏 | 受影响 |
| (0.2,0.4] | 较差 | 不稳定 | 极其贫乏 | 受损严重 |
| [0.0,0.2] | 差 | 崩溃 | 基本消失 | 彻底丧失 |
根据生态质量等级制图即可得到生态环境“优”或“劣”的空间分布,了解生态环境的区域特征,如柯丽娜等[59]分析辽东湾北部1995—2021年的5期影像并制图,图上呈现内陆区生态优于滨海区的特征; 刘恺恺等[60]发现围垦会导致生态环境剧烈退化,制图结果表明研究区生态高低质量的分布重心在西北—东南方向上摆动; Zhang等[61]构建长江中游RSEI后制图探究长江生态格局,发现研究区中、东部生态退化明显; Li等[62]结合RSEI与PCA-AHP-TOPSIS模型评估京杭大运河沿线生态状况,发现大运河中、南段的生态更好,北段的生态格局独特等。生态等级制图是为了实现整体-区域-整体的过程,整体生态是由区域生态构成的,了解区域生态状况有助于探究整体生态格局的成因。
由上述文献可知,基于RSEI模型的生态环境评价是利用影像光谱信息,关注研究区在影像上呈现的“静态”特点和空间特征,生态评价模型为生态等级制图提供依据,制图后研究区生态质量呈现出的空间特征又可辅助研究者明确生态格局,重点关注脆弱区的生态安全并进行后续研究。然而,RSEI的区域生态评价也由一定局限性,比如RSEI指数是针对陆地生态系统开发的,在应用过程中必须去除水元素的信息,此外还有RSEI数值在极端生态环境中的不稳定现象[63]、RSEI模型的通用性较差、计算结果具有随机性[64]等等。在区域生态评价过程中,对于固有“弊端”如缺乏水元素信息的问题,仅能结合别的评价方式实现区域生态的“全要素”评价而不能盲目增加水指标,计算结果不稳定和模型缺乏通用性等问题则可以通过改进算法来解决。
4.2 区域生态变化监测
生态环境的变化监测,实质是评估生态环境随时间的变化,而生态变化监测的本质是以下3个问题: 是否发生变化、发生了什么类型的变化以及变化趋势[65],3个问题间的逻辑关系层层递进。
发生了什么类型的变化,实质是检测土地利用类型的转变,通常将RSEI与分类方法及已有地学资料相结合,如朱明水[70]将RSEI结合支持向量机、随机森林、梯度提升树的分类结果,发现2000—2020年研究区林、耕地转化为建设用地; Tang等[71]将RSEI结合最大似然分类法分析铜陵矿区林地转为建成和采矿区带来的生态扰动; 蒋超亮等[72]发现当古尔班通古特沙漠RSEI增大时,沙漠变为植被覆盖和灌木区; 石运杰[73]对珠峰自然保护区的研究表明,1988—2018年间农业种植地、道路和居民点增加、湿地面积减少,湿地面积与牲畜承载量显著相关。土地利用类型一定程度上反映了人类活动与生态的关系,监测土地利用类型变化有利于调整生产秩序,平衡人与自然的关系。
变化分布的趋势即生态环境质量变好、变坏或基本保持的状态,一般采用常规分析结合预测模型得出。例如Wu等[74]采用衬垫回归和波动分析法研究RSEI变化趋势并应用Hurst指数评估非洲萨赫勒地区未来生态环境质量; 王丽霞等[75]计算延河流域18 a间4期影像的RSEI,用CA-Markov模型模拟2022年并预测2028年的生态环境; Xu等[76]利用特征反演和改进的RSEI对雄安新区土地覆被类型进行研究并开发统计模型预测人口和相关不透水面(impervious surface,IS)增加的生态效应; 陈孟[77]利用混合像元分解技术提取地表覆盖信息并构建多元回归方程,预测2035年成都市生态状况。了解变化趋势的意义在于其对未来的“预见性”,目的是掌握生态的潜在风险以便及时干预,是大量与RSEI变化检测有关文献的研究焦点。
4.3 RSEI发展展望
众所周知,生态系统的稳定性是关乎国家前途命运的百年大计,守住自然生态安全边界是必须长期坚持的底线[80],进行生态评价与生态变化监测与当前国家发展紧密联系在一起。近几年,作为一个简单易用的生态综合评价指数,RSEI不仅在国内得到了广泛应用,在国际上的影响力也在逐步扩大。未来,RSEI仍有广阔的发展空间,同时也有以下几个问题亟待解决:
1)在模型算法改进方面,虽然目前已有不少学者对指标集成、归一化过程提出改进,却仍无更为简单、鲁棒的算法能替代原有方法; 在区域适应性调整方面,目前的调整可分为适应土地类型的调整和适应尺度差异等其他因素的调整,但两种调整过程中都掺杂着人为的主观判断或先验知识,难以应对更加复杂多变的监测需求。因此,如何提升模型通用性和模型自适应性将成为日后的研究重点。
2)遥感影像获取能力的提升使得影像分辨率逐渐提高、监测周期不断缩短,为大范围、长时序、密集时间间隔的生态监测提供了便利,基于时间维度的动态分析和空间维度的异质性分析成为新的研究热点,但由于RSEI完全来源于影像,影像时间序列的不稳定和空间尺度的不一致成为了制约该领域发展的重要因素[81]。对于这一问题,当前部分研究采用时间序列谐波分析[79]、数据重构[81]、连续变化检测和分类(continuous change detection and classification,CCDC)[79]、时空预测[82]等算法对评价过程进行优化以减弱时间序列不稳定影响,采用区域尺度优化[55]等方式减弱空间尺度不一致的影响,然而上述方法的处理效果尚未达到能忽略甚至解决该问题的程度,今后还需进行大量研究。
3)影像数量的大幅增加为生态评价提供了丰富的数据源,但也形成了对影像存储、处理和利用能力的严峻考验。目前,对云平台的应用很好地缓解了这一压力,云平台存储了丰富的历史影像和地理空间数据库[83],拥有大尺度的地理空间分析和批量处理数据能力,有助于克服遥感数据缺失、色差、时空不一致等问题[53],大大提高影像处理效率,因而在对各城市群和自然保护区[84⇓⇓⇓⇓-89]进行生态监测的过程中发挥了极大的优势。但是,云平台虽具有优秀的影像存储和批处理能力,却对每批数据的承载量仍有一定限制且无法实现对影像的自主处理。近年,人工智能领域的兴起也给生态评价与生态变化监测领域带来了发展机遇,未来若能实现RSEI模型与深度学习的紧密结合,无疑将会大大提升生态评价的智能化程度。
5 总结
“碳达峰”与“碳中和”是着力解决资源环境约束突出问题、维护国家生态安全、实现中华民族永续发展的必然选择[94]。利用RSEI进行的遥感生态评价和生态变化监测有助于及时掌握生态环境状况、分析生态发展趋势,对推动实现“碳达峰”与“碳中和”具有重要意义。通过回顾RSEI的产生背景和计算方法,分析RSEI的研究现状,不难发现相比于其他生态评价指数,RSEI具有综合性强、客观、简单易用等优点,现已广泛应用于区域生态评价和区域生态变化监测等领域。但是,RSEI的应用仍存在不少挑战,例如:
1)在生态指标维度压缩方面仍存在问题,在区域生态的适应性调整过程中还存在通用性差、主观性强的缺点。
2)目前基于RSEI的生态评价尚无法实现“全要素”、尚无法实现智能化处理。
3)在大范围、长时序、密集时间间隔的生态监测趋势下,影像存储和批处理能力的落后、影像时间序列的不稳定、空间尺度的不一致等问题都成为了制约RSEI生态环境评价和生态变化监测发展的重要因素。
4)基于RSEI的新兴研究方向——生态格局成因探究和生态驱动力分析还存在分析手段单一、分析层次不深入的问题。
结合近年来人工智能领域兴起、影像获取能力提升、计算机存储和处理能力提升等趋势,未来,如何利用深度学习等方法、结合数理统计等多方面的知识对模型进行更严密的论证,如何从改进算法、提升算力等方向解决上述问题、提升RSEI应用的智能化将成为研究重点。
通过本文的总结,希望能帮助读者了解遥感生态指数RSEI的产生背景、计算方法以及研究现状,同时引起对RSEI现有问题进行深入探究的兴趣,以便于更好地实现对生态状况的评价和监测,理解国家“双碳”战略对于维护生态安全和可持续发展的重大意义。
参考文献
城市遥感生态指数的创建及其应用
[J].
A remote sensing urban ecological index and its application
[J].
山水林田湖草生态保护修复项目遥感监测及辅助绩效评价
[J].
Remote sensing technology for monitoring and auxiliary performance evaluation of ecological protection and restoration projects for mountains,rivers,forests,farmlands,lakes,and grasslands
[J].
基于“面向对象+深度学习”的遥感信息智能化提取技术
[C]//
Intelligent extraction technology of remote sensing information based on“object oriented+deep learning”
[C] //
基于多源遥感指数监测山区植被动态及其驱动因子的不确定性分析——以尼泊尔地区为例
[J].
Uncertainty analysis of monitoring vegetation dynamics and driving factors in mountains based on multiple remote sensing indices:A case study of Nepal
[J].
基于RSEI的生态环境质量评价及驱动力分析——以闽江流域(福州段)为例
[J].
DOI:10.13474/j.cnki.11-2246.2023.0036
[本文引用: 1]

生态环境对社会经济可持续发展至关重要。为了研究闽江流域(福州段)生态环境的变化情况,本文以2010、2015和2021年的遥感影像为基础,通过主成分分析构建遥感生态指数(RSEI),对闽江流域(福州段)近12年的生态环境质量进行评价和监测,并结合地理探测器对其变化原因进行分析。结果表明:①闽江流域(福州段)2010、2015和2021年的RSEI指数分别为0.62、0.70和0.68。②大部分地区的RSEI指数等级为良和优;生态变好的面积大于生态变坏的面积,生态环境整体向好发展。③干度和热度是生态环境质量时空变化的关键驱动因子。
Eco-environmental quality assessment and driving force analysis based on RSEI:A case study of the Minjiang River basin (Fuzhou section)
[J].
环境整体主义的生态学基础
[J].
Ecological basis for environmental holism
[J].
City noise-air:An environmental quality index for cities
[J].
中国省域生态环境质量评价指标体系研究
[J].
A preliminary study on assessment indicator system of provincial eco-environmental quality in China
[J].
生态环境状况指数模型在全国生态环境质量评价中的应用
[J].
The application of ecological environment index model on the national evaluation of ecological environment quality
[J].
区域生态环境变化的遥感评价指数
[J].
A remote sensing index for assessment of regional ecological changes
[J].
基于遥感技术的白水河流域生态环境质量现状研究
[J].
Ecological environment quality of Baishui River basin based on remote sensing technology
[J].
应用遥感技术对湖州生态环境质量状况分析
[C]//
Analysis of ecological environment quality in Huzhou using remote sensing technology
[C]//
耕地易地补充经济补偿的生态价值——以江阴市和兴化市为例
[J].
Evaluation of ecological value compensation using exchange of farmland:A case study with data from Jiangyin and Xinghua,China
[J].
基于遥感生态指数的道路网络生态效应分析——以福州市为例
[J].
The ecological effect of road network based on remote sensing ecological index:A case study of Fuzhou City,Fujian Province
[J].
基于遥感生态指数的新疆玛纳斯湖湿地生态变化评价
[J].
Evaluation of ecological changes based on a remote sensing ecological index in a Manas Lake wetland,Xinjiang
[J].
Ecological environment dynamic monitoring and driving force analysis of Karst world heritage sites based on remote-sensing:A case study of Shibing Karst
[J].
基于地理探测器的四川省大熊猫国家公园生态环境时空变化及其归因分析
[J].
Spatiotemporal variation and driving forces of ecological environment of Giant Panda National Park in Sichuan Province based on geographical detector
[J].
DOI:DOI: 10.13292/j.1000-4890.202304.012
[本文引用: 1]
The ecological environment of giant panda (<em>Ailuropoda melanoleuca</em>) habitat directly determines the reproduction and continuation of giant panda population. The quantitative evaluation of giant panda ecological environment and its influencing factors is of great scientific and application significance for the planning and management of Giant Panda National Park (GPNP) in the Qionglai-Daxiangling Mountain region of Sichuan Province. Based on the remote sensing ecological index (RSEI), we analyzed ecological environment status and its spatiotemporal variation of the study area before (2015) and after (2021) establishment of GPNP. The contribution of natural and social driving factors to the ecological environment status of the park was quantitatively analyzed by using the geographical detector. The results showed that: (1) The proportion of “excellent” and “good” grades of ecological environment status in the park was high (~70% in total), and most of them were distributed in the core zone of the GPNP. The overall ecological environment status of the region was good. (2) Compared with 2015, the RSEI levels of “excellent” and “poor” in 2021 were reduced and transferred to the other levels. The ecological quality of the region changed slightly as a whole, with obvious regional differences. The ecological environment status fluctuated greatly in the northwest region with higher elevation and the general control zone with more human activities in the southwest of the study area. (3) Natural factors were the main driving forces leading to the change of ecological environment status, followed by human factors. The order of contribution of the top six factors was: the normalized vegetation index (NDVI, 0.87) > dryness index (0.58) > wetness (0.54) > altitude (0.38) > land-cover type (0.37) > annual average temperature (0.36), with strong interactions between NDVI and the other factors. More attention should be paid to the most suitable areas, such as those of NDVI value of 0.875-1, altitude of 1720-2150 m, annual average temperature of 14.1-16.3 ℃, and those covered by coniferous forests. This study can provide an important reference for the evaluation and protection of giant panda habitat quality in the GPNP.<br><div> <br></div>
What are the correlations between human disturbance,the spatial pattern of the urban landscape,and eco-environmental quality?
[J].
基于IRSEI的石羊河流域生态环境质量时空变化及驱动力分析
[J].
Changes in spatial-temporal patterns of ecological environment quality in Shiyang River and driving forces:An analysis based on improved remote sensing ecological index
[J].
Comprehensive eco-environment quality index model with spatiotemporal characteristics
[J].
Biodiversity conservation in China:Advances and challenges
[J].
基于遥感生态指数的杭州市城市生态变化
[J].
Ecological change in the Hangzhou Area using the remote sensing based ecological index
[J].
RSEI应使用主成分分析或核主成分分析?
[J].
Should RSEI use PCA or kPCA?
[J].
基于改进遥感生态指数模型的锡林郭勒草原生态环境评价
[J].
Evaluation of ecological environment in the Xilin Gol Steppe based on modified remote sensing ecological index model
[J].
MRSEI指数的合理性分析及其与RSEI指数的区别
[J].
DOI:10.11873/j.issn.1004-0323.2022.1.0001
[本文引用: 2]
遥感生态指数(RSEI)自提出以来,已得到广泛的应用。近年来,也有学者对其进行了修改。研究基于主成分变换的机理和应用实例,分析了修改的遥感生态指数(MRSEI)的合理性及其与RSEI的区别。结果表明:MRSEI指数将不具生态含义的第二主成分和第三主成分加入具有明确生态含义的第一主成分进行加权求和计算,其结果不仅降低了第一主成分的占比,无法增加原RSEI的信息量,而且还导致各主成分分量互相干扰,造成MRSEI结果的低估或高估。因此,这一修改缺乏合理性。研究同时还对用户在计算RSEI指数中碰到的一些问题进行分析。RSEI在使用中应注意采用植物生长季节的地表反射率数据;当研究区有大面积水体时,必须对水体进行掩膜;而只有当对生态起正面影响的绿度(NDVI)和湿度(Wet)指标在PC1的载荷为负值时,才必须进行“1 – PC1”的还原运算。
Rationality analysis of MRSEI and its difference with RSEI
[J].
RSEI or MRSEI? Comment on Jia et al.Evaluation of eco-environmental quality in Qaidam Basin based on the ecological index (MRSEI) and GEE.Remote Sens.2021,13,4543
[J].
基于改进的遥感生态指数的北京市门头沟区生态环境质量评价
[J].
Evaluation of eco-environmental quality in Mentougou District of Beijing based on improved remote sensing ecological index
[J].
DOI:10.13292/j.1000-4890.202104.021
[本文引用: 2]
Based on data derived from Landsat images in 2001, 2006, 2010, 2014, and 2018, we calculated the weight of selected indices using the entropy weight method and the remote sensing ecological index (RSEI) using the index weighted sum method. Combined with GM (1,1) model, we analyzed the dynamics of eco-environmental quality and its causes in Mentougou District of Beijing and predicted the future trend. The results showed that the RSEI of Mentougou in 2001, 2006, 2010, 2014 and 2018 were 0.5993, 0.5451, 0.5592, 0.6113 and 0.716, respectively, displaying a trend of “decline first and then rise”. The areas with “excellent” and “good” eco-environmental quality were mainly forestland and shrub land. “Inferior” and “poor” areas were dominated by bare land, urban land use and roads. Mining activity was the main cause for the decline of RSEI from 2001 to 2006. Since 2006, urbanization had negative impacts on the eco-environmental quality of Mentougou District. Some key projects had improved the ecoenvironmental quality. The Beijing-Tianjin sandstorm source control project had a remarkable positive effect on the eco-environmental quality of Mentougou. The visual expression of eco-environmental quality can better reflect the changes of eco-environmental quality and provide better support for the maintenance of ecological balance.
Evaluation of the spatiotemporal variations in the eco-environmental quality in China based on the remote sensing ecological index
[J].
The improvement of ecological environment index model RSEI
[J].
改进型遥感生态指数与RSEI的对比分析
[J].
Comparison between modified remote sensing ecological index and RSEI
[J].
Assessment of ecological environment quali-ty in rare earth mining areas based on improved RSEI
[J].
半干旱地区遥感生态指数的构建及应用
[J].
Construction and application of remote sensing ecological index in semi-arid region
[J].
干旱地区遥感生态指数的改进——以乌兰布和沙漠为例
[J].
DOI:10.13287/j.1001-9332.202011.011
[本文引用: 1]
干旱区以荒漠为主要背景,生态环境脆弱,极易受到自然和人为因素的影响。为了定量评价干旱区生态环境质量,基于遥感生态指数(RSEI),针对干旱区对其进行改进,构建了干旱遥感生态指数(ARSEI),该指数耦合了绿度、湿度、盐度、热度以及土地退化度信息。利用ARSEI和RSEI对乌兰布和沙漠2000—2019年生态环境质量进行动态监测和评价,分析两者的差别及在干旱区的适用性。同时分析乌兰布和沙漠生态环境质量时空变化特征及原因。结果表明: ARSEI比RSEI对干旱区生态环境质量具有更好的适用性,ARSEI增强了土地利用类型变化在生态环境质量评价中的作用。2000—2019年,乌兰布和沙漠生态环境质量整体上为差。等级为优、良、中的部分主要分布在沙漠北部,等级为差的部分主要集中在戈壁和沙地处,较差主要在低覆盖度植被区。2000—2019年,乌兰布和沙漠生态环境质量总体变好,沙漠北部城镇或农场生态环境质量变化复杂,变差和变好交替分布。生态农业和沙产业对生态环境质量有明显的改善作用,这是乌兰布和沙漠生态环境质量变化的主要原因。
Improvement of remote sensing ecological index in arid regions:Taking Ulan Buh Desert as an example
[J].
干旱区绿洲遥感生态指数的改进
[J].
Improvement of remote sensing ecological index in oasis in arid area
[J].
基于改进遥感生态指数的甘肃省古浪县生态质量评价
[J].
Ecological quality evaluation of Gulang County in Gansu Province based on improved remote sensing ecological index
[J].
基于谷歌地球引擎和改进型遥感生态指数的西安市生态环境质量动态监测
[J].
Dynamic monitoring of eco-environmental quality in Xi’an based on GEE and adjusted RSEI
[J].
基于理想参照系-关键指标的赤水河流域生态系统质量变化趋势分析
[J].
Analysis the trend of ecosystem quality based on ideal reference and key parameters in the Chishui River basin,China
[J].
顾及PM2.5浓度遥感生态指数模型的沧州市区生态环境质量动态监测分析
[J].
Dynamic monitoring and analysis of ecological environment change in Cangzhou City based on RSEI model considering PM2.5 concentration
[J].
利用改进城市遥感生态指数的苏州市生态分析
[J].
Ecological analysis of Suzhou City using improved urban remote sensing ecological index
[J].
一种改进的遥感生态指数构建及湿地监测应用
[J].
An improved remote sensing-based ecological index and its application in wetland environment monitoring
[J].
Environmental analysis of mining operations:Dynamic tools for impact assessment
[J].
Monitoring the effects of open-pit mining on the eco-environment using a moving window-based remote sensing ecological index
[J].
DOI:10.1007/s11356-020-08054-2
PMID:32086733
[本文引用: 1]
Environmental problems caused by mines have been increasing. As one of the most serious types of mining damage caused to the eco-environment, open pits have been the focus of monitoring and management. Previous studies have obtained effective results when evaluating the ecological quality of a mining area by using the remote sensing ecological index (RSEI). However, the calculation of RSEI does not consider that the ecological environmental impact is limited under natural conditions. To overcome this shortcoming, this paper proposes an improved RSEI based on a moving window model, namely the moving window-based remote sensing ecological index (MW-RSEI). This improved index is more in agreement with the First Law of Geography than RSEI. This study uses Landsat ETM/OLI/TIRS images to extract MW-RSEI information of a case area in Zhengzhou City, Henan Province, central China, in 2009 and 2018. The results revealed that the average value of MW-RSEI declined from 0.668 to 0.611 from 2009 to 2018, and the main drivers of the deterioration of the eco-environment were land use/cover (LUCC) changes, most of which were derived from urban expansion and mining. The serious impact of open pits on the eco-environment in mining areas is mainly due to their low vegetation cover; therefore, some effectively managed open pits can have a positive impact on the mining environment. The use of MW-RSEI provides valuable information on the eco-environment surrounding the open pit, which can be used for the rapid and effective monitoring of the eco-environment in mining areas.
Research on remote sensing ecological environmental assessment method optimized by regional scale
[J].
DOI:10.1007/s11356-021-15262-x
PMID:34264496
[本文引用: 1]
As the global ecosystem has been severely disturbed by an increasing number of human activities at different scales, remote sensing technology, as an effective quantitative measure of environmental quality, has been widely used. The remote sensing ecological index (RSEI) is one of the most popular and comprehensive ecological quality assessment indices based on the remote sensing data. However, the RSEI model exhibits that the ecological environment under natural conditions is not limited by the spatial scales. In addition, the model has major shortcomings in index selection and eigenvector, which greatly limit the application of RSEI. In this paper, the RSEI model is improved and a remote sensing ecological index optimized by the regional scale (RO-RSEI) is proposed. The result of the study, conducted in Shuangyang District, Changchun City, Jilin Province, shows that the RO-RSEI model has regional ecological significance after the introduction of the scale theory of landscape ecology; the index is preferred to solve problems like the RSEI model applied mechanization and baseless index selection. Meanwhile, due to the optimization of the eigenvector contribution of the optimal index, it solves the problems like non-unique model calculation result caused by principal component analysis or even antipodal calculation result. Compared with the RSEI model, the monitoring result of RO-RSEI model can better reflect the regional ecological changes. The improved model offers the possibility of monitoring ecological environment quality with remote sensing big data and provides a scientific basis for future scholars' batch computing.© 2021. The Author(s), under exclusive licence to Springer-Verlag GmbH Germany, part of Springer Nature.
Ecological environment evaluation based on remote sensing ecological index:A case study in East China over the past 20 years
[J].
基于GEE的遥感生态指数时序计算
[J].
Time series calculation of remote sensing ecological index based on GEE
[J].
Spatio-temporal heterogeneity of ecological quality in Hangzhou greater bay area (HGBA) of China and response to land use and cover change
[J].
基于遥感生态指数的武汉市生态环境质量评估
[J].
Evaluating the quality of ecological environment in Wuhan based on remote sensing ecological index
[J].
基于遥感生态指数的信江流域生态环境质量评价
[J].
Evaluation of ecological environment quality in Xinjiang River basin based on remote sensing ecological index
[J].
Temporal and spatial variations of eco-environment in association of Southeast Asian Nations from 2000 to 2021 based on information granulation
[J].
基于遥感生态指数的滨海湿地生态质量变化评价——以辽东湾北部区为例
[J].
DOI:10.16258/j.cnki.1674-5906.2022.07.014
[本文引用: 1]
滨海湿地作为海陆交错地带,对于控制海洋污染、调节气候、平衡碳收支具有重要作用,对滨海湿地生态质量及其变化驱动因素进行研究具有重要意义。以辽东湾北部区域为研究对象,选取1995、2002、2009、2018及2021年共5期Landsat遥感影像,利用遥感生态指数(RSEI),对辽东湾北部区域1995—2021年生态质量变化状况进行评价及成因分析。结果表明,(1)1995—2021年辽东湾北部区域生态环境质量整体呈波动上升趋势,1995、2002、2009、2018和2021年研究区RSEI指数均值分别为0.407、0.593、0.510、0.592、0.556,26年间研究区RSEI上升了36.61%。就空间分布而言,生态优良及中等区域主要集中在双台子河河口两岸,生态差和较差区域主要出现在滨海地区。对RSEI以0.2为间隔分级处理后,发现1995、2009、2021年生态质量相似,研究区生态等级以“中等”为主;2002年和2018年生态质量相似,均以“良”为主;“差”和“较差”等级面积及所占比例呈逐年减小的趋势,整体上辽东湾北部区生态环境质量有所改善。(2)1995—2021年辽东湾北部区生态改善,其中“变好”面积达到1418.76 km<sup>2</sup>,占比为88.03%,而其中“略微变好”面积占比最大,为1403.53 km<sup>2</sup>,达87.08%,说明辽东湾北部区设立国家级自然保护区后生态得到了较好的恢复;“变差”面积为192.85 km<sup>2</sup>,占比为11.97%,而其中“略微变差”面积为192.17 km<sup>2</sup>,占比为11.93%。研究结果可为研究区区域生态环境治理提供一定的参考。
Evaluation of ecological quality of coastal wetland based on remote sensing ecological index:A case study of northern Liaodong Bay
[J].
基于RSEI模型的滨海围垦区生态环境动态变化分析——以杭州湾南岸为例
[J].
Dynamic change analysis of ecological environment in coastal reclamation area based on RSEI model:A case study of southern bank of Hangzhou Bay
[J].
Research and analysis of ecological environment quality in the middle reaches of the Yangtze River basin between 2000 and 2019
[J].
Estimation of remote sensing based ecological index along the Grand Canal based on PCA-AHP-TOPSIS methodology
[J].
Land surface ecological status composition index (LSESCI):A novel remote sensing-based technique for modeling land surface ecological status
[J].
RSEIFE:A new remote sensing ecological index for simulating the land surface eco-environment
[J].
多时相遥感影像的变化检测研究现状与展望
[J].
DOI:10.11947/j.AGCS.2022.20220070
[本文引用: 1]
变化检测作为摄影测量与遥感领域的研究热点之一,也是人工智能体系中极具研究价值的技术分支。二者的快速发展与深度融合,已使海量、复杂和多样的遥感数据快速智能化处理成为可能,广泛应用于资源监测、城市规划、灾害评估等诸多领域。随着遥感技术和计算能力的不断革新,变化检测体系也在不断发展和演化。本文主要从几何和语义两个角度对变化检测方法进行了分析和归纳总结,重点分析了几何信息的利用方式及深度神经网络的特征融合方式,随后总结了常用的变化检测公开样本数据集,最后对当前变化检测应用中遇到的核心问题及未来发展趋势进行了梳理与展望。
Review and prospect in change detection of multi-temporal remote sensing images
[J].
DOI:10.11947/j.AGCS.2022.20220070
[本文引用: 1]
Change detection (CD), as one of the hot spots in the field of photogrammetry and remote sensing, is a technology branch with important research value in artificial intelligence (AI) systems. The rapid development and deep integration of the two subjects have made it possible to automatic and intelligent process the massive, complex and diverse remote sensing datasets. It has been widely used in many areas, such as resources monitoring, urban planning, disaster assessment, etc. With the development of the remote sensing and computing power, change detection is also evolving. This paper mainly analyzes and summarizes the current change detection methods from the perspectives of geometry and semantics. We focus on the utilization of geometric information and the feature fusion method of deep neural networks. Furthermore, the paper provides a summary of open datasets derived from different sensors, along with information related to change detection. Finally, we point out the challenges of the change detection and the future trends of the area are summarized and prospected.
基于RSEI指数的合肥市城市生态变化
[J].
Urban ecological change in Hefei based on RSEI index
[J].
基于遥感指数的生态变化评估——以常宁市为例
[J].
Ecological changes assessment based on remote sensing indices:A case study of Changning City
[J].
基于遥感生态指数的阜新市生态质量评估
[J].
Ecological change assessment of Fuxin based on remote sensing ecological index
[J].
Eco-environmental quality monitoring in Beijing,China,using an RSEI-based approach combined with random forest algorithms
[J].
Impact of land cover change on a typical mining region and its ecological environment quality evaluation using remote sensing based ecological index (RSEI)
[J].
干旱荒漠区生态环境质量遥感动态监测——以古尔班通古特沙漠为例
[J].
DOI:10.13287/j.1001-9332.201903.008
[本文引用: 1]
利用遥感生态指数(RSEI)对区域生态变化进行评价,可以快速、高效、客观地获取研究区生态环境变化状况.本研究以两期Landsat数据为数据源,计算研究区绿度、湿度、热度、干度4个生态因子的遥感生态指数,并基于主成分分析法确定其权重,对古尔班通古特沙漠2006—2017年间的生态环境时空格局进行定性和定量评价.结果表明: 湿度和绿度对古尔班通古特沙漠生态环境质量起正面作用,而热度和干度对生态环境质量起负面作用,其中代表绿度指标的归一化植被指数(NDVI)的贡献最大.2006—2017年间,古尔班通古特沙漠的RSEI有所下降,其均值从0.294下降至0.243,降幅达20.1%,研究区的生态环境状况呈现整体变差的趋势.古尔班通古特沙漠中部生态环境较为稳定,东北部植被覆盖密集区及南缘灌溉区生态环境质量变好,沙漠南部及西北部区域生态环境质量变差.
Dynamic monitoring of eco-environmental quality in arid desert area by remote sensing:Taking the Gurbantunggut Desert China as an example
[J].
Ecological environment quality evaluation of the Sahel region in Africa based on remote sensing ecological index
[J].
DOI:10.1007/s40333-022-0057-1
[本文引用: 1]
Long-term monitoring of the ecological environment changes is helpful for the protection of the ecological environment. Based on the ecological environment of the Sahel region in Africa, we established a remote sensing ecological index (RSEI) model for this region by combining dryness, moisture, greenness, and desertification indicators. Using the Moderate-resolution Imaging Spectroradiometer (MODIS) data in Google Earth Engine (GEE) platform, this study analyzed the ecological environment quality of the Sahel region during the period of 2001-2020. We used liner regression and fluctuation analysis methods to study the trend and fluctuation of RSEI, and utilized the stepwise regression approach to analyze the contribution of each indicator to the RSEI. Further, the correlation analysis was used to analyze the correlation between RSEI and precipitation, and Hurst index was applied to evaluate the change trend of RSEI in the future. The results show that RSEI of the Sahel region exhibited spatial heterogeneity. Specifically, it exhibited a decrease in gradient from south to north of the Sahel region. Moreover, RSEI in parts of the Sahel region presented non-zonal features. Different land-cover types demonstrated different RSEI values and changing trends. We found that RSEI and precipitation were positively correlated, suggesting that precipitation is the controlling factor of RSEI. The areas where RSEI values presented an increasing trend were slightly less than the areas where RSEI values presented a decreasing trend. In the Sahel region, the areas with the ecological environment characterized by continuous deterioration and continuous improvement accounted for 44.02% and 28.29% of the total study area, respectively, and the areas in which the ecological environment was changing from improvement to deterioration and from deterioration to improvement accounted for 12.42% and 15.26% of the whole area, respectively. In the face of the current ecological environment and future change trends of RSEI in the Sahel region, the research results provide a reference for the construction of the ''Green Great Wall'' (GGW) ecological environment project in Africa.
基于RSEI的延河流域生态环境质量监测与预估
[J].
Monitoring and prediction of ecological environmental quality in the Yanhe River basin based on the remote sensing ecological index
[J].
Prediction of ecological effects of potential population and impervious surface increases using a remote sensing based ecological index (RSEI)
[J].
Instability of remote sensing ecological index and its optimisation for time frequency and scale
[J].
Ecological quality assessment and monitoring using a time-series remote sensing-based ecological index (ts-RSEI)
[J].
Time-frequency optimization of RSEI:A case study of Yangtze River basin
[J].
A spatio-temporal prediction model theory based on deep learning to evaluate the ecological changes of the largest reservoir in North China from 1985 to 2021
[J].
基于GEE的祁连山国家公园生态环境质量评价及成因分析
[J].
Eco-environmental quality assessment and cause analysis of Qilian Mountain National Park based on GEE
[J].
DOI:DOI: 10.13292/j.1000-4890.202106.034
[本文引用: 1]
The ecoenvironment is highly related to human life. Remote sensing technique can objectively and quantitatively evaluate the spatial and temporal variations of ecoenvironment quality and thus provide a scientific basis for regional eco-environment management. Based on the Google Earth Engine (GEE) platform, we adopted Landsat TM/OLI remote sensing images as the basic data source to calculate the remote sensing ecological index (RSEI) that reflects the ecoenvironment quality. Using RSEI, we evaluated the eco-environmental quality of Qilian Mountain National Park during 1989-2019 and analyzed the reasons. The results showed that RSEI performed well in assessing the eco-environment quality of Qilian Mountain National Park. Greenness and wetness were the two indices with positive effects on the eco-environment quality, while dryness and heat indices had adverse effects. The analysis of spatial and temporal variations in Qilian Mountain National Park showed that the eco-environment quality presented a trend of “slow decline rapid decline increase” during 1989-2019. Changes in eco-environment quality were stable from 1989 to 1999, mainly mildly deteriorated from 1999 to 2009, and mainly mildly improved from 2009 to 2019. The analysis of the causes of eco-environment quality showed that the effects of all the four indices were significant. The strength of natural factors in influencing ecoenvironment quality were in order of greenness > dryness > wetness > heat in 1989; heat > greenness > wetness > dryness in 1999; dryness > heat > wetness > greenness in 2009; and greenness > wetness > dryness > heat in 2019. Animal husbandry was an important factor affecting the eco-environment quality of Qilian Mountains National Park. Our results suggested that the GEEbased platform could be used as a computing platform to evaluate the eco-environment quality of Qilian Mountain National Park. This platform extends the application of RSEI in the evaluation of eco-environment quality at large scale and long time series. The eco-environmental quality of Qilian Mountain National Park has developed in the right direction in recent years, although comprehensive management work needs further improvement.
基于Google Earth Engine云计算的城市群生态质量长时序动态监测——以粤港澳大湾区为例
[J].
Dynamic monitoring of long time series of ecological quality in urban agglomerations using Google Earth Engine cloud computing:A case study of the Guangdong-Hong Kong-Macao Greater Bay Area,China
[J].
基于Google Earth Engine的长三角城市群生态环境变化与城市化特征分析
[J].
Analyzing the ecological environment and urbanization characteristics of the Yangtze River Delta Urban Agglomeration based on Google Earth Engine
[J].
基于Google Earth Engine云平台的成渝城市群生态环境质量时空变化
[J].
Temporal and spatial variations of ecological quality of Chengdu-Chongqing Urban Agglomeration based on Google Earth Engine cloud platform
[J].
DOI:DOI: 10.13292/j.1000-4890.202303.009
[本文引用: 1]
Rapid urbanization has a stressful effect on regional ecological environment. Timely monitoring of ecolo-gical quality changes is thus crucial for urban ecological management and planning. The remote sensing-based ecological index (RSEI) is an objective, quick, and easy tool for monitoring and evaluating ecological quality, which has been frequently used in ecological research. However, large-scale and long-term monitoring is frequently confronted with the problem of cloud blockage. Based on Google Earth Engine (GEE) cloud platform and its massive MODIS remote sensing images, we calculated remote sensing indices of greenness, humidity, dryness, and heat of Chengdu-Chongqing Urban Agglomeration (CCUA) annually by using the median synthesis method, and constructed the RSEI using the principal component analysis to evaluate the temporal and spatial variations of ecological quality in this area in the past 20 years. The results showed that: (1) The RSEI of the CCUA showed a slow upward trend and remained stable since 2012. The ecological quality in hilly area of central Sichuan and Chengdu Plain had been deteriorated dramatically, and were significantly improved in mountainous areas of the northeastern Chongqing; (2) The changes in the CCUA’s ecological quality showed clear spatial autocorrelation. The Moran’s <em>I</em> index was 0.825. Greenness and wetness indices were positively correlated with RSEI, while heat and dryness indices were negatively correlated with it, and the greenness was the primary driver for the changes in ecological quality of the CCUA. (3) Image processing based on GEE cloud computing may considerably enhance image processing efficiency, and address the problem of remote sensing data missing due to overcast and wet conditions. It also has the potential to broaden the scope of RSEI’s use in large-scale and long-term sequence ecological monitoring. Our findings can be used as a theoretical basis for environmental conservation and land management under the context of rapid urbanization.<br><div> <br></div>
Analysis of ecological quality in Lhasa Metropolitan Area during 1990—2017 based on remote sensing and Google Earth Engine platform
[J].
基于Google Earth Engine平台的三江源地区生态环境质量动态监测与分析
[J].
DOI:10.12082/dqxxkx.2019.190095
[本文引用: 1]
三江源是中国陆地生态系统最脆弱和敏感的区域之一,一旦遭到破坏则不可逆转。受三江源地区多云等不利气象条件的影响,很难获取大范围尺度上季相一致的、无云的Landsat遥感影像。本文利用Google Earth Engine平台,对1990-2015年的相同季节的3766景Landsat影像进行像元级融合并重构最小云量影像集,借助GEE的并行云端计算,快速得到了能够反映生态环境质量的遥感生态指数(RSEI),对三江源地区的生态环境质量进行了评价与监测。三江源时空变化与差异分析表明:1990-2000年生态环境质量呈快速下降状态,RSEI平均值从0.588下降到了0.505,生态环境质量变化以轻度恶化为主;2000-2015年生态环境质量下降速度变缓,并于2015年呈现变好态势,生态环境质量变化以不变为主,且轻度恶化面积大幅减少;该地区的生态环境状况呈现出空间分异,自西向东,生态状况变差。基于GEE平台在三江源地区的实验结果表明,GEE可以作为大区域范围的生态环境质量评价与监测的计算平台。
Monitoring and assessment of the eco-environment quality in the Sanjiangyuan Region based on google earth engine
[J].
Temporal and spatial changes of ecological environment quality based on RSEI:A case study in ulan Mulun River Basin,China
[J].
A study on the drivers of remote sensing ecological index of Aksu oasis from the perspective of spatial differentiation
[J].
基于Google Earth Engine的巢湖流域生态环境质量时空动态变化及影响因素分析
[J].
DOI:10.13474/j.cnki.11-2246.2023.0193
[本文引用: 1]
本文以巢湖流域为研究区,基于2000—2020年Landsat TM/OLI系列遥感数据,通过Google Earth Engine云计算平台构建遥感生态指数(RSEI),采用空间自相关与地理探测器等方法对巢湖流域生态环境质量进行大尺度、长时序动态监测分析与评价。结果表明:①研究区RSEI均值由2000年的0.70提升至2020年的0.74,整体上呈现改善趋势,研究区生态环境等级以优、良为主。②研究区全局Moran's I指数均大于0,巢湖流域生态环境质量在全局自相关上呈现聚类趋势,具有显著的空间正相关性,20年间“低-低”聚集区呈现先增加后减少趋势。③研究区生态环境受多因子影响,其中人为因素对2010年巢湖流域生态环境影响较大,进而导致生态环境质量下降。
Spatial and temporal dynamic change and influencing factors of ecological environment quality in Chaohu Lake Basin based on GEE
[J].
DOI:10.13474/j.cnki.11-2246.2023.0193
[本文引用: 1]
Taking Chaohu Lake basin as the research area, remote sensing ecological index (RSEI) is constructed through Google Earth Engine cloud computing platform, and large-scale and long-time dynamic monitoring analysis and evaluation of ecological environment quality in Chaohu Lake basin are carried out by means of spatial autocorrelation and geographic detectors based on Landsat TM/OLI series remote sensing data from 2000 to 2020. The results show that:①The average value of RSEI increased from 0.70 in 2000 to 0.74 in 2020, showing an overall improvement trend, and the ecological environment level is mainly excellent and good. ②The global Moran's I index of the study area is all greater than 0, and the ecological environment quality in Chaohu Lake basin presented a clustering trend on the global autocorrelation, with a significant spatial positive correlation. In the past 20 years, the low-low aggregation area had a trend of increasing firstly and then decreasing. ③The ecological environment is affected by many factors, among which human factors had a great impact on the ecological environment of Chaohu Lake basin in 2010, which leaded to the decline of ecological environment quality.
闽江流域生态环境质量动态变化及其驱动力
[J].
Dynamic change and driving factors of ecological environment quality in Minjiang River basin
[J].
基于AWRSEI的岱海流域生态环境质量时空演变及驱动因子分析
[J].
Spatial-temporal evolution and driving factors analysis of ecological environment quality in Daihai basin based on AWRSEI
[J].
