

0 引言
陆地生态环境中包含了陆表植被、内陆水体、土壤和大气等多种要素,生态红线划定、碳交易估值等都需要对以上要素进行同时相连续探测。针对不同要素,探测的物理量存在明显差异,卫星需要同时具备多种体制的载荷。2022年我国发射的首颗陆地生态系统碳监测卫星“句芒号”配备了多波束激光雷达、多角度多光谱相机、超光谱探测仪和多角度偏振成像仪,可通过监测株高、裕密度和光合作用效率服务全球森林碳汇核算[1]。同年,中国东方红卫星股份有限公司也提出多种成像体制载荷进行多要素探测的卫星设计,以实现对陆地生态环境中各种要素的综合监测。
对于光学遥感观测手段,植被冠层的色素含量、木质部含量、叶面积指数等常采用多/高光谱成像仪进行反演[2],株高和森林的裕密度常采用激光雷达反演[3]。二类水体的水质参量[4]和土壤成分[5]多利用高光谱成像仪反演。近年来生态领域对植被荧光辐射的应用研究证明,植被冠层日光诱导叶绿素荧光(solar-induced chlorophyll fluorescence,SIF)参量能够更及时和高精度地反映植被光合作用的速率,从而对生态环境变化进行更及时和精确的监测[6]。高光谱数据优秀的分类能力则能够有效实现植被类型的识别,应用于不同类型植被SIF辐射对环境胁迫响应的差异性研究[7]。同时,利用高光谱数据反演的光化学指数(photochemical reflectance index,PRI)[8]是分离SIF辐射的2个因素光化学猝灭(photochemical quenching,PQ)和非光化学猝灭(Non-Photochemical Quenching,NPQ)过程[8]的关键数据,对精确评价光合作用效率至关重要。由于SIF辐射的信号仅为冠层反射能量的百分之一,须采用超光谱分辨率光谱仪在大气吸收线或太阳夫琅禾费线内测量[6]。同时利用高光谱成像和超光谱探测系统进行探测在综合植被、水体、土壤和土地利用等多个要素、评价和监测陆表生态系统健康状况和碳汇能力等方面具有巨大的潜力。计划于2025年发射的FLEX卫星的主载荷FLORIS[8]就采用了该形式。在遥感载荷设计研制中,硬件和软件研制是2条同步开展的研究路线,甚至由于算法反演精度对载荷应用效能的决定作用使得软件研制中的相关算法研究要提前开始,并与载荷指标设计相互迭代。这就需要研究团队通过缩比系统的飞行试验或遥感成像仿真获取大量的基础数据。受限于飞行试验的成本和可操作性,其可获取的数据量通常有限,为此在Landsat8,HyspIRI[9],Enmap[10],GF-5[11]和FLEX[12-13]等卫星的载荷指标分析和算法研制中广泛使用了高光谱成像仿真的遥感数据。尽管在相关型号研制中,高光谱成像仿真系统逐渐成熟,但受限于载荷应用需求,仅FLEX的E2ES仿真系统被应用于植被荧光探测的仿真。根据Tenjo等[14]的研究,E2ES针对植被覆盖场景设计,植被光学特性采用SCOPE辐射传输模型建模,土壤采用BSM模型,水体可采用HydroLight模型,其他类型地表则直接采用类别的光谱曲线。这导致E2ES系统仅能满足植被生态参量反演和部分水体参量反演的研究需求。另外,对起伏地形的影响仅考虑了单一像元双向反射分布函数(bidirectional reflectance distribution function,BRDF)辐射效应、SIF与地形的耦合[14],而根据Mousivand等[15]的研究,周围地物散射作用对地表BRDF反演具有显著影响。荧光超光谱数据空间分辨率普遍较低,目前可用于荧光探测的载荷中,空间分辨率最高的是“句芒号”卫星超光谱探测仪,其空间分辨率为1.2 km[1],低空间分辨率条件下地形邻近效应影响较小[8]。而未来载荷的空间分辨率将进一步提高,FLEX-FLORIS的空间分辨率将提升到300 m,本文将面向中高空间分辨率荧光探测与高分辨率高光谱探测相结合的一体化成像光谱仪开展成像建模。随着空间分辨率进一步提高,地形邻近效应的影响会逐渐凸显,为此,本文将引入地形邻近效应影响,并集成多种地物光学特性建模方法构建异构场景数据集,研制面向多种应用的起伏异质地表一体化成像光谱仪全链路仿真模型。
1 仿真系统设计
1.1 系统总体结构
图1

图1
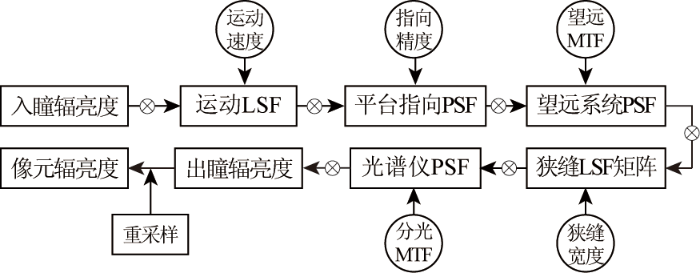
紧凑型一体化生态监测光谱仪全链路仿真系统
Fig.1
Simulation system of compact economical hyperspectral imager
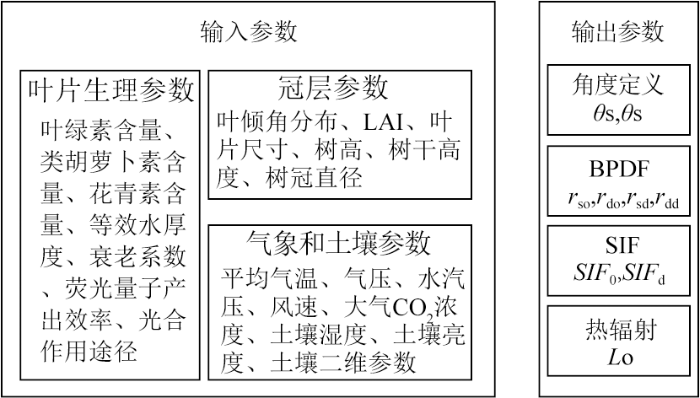
场景仿真中需考虑大面积复合类型场景的快速建模需求及针对植被和土壤定量化反演应用的目标光谱混合和光谱各向异性建模的需求。为此,场景仿真集成了灰度匹配模型、光谱混合模型及辐射传输模型。与之相对应,场景仿真参数中包括场景的分类图、灰度匹配模型和光谱混合模型所需的场景纹理图和目标光谱库,地物辐射传输模型对应的植被参数、矿物参数和大气参数。除此之外,由于大气辐射传输过程中需要考虑地表起伏作用,因此地面场景仿真参数还包含了数字高程模型(digital elevation model,DEM)。大气辐射传输仿真采用四流近似模型,输入参数包括大气上行、下行辐射参量及地表坐标系下的太阳方位、观测方位及云层投影像元。大气辐射传输仿真得到入瞳辐亮度后,利用光谱成像模型进行一体化成像光谱仪数据的仿真计算。其中分别针对平台运动、光谱仪光谱成像和探测器光电效应等分别进行建模。最终得到系统的探测器视频电路读取的DN值。
1.2 场景仿真模型
针对一体化成像光谱仪空间分辨率高、光谱分辨率高、幅宽较大等成像特点和陆表生态系统定量化反演需同时兼顾多种目标的应用特点,开展场景仿真建模。目前常用的高光谱全链路成像仿真系统中,对地表场景的建模方式包括对几何模型或分类图直接赋光谱[16-17],根据多谱段的灰度关系对光谱特征进行建模[17-18],根据对地表光谱特性进行线性混合模型建模[19],以及直接对地表BRDF模型进行辐射传输建模[13]。其中,对几何模型赋光谱的方式适用于点目标,对于大范围场景效率过低,而直接利用对分类图赋光谱忽略了同类地物由于不同照明关系和组分差异造成的光谱变异,场景失真较严重。线性混合模型适用于大范围复杂目标的快速建模,因此目前使用广泛,但这种方式由于仅考虑物质的线性混合组分占比,缺乏对矿物孔隙度、土壤含水量和植被生理参量等的考虑,难以覆盖本载荷的全部应用实验[19]。基于BRDF模型能够根据典型地物的理化参数、结构参数或组分进行精确的光谱特性仿真,目前植被辐射传输建模主要采用的模型包括SCOPE[20],DART[21],FluorWPS[22]和SIFT[23]等,岩矿主要采用Hapke模型[24]。考虑到逐像元计算BRDF的效率低,难以满足星载高光谱遥感成像仿真的需求,E2ES在植被仿真中采用了基于水平均匀冠层假设的SCOPE模型,并设计植被覆盖区的叶面积指数(leaf area index,LAI)服从均一、径向、正态分布等分布[13]。采用辐射传输模型建模一方面难以模拟组分复杂的目标; 另一方面建模过程中通常难以获取足够的输入参数。为此,针对一体化成像光谱仪的植被生态监测能力验证,本文采用如下线性混合模型对裸土、水体、人工地物等进行快速大范围建模。对于矿物光谱,基于朗伯体假设将矿物反射率光谱取倒数后,进行线性混合后再取倒数作为混合光谱[25]。建模过程中以典型地物的光谱作为端元光谱,利用式(1)对多光谱纹理图进行最小二乘法解混,对应类别地物每个像元的丰度。其表达式为:
图2
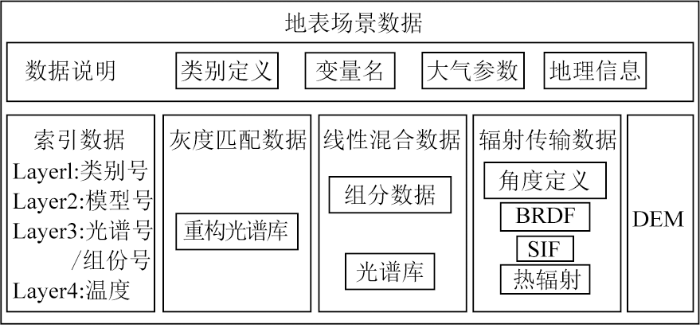
针对上述模型,仿真场景需要同时存储场景的BRDF,SIF和热辐射的方向特性,随场景空间分辨率、光谱分辨率的迅速提升,难以确保足够的存储空间进行逐像元光谱信息存储。为此场景仿真模型不输出地表逐像元的光学特性,而改为输出图3所示的异构数据集,以压缩场景数据尺寸,便于大气辐射传输。以本文第2节模拟场景为例,2.5 m空间分辨率、21 km幅宽的场景,若直接存储BRDF光谱数据量大于57 TB。采用异构数据集的方式存储场景文件尺寸小于2.5 GB。
图3
1.3 大气辐射传输模型
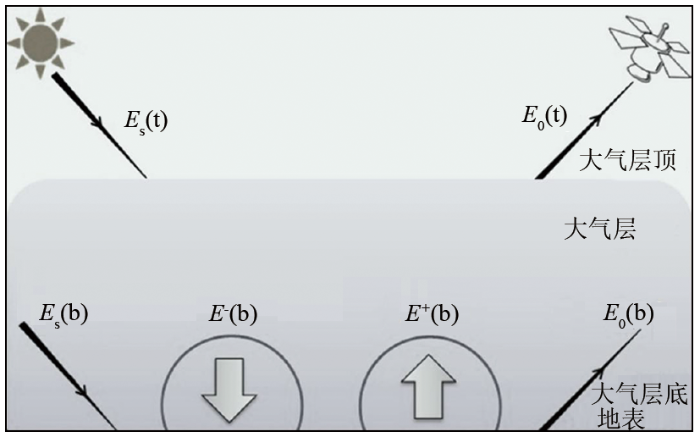
大气辐射传输模型是全链路仿真的核心环节,由于一体化成像光谱仪定量化反演中受地形影响较大,其主要观测目标,植被冠层的BRDF特性明显,在大气辐射传输建模过程中必须考虑场景BRDF、荧光的方向发射辐亮度及起伏地表对辐射传输的综合影响。本文在Mousivand等[15]的起伏地表辐射传输模型的基础上引入了冠层SIF散射、SIF方向发射辐亮度和地表发射辐亮度,于是大气层顶和大气层底部的上行和下行辐射照度可表示为:
式中: t和b分别为大气层顶和大气层底; +和-分别表示上行和下行; τss,τsd,τdo和τoo分别为太阳直射方向大气透过率、太阳直射的大气散射透过率、散射照明的大气观测方向透过率、观测方向大气透过率; ρdd和ρso分别为大气双向半球反射率因子、大气二向反射率因子; La为大气黑体辐射亮度; rso,rsd,rdo和rdd分别为地表二向反射率因子、地表方向半球反射率因子、地表半球方向反射率因子和地表双向半球反射率因子; SIFs和SIFd分别为地表观测方向SIF辐射亮度和地表半球SIF辐射出射度; Ls地表场景的黑体热辐射亮度; Es,Eo,Eterr,E+(b)和E-(b)分别为太阳直射辐照度、观测方向辐照度、背景辐照度和大气层底的上、下行辐照度,如图4所示[25]。Fsun和Fsky分别为太阳可见系数和天空光可见系数,计算方法详见文献[15]。为简化计算,对邻近地物散射用半球反射率因子的均值
图4
严格的背景辐射计算需要追迹观测像元与邻近像元的多次散射。根据Proy,背景辐射照度可表示为目标像元M周围N个背景像元P辐亮度的积分,表达式为:
式中: LP→M(b)为像元P对像元M的辐亮度; R为2个像元间距; θP和θM分别为P和M这2点连线分别对于像元P和像元M的天顶角; SP和SM分别为像元P和像元M的面积,由于LP→M(b)中包含式(2)第2行的全部分量,会导致计算中出现大量的迭代,难以满足大范围场景计算的要求。实际应用中将背景辐射照度近似为目标光学特性的加权平均与地形可视因子的乘积,权重为1/
图5
根据上述模型,一体化成像光谱仪辐射传输建模首先根据DEM计算坡面坐标系下的太阳天顶角、方位角、观测天顶角、方位角、Fsun,Vsky,Vterr和1/
1.4 光谱成像模型
图6
辐射特性建模计算公式为:
式中: ns为探测器像元产生的光电子数; L(λ)为像元辐亮度; ηq(λ)为探测器光谱量子效率; F为系统F数; Ad为像元面积; tint为积分时间; τo(λ)为光学系统总透过率,即由每个光学件入射角θi的反射率ρ和透过率τ及光栅衍射效率ηd(λ)计算得到; h,c分别为普朗克常数和光速。
分别计算探测器光子噪声
式中: ns为暗电流电子数;rnd为噪声随机数。最后,根据文献[26]计算输出DN值,其表达式为:
式中: b为量化位数; Rc为电荷转换系数; Vref为参考电压,取典型值3V。
2 一体化成像光谱仪建模结果
本文的一体化成像光谱仪同时具备高分辨率高光谱探测通道和中高分辨率超光谱探测通道。根据Jacobs等[27]和Tao等[28]的研究,要实现真实度超过0.95的成像仿真,需要场景数据的空间/光谱分辨率分别达到光谱仪的3倍。相应需要空间分辨率达到3 m的高空间分辨率地表纹理和分类图。但由于1.2节中采用的基于线性混合模型的地表场景仿真建模,其模拟精度与谱段的跨度和数量有关,权衡地表采样间隔的影响和光谱混合精度的影响,本文采用基于10 m空间分辨率的哨兵2A影像的地面分类数据和多光谱地面纹理作为场景的输入数据。其中地面场景的分类数据为ESA WorldCover2020地表分类数据集[29]。考虑模拟场景的地形变化缓慢,采用ASTER GDEM地形数据。为满足光谱成像仿真建模对空间-光谱维退化和重采样计算的要求,对纹理数据、地物分布和DEM数据进行重采样,空间采样间隔为2.5 m。输入场景数据如图7所示。输入表1所示参数,利用MODTRAN6.0计算大气参量[30],利用1.3节的模型完成大气辐射传输建模,得到空间分辨率2.5 m、光谱分辨率0.1 nm的入瞳辐亮度。
图7
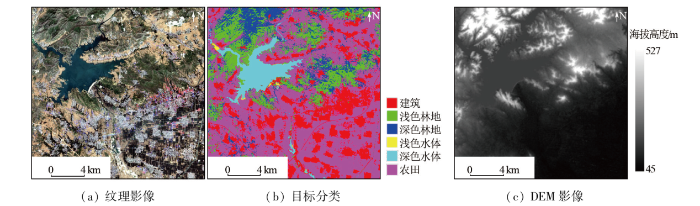
表1 大气辐射传输建模参数
Tab.1
| 大气参数 | 取值 |
|---|---|
| 大气类型 | 中纬度夏季 |
| 气溶胶模型 | Rural |
| CO2浓度/ ppmv | 390 |
| 太阳天顶角/(°) | 45 |
| 太阳方位角/(°) | 180 |
| 成像天顶角/(°) | 0 |
| 成像方位角/(°) | 0 |
| 海拔高度/ km | 0.4 |
| 轨道高度/ km | 550 |
| 光谱分辨率/ cm-1 | 1 |
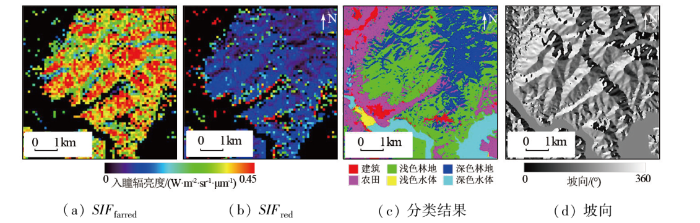
根据探测器选型和光学系统设计利用1.4节所述的光谱成像模型对2通道成像数据进行仿真得到DN值数据。根据DN值数据和大气辐射传输的入瞳辐亮度建立辐射定标方程,将仿真DN值数据反演为入瞳辐亮度,如图8和图9所示。对比图7(a)和图8(a)数据色彩一致,山区植被深浅由植被辐射传输模型中叶绿素含量、LAI和地形共同导致。对比山区的细节纹理与对应的DEM(图10所示),向阳面和背阴面辐亮度存在明显差异。提取图10(a)中山谷裸地光谱,从山脚向山谷延伸1-7个像元(图中红-紫色点),输入的光谱反射率如图10(c)所示,对应入瞳辐亮度光谱如图10(d)所示,坡底像元中越靠近坡面位置的像元植被光谱特征越明显,大气辐射传输仿真反映了地形邻近效应。
图8
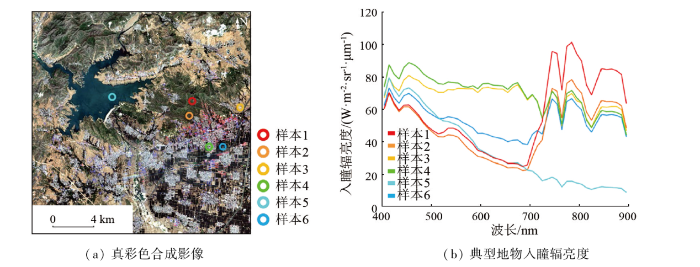
图9
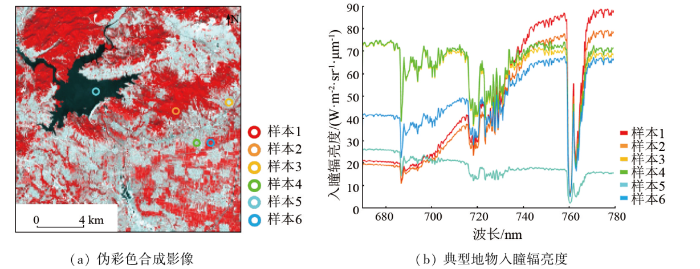
图10

图11

图12
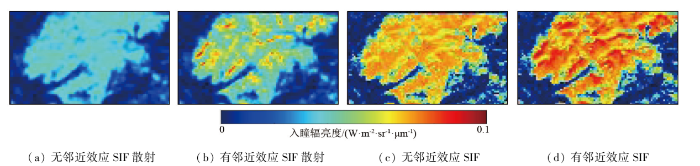
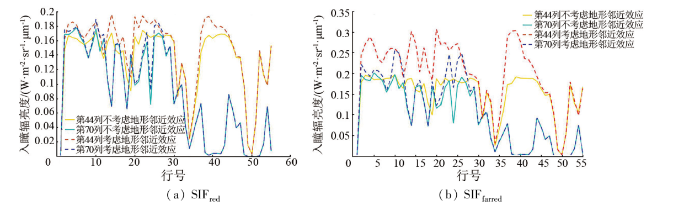
为定量化分析地形邻近效应对SIF建模精度的影响,根据山体走向选择第44列和第70列2条纵向剖面,对比有无地形邻近效应条件下,SIF沿行方向的分布。SIFred和SIFfarred行方向分布分别如图13所示。SIFred第44列建筑用地南北两侧的山区和第70列中北侧山区被明显低估,第44列被低估了最大超过17.5%,第70列被低估了最大超过22%; SIFfarred第44列被低估了最大超过46%,第70列被低估了最大超过52%。
图13
3 仿真数据应用演示
一体化成像光谱仪的数据同时采集高光谱数据和荧光超光谱数据。为初步验证光谱仪在轨成像的应用效能,对光谱仪数据进行双通道联合应用处理。具体来说对于高光谱数据进行辐射校正、大气校正、光谱分类和植被光谱指数提取等处理,荧光超光谱数据进行辐射校正、大气参数提取和荧光参量提取。最后验证荧光参量提取精度。为不失一般性,大气校正采用基于平坦地表假设辐射传输模型的FLAASH大气校正算法[31]。光谱分类采用匹配滤波(matched filter,MF)算法[32]和光谱信息散度(spectral information divergence,SID)算法[33]结合,以二维阈值分类,结果如图14(a)所示。根据分类结果,对植被覆盖区计算光谱植被指数,选择应用最广泛的归一化光谱指数(normalized difference vegetation index,NDVI)[2]和与荧光指数配合评价光合作用效率的PRI[10]作为一体化光谱仪生产的数值产品,反演结果如图14(b)—(c)所示,对比山区NDVI分布和PRI分布,PRI对地形更敏感,与实际情况一致。
图14
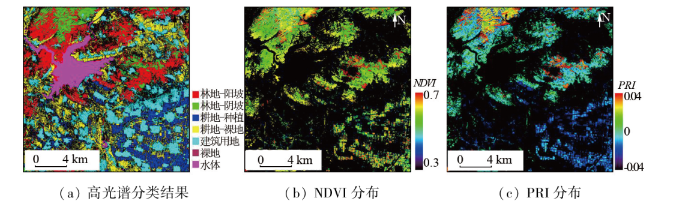
图15
4 结论
生态环境监测和碳通量评估中,需要采用同时相、不同类型的数据进行综合评价,这对卫星载荷的数据获取能力提出了挑战。采用高光谱+荧光超光谱的一体化成像光谱仪能够有效解决这一问题,实现多维度生态数据获取。在载荷设计和处理算法研究中,需要仿真大量的在轨数据。目前的全链路仿真模型不能满足数据生产要求,一方面表现在场景仿真模式单一,未考虑土壤分类、组分反演、土地利用识别等应用的数据要求; 另一方面表现在目前的辐射传输模型没有考虑荧光信号在起伏异质场景中受到的地形邻近效应影响。为此,本文提出了一种集成异构地物光谱模型与一种包含地物SIF辐射和热辐射的起伏地表辐射传输模型,光谱仪成像仿真模型相结合的起伏异质地表的一体化成像光谱仪成像模型。通过对起伏地形场景的模拟,未考虑地形邻近效应的建模方式,其SIFred被低估了超过22%,SIFfarred被低估了超过52%,采用本文所述方式能够有效提升SIF卫星数据建模的精度。在此基础上,应用本文的模型对一体化成像光谱仪数据进行了仿真,证明本模型能够模拟在轨数据生产包括地表覆盖类型产品、NDVI指数、PRI指数和SIFred和SIFfarred产品在内的多种数值产品,有效服务于载荷性能论证、设计及算法研究。
参考文献
陆地生态系统碳监测卫星日光诱导叶绿素荧光超光谱探测仪设计与验证
[J].
The solar-induced chlorophyll fluorescence imaging spectrometer (SIFIS) onboard the terrestrial ecosystem carbon inventory satellite:Design and verification
[J].
Optical vegetation indices for monitoring terrestrial ecosystems globally
[J].
Remote sensing of vegetation 3-D structure for biodiversity and habitat:Review and implications for LiDAR and Radar spaceborne missions
[J].
Monitoring inland water quality using remote sensing:Potential and limitations of spectral indices,bio-optical simulations,machine learning,and cloud computing
[J].
Current and emerging methodologies for estimating carbon sequestration in agricultural soils:A review
[J].
DOI:10.1016/j.scitotenv.2019.02.125
[本文引用: 1]

This review covers the current and emerging analytical methods used in laboratory, field, landscape and regional contexts for measuring soil organic carbon (SOC) sequestration in agricultural soil. Soil depth plays an important role in estimating SOC sequestration. Selecting appropriate sampling design, depth of soil, use of proper analytical methods and base line selection are prerequisites for estimating accurately the soil carbon stocks. Traditional methods of wet digestion and dry combustion (DC) are extensively used for routine laboratory analysis; the latter is considered to be the "gold standard" and superior to the former for routine laboratory analysis. Recent spectroscopic techniques can measure SOC stocks in laboratory and in-situ even up to a deeper depth. Aerial spectroscopy using multispectral and/or hyperspectral sensors located on aircraft, unmanned aerial vehicles (UAVs) or satellite platforms can measure surface soil organic carbon. Although these techniques' current precision is low, the next generation hyperspectral sensor with improved signal noise ratio will further improve the accuracy of prediction. At the ecosystem level, carbon balance can be estimated directly using the eddy-covariance approach and indirectly by employing agricultural life cycle analysis (LCA). These methods have tremendous potential for estimating SOC. Irrespective of old or new approaches, depending on the resources and research needed, they occupy a unique place in soil carbon and climate research. This paper highlights the overview, potential limitations of various scale-dependent techniques for measuring SOC sequestration in agricultural soil. (c) 2019 Elsevier B.V.
Sun-induced Chl fluorescence and its importance for biophysical modeling of photosynthesis based on light reactions
[J].
DOI:10.1111/nph.15796
PMID:30883811
[本文引用: 2]
Recent progress in observing sun-induced Chl fluorescence (SIF) provides an unprecedented opportunity to advance photosynthesis research in natural environments. However, we still lack an analytical framework to guide SIF studies and integration with the well-developed active fluorescence approaches. Here, we derive a set of coupled fundamental equations to describe the dynamics of SIF and its relationship with C and C photosynthesis. These equations show that, although SIF is dynamically as complex as photosynthesis, the measured SIF simplifies photosynthetic modeling from the perspective of light reactions by integrating over the dynamic complexities of photosynthesis. Specifically, the measured SIF contains direct information about the actual electron transport from photosystem II to photosystem I, giving a quantifiable link between light and dark reactions. With much-reduced requirements on inputs and parameters, the light-reactions-centric, SIF-based biophysical model complements the traditional, dark-reactions-centric biochemical model of photosynthesis. The SIF-photosynthesis relationship, however, is nonlinear. This is because photosynthesis saturates at high light whereas SIF has a stronger tendency to keep increasing, as fluorescence quantum yield has a relatively muted sensitivity to light levels. Successful applications of the SIF-based model of photosynthesis will depend on a predictive understanding of several previously underexplored physiological and biophysical processes. Advances can be facilitated by coordinated efforts in plant physiology, remote sensing, and eddy covariance flux observations.© 2019 The Authors. New Phytologist © 2019 New Phytologist Trust.
Response of canopy solar-induced chlorophyll fluorescence to the absorbed photosynthetically active radiation absorbed by chlorophyll
[J].
Instrument predevelopment activities for FLEX mission
[J].
Comparison of simulated hyperspectral HyspIRI and multispectral Landsat8 and Sentinel-2 imagery for multi-seasonal,regional land-cover mapping
[J].
EeteS—The EnMAP end-to-end simulation tool
[J].
Emissivity image simulation for thermal infrared bands on Gaofen-5 using airborne hyperspectral data
[C]//
Application to ESA’s FLEX/sentinel-3 tandem mission
[C]//
FLEX end-to-end mission performance simulator
[J].
Design of a generic 3-D scene generator for passive optical missions and its implementation for the ESA’s FLEX/Sentinel-3 tandem mission
[J].
Modeling top of atmosphere radiance over heterogeneous non-lambertian rugged terrain
[J].
The coupling of MATISSE and the SE-WORKBENCH:A new solution for simulating efficiently the atmospheric radiative transfer and the sea surface radiation
[C]//
SENSOR:A tool for the simulation of hyperspectral remote sensing systems
[J].
DIRSIG5:Next-generation remote sensing data and image simulation framework
[J].
A review of nonlinear hyperspectral unmixing methods
[J].
SCOPE 2.0:A model to simulate vegetated land surface fluxes and satellite signals
[J].
DART:Recent advances in remote sensing data modeling with atmosphere,polarization,and chlorophyll fluorescence
[J].
FluorWPS:A Monte Carlo ray-tracing model to compute sun-induced chlorophyll fluorescence of three-dimensional canopy
[J].
SIFT:Modeling solar-induced chlorophyll fluorescence over sloping terrain
[J].
Bidirectional reflectance spectroscopy:1.Theory
[J].
Simulation of hyperspectral and directional radiance images using coupled biophysical and atmospheric radiative transfer models
[J].
A digital sensor simulator of the pushbroom Offner hyperspectral imaging spectrometer
[J].
DOI:10.3390/s141223822
PMID:25615727
[本文引用: 3]
Sensor simulators can be used in forecasting the imaging quality of a new hyperspectral imaging spectrometer, and generating simulated data for the development and validation of the data processing algorithms. This paper presents a novel digital sensor simulator for the pushbroom Offner hyperspectral imaging spectrometer, which is widely used in the hyperspectral remote sensing. Based on the imaging process, the sensor simulator consists of a spatial response module, a spectral response module, and a radiometric response module. In order to enhance the simulation accuracy, spatial interpolation-resampling, which is implemented before the spatial degradation, is developed to compromise the direction error and the extra aliasing effect. Instead of using the spectral response function (SRF), the dispersive imaging characteristics of the Offner convex grating optical system is accurately modeled by its configuration parameters. The non-uniformity characteristics, such as keystone and smile effects, are simulated in the corresponding modules. In this work, the spatial, spectral and radiometric calibration processes are simulated to provide the parameters of modulation transfer function (MTF), SRF and radiometric calibration parameters of the sensor simulator. Some uncertainty factors (the stability, band width of the monochromator for the spectral calibration, and the integrating sphere uncertainty for the radiometric calibration) are considered in the simulation of the calibration process. With the calibration parameters, several experiments were designed to validate the spatial, spectral and radiometric response of the sensor simulator, respectively. The experiment results indicate that the sensor simulator is valid.
Sampling criteria for sensor simulation
[J].
Analyzing the effect of synthetic scene resolution,sampling interval,and signal-to-noise ratio on hyperspectral imaging sensor simulations
[J].
A major upgrade of the MODTRAN® radiative transfer code
[C]//
Analysis of Hyperion data with the FLAASH atmospheric correction algorithm
[C]//
Hyperspectral matched filter with false-alarm mitigation
[J].
New hyperspectral discrimination measure for spectral similarity
[J].
The solar-induced chlorophyll fluorescence imaging spectrometer (SIFIS) onboard the first terrestrial ecosystem carbon inventory satellite (TECIS-1):Specifications and prospects
[J].
