

0 引言
海洋与大气的互相影响,调节着地球水资源循环与能量流动,对人类活动及生态平衡具有重要作用,在全球生态可持续发展中具有重要的地位[1]。海洋热状况的重要指标之一是海洋表面温度(sea surface temperature,SST),其不仅可以反映出海表的动力、热力情况[2⇓-4],对于黑潮、台风、降水、海洋温度锋和渔业等相关研究[5⇓⇓⇓-9]也具有重要的意义。其中,SST的时空变化研究能直观展示SST在大尺度时间、空间上的变化情况,对研究气候变化、预测未来SST走势等方面起到极大的帮助。众多专家学者围绕SST时空变化开展了不少的相关研究[10⇓-12],龙上敏等[13]回顾大量南大洋表层到深层SST长期观测结果与模式模拟结果,对SST影响因素、调整机制做出了介绍,提出使用时间尺度响应的方法研究南大洋SST较优的结论; 李扬等[14]利用标准化的经验正交函数的无参趋势估计方法,结合多套海表、次表层SST资料,分析了赤道太平洋次表层SST、热带太平洋表层SST的变化情况。
SST的时空变化与内陆降水及沿海海雾的发生亦具有关联。有研究表明,SST变化对气候具有重要影响[15-16],由于海陆热力差异产生的海气相互作用能对大气环流产生明显的影响[17-18],使得降水与SST的时空变化存在着密切的关系[19-20],外力·吾甫尔等[21]研究了华南无降水日与SST之间的关系,发现秋季的无降水日与SST有明显的线性相关; Hoerling等[22]经过研究1979—2003年美国南北部日极端降水变化趋势,发现其与SST的变化有明显的关联。而海雾的形成与SST也有密切关联[23⇓-25],战淑芸等[26]发现南海海雾异常变化与大范围SST及环流背景异常有关; 张伟等[27]通过分析闽南沿海的某次春季海雾过程,发现SST、气温和风速是影响海雾发生的主要因素。
随着遥感技术的不断发展,自20世纪就已经开始的卫星遥感SST相关研究早已成为主流的方法之一[28-29]。AVHRR和MODIS等传感器获取的遥感数据是反演SST中常用的数据源[30⇓⇓⇓-34],近年来我国的风云系列和国外的Landsat8等卫星也常用于SST研究[35⇓⇓-38],同时卫星数据也大量用于SST的时空变化研究[39⇓⇓-42]。Himawari-8是2014年日本发射的新一代静止卫星,具有高时空分辨率、多波段探测通道、数据量化比特精度高的特点[43],已经在SST研究中得到相关应用[44]。Himawari-8的多项优势使得在旬尺度研究SST时空变化成为了可能,旬尺度数据较月尺度数据提升了近3倍的时间分辨率,十分适用于研究台湾海峡这类具有复杂海洋动力机制的海域。
目前,基于Himawari-8数据对台湾海峡旬SST变化的研究尚少,更鲜有将其应用于分析与内陆降水、沿海海雾之间的关系,故本文选取台湾海峡及其周边海域为主要研究区,以Himawari-8的年、季节、旬SST合成数据开展研究区2016—2020年近5 a的SST时空变化研究,并以此为基础,探究台湾海峡典型区域SST时空变化与福建省各地市降水量及福建省沿岸海雾之间的关系。
1 研究区概况及数据源
1.1 研究区概况
研究区为我国台湾海峡及其周边海域,地理位置为E115.5°~125.5°,N19.5°~28.5°。以国家地理信息公共服务平台——天地图(
表1 研究区13个区域代表点的地理位置及代表区域
Tab.1
| 点位 | 经度E/(°) | 纬度N/(°) | 代表区域 |
|---|---|---|---|
| 1 | 120.298 03 | 25.118 80 | 台湾海峡北部中心 |
| 2 | 119.950 80 | 25.521 64 | 台湾海峡北部福建沿海 |
| 3 | 121.019 79 | 25.164 87 | 台湾海峡北部台湾沿海 |
| 4 | 119.637 70 | 24.350 97 | 台湾海峡中部中心 |
| 5 | 118.962 02 | 24.750 24 | 台湾海峡中部福建沿海 |
| 6 | 120.221 25 | 24.043 84 | 台湾海峡中部台湾沿海 |
| 7 | 118.915 95 | 23.414 23 | 台湾海峡南部中心及澎湖列岛 |
| 8 | 118.102 05 | 24.074 56 | 台湾海峡南部福建沿海 |
| 9 | 120.098 40 | 22.769 25 | 台湾海峡南部台湾沿海 |
| 10 | 121.987 25 | 27.038 36 | 台湾海峡北部福建宁德沿海 |
| 11 | 123.998 95 | 26.193 76 | 台湾海峡北部周边海域 |
| 12 | 117.472 43 | 21.556 09 | 台湾海峡南部周边海域 |
| 13 | 123.599 68 | 22.538 90 | 台湾岛东面海域(外海) |
1.2 数据源
本研究采用日本宇宙航空研究开发机构(Japan Aerospace Exploration Agency,JAXA)发布的2016—2020年Himawari-8卫星L3级SST产品作为基础数据源,L3 SST产品为时间分辨率为1 h的SST平均值。与基于极轨卫星的SST劈窗反演算法不同,L3 SST产品采用准物理算法,利用CH11(8.6 μm),CH13(10.4 μm)和CH14(11.2 μm)3个红外观测数据求解参数化的红外辐射传输方程,从而以较高精度反演得到SST[47]。
2 研究方法
首先对Himawari-8卫星L3级SST产品的地理范围(85°E~155°W,60°N~60°S)进行切割,得到研究区的地理范围。由于台湾海峡地处亚热带海洋上,被云覆盖几率相对比较大,为了保证生成各种SST平均产品的精度,在合成之前对逐时SST遥感反演数值进行包括剔除异常数据、在一定时空范围内根据SST均方差进行一致性检验等质量控制,以进一步提高产品的可信度。为了得到SST的日平均、旬平均、月平均、季节平均和年平均等相关产品,本研究在L3级SST产品的基础上进行进一步处理,通过公式逐时次合成不同时间尺度的SST数据集,并通过ENVI遥感处理软件采用Bicubic最优插值方法重新采样投影为空间分辨率为1 km的SST产品。计算公式为:
式中:
3 台湾海峡及其周边海域SST时空变化特征分析
3.1 年平均SST空间分布特征
2016—2020年研究区年平均SST分布及13个区域代表点的年平均SST值如图1和图2所示。由图1和图2可知,研究区年平均SST沿海岸线由西北向东南呈带状分布且逐渐升高,最低值在海峡北部福建沿海一带,其中福建宁德沿海年平均SST仅有10.87 ℃,高值区位于海峡南部低纬度区域与台湾岛东面区域,以台湾岛—澎湖列岛为界,整体SST明显较高,最高值出现在台湾岛东南向的太平洋海区,典型区域SST年平均值为24.35 ℃。同时,海峡两岸SST差距明显,福建沿海年均SST均低于台湾沿海,平均温差为5.94 ℃,其中海峡北部两岸温差为3.96 ℃,中部海域两岸温差为4.51 ℃,而海峡南部温差达到了9.35 ℃。
图1
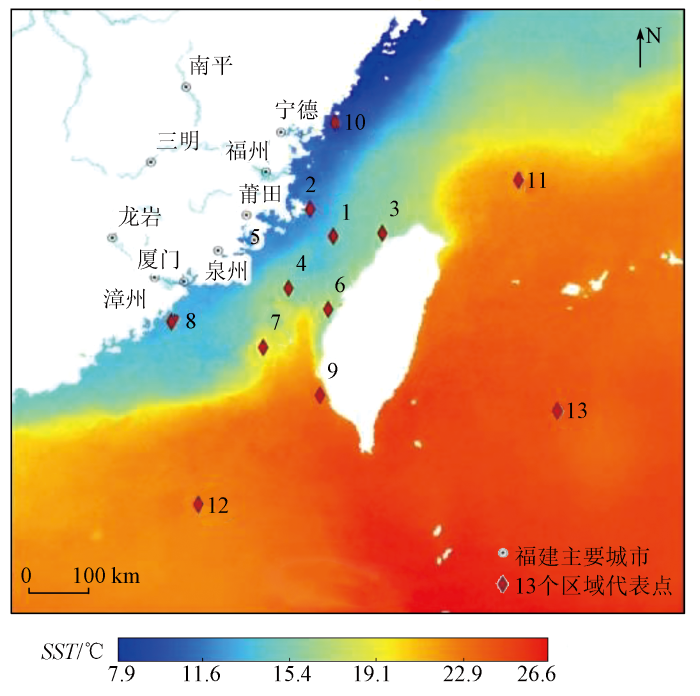
图1
2016—2020年研究区年平均SST分布及13个区域代表点位置
Fig.1
Distribution of annual mean SST from 2016 to 2020 in study area and locations of 13 regional representative point
图2
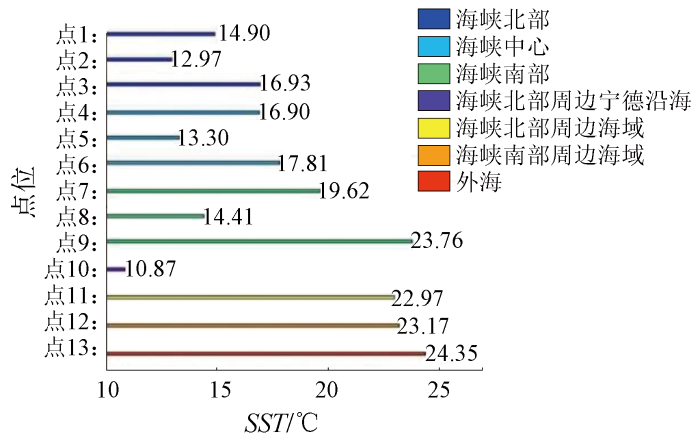
图2
2016—2020年研究区不同点位的年平均SST值
Fig.2
Annual mean SST at different points location from 2016 to 2020 in study area
一般而言,SST受太阳辐射的影响,将呈现出由低纬至高纬逐渐递减的分布态势,但是由于洋流、海区孤立程度、海岸带形态的差异、以及海洋动力因子、气象因子等因素的影响,局部地区的等温线会出现较大幅度的变动[48],这也是台湾海峡及其周边海域的SST空间分布相对复杂的原因。台湾海峡主要为黑潮与闽浙沿岸流所控制,并受到季风影响。温度低的闽浙沿岸流在冬季随季风自北而下,使得福建省沿海SST较低,在研究区以福建宁德沿海表现特别明显。黑潮对台湾海峡的影响分2支,黑潮主流流经台湾东岸,SST温度梯度方向与黑潮的流动方向一致; 黑潮支流沿台湾西南流向澎湖列岛,使得等温线向北突起。许多研究表明[49⇓⇓-52],中纬度大气环流主导着没有受明显冷暖洋流影响的海域,这种主导作用是通过改变海气之间的热通量交换来实现的。通过对北半球500 hPa平均高度场分布特征的分析得知,东亚地区冬季高度场呈北低南高,即北部的阿留申低压和南部强度较小的副热带高压; 夏季中低纬海洋上空高度场升幅明显并且范围扩大,其中以北太平洋副热带高压增强最为显著[53]。冬夏季大气总体热分布特征表明,副热带高压的维持,其伴随的下沉绝热增温作用间接加热洋面[54],并且副高的平均位置与洋面高温范围相对应。综合上述以及海陆热力性质差异、海陆平均温度差异及海峡地形特征,研究区年平均SST呈现图1的分布特点。
3.2 SST的季节变化特征
图3
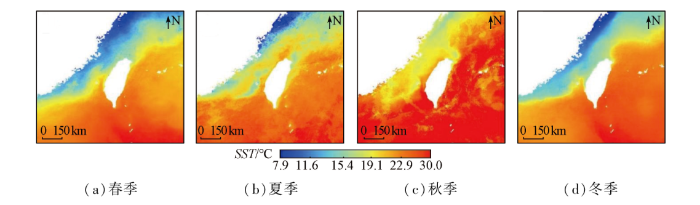
图3
台湾海峡及其周边海域SST季节变化空间分布
Fig.3
Spatial distribution of SST seasonal variation of Taiwan Strait and its surrounding water
图4
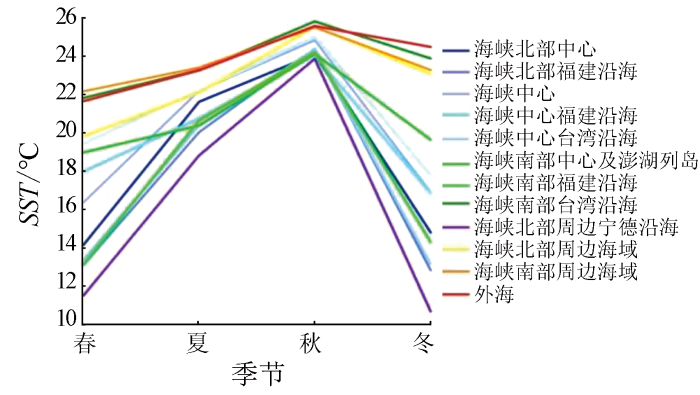
图4
台湾海峡及其周边海域典型区域平均SST季节变化
Fig.4
Seasonal variation of mean SST in typical regions of Taiwan Strait and its surrounding water
冬春2季台湾海峡及其周边海域SST等温线分布呈东北—西南走向,温度由内陆沿海至外海自西北向东南逐渐升高。春季SST在11~22 ℃之间,冬季SST在10~24 ℃之间,高值区集中在海峡南部周边海域及外海区域,低值区位于福建沿海及浙江沿海一带。冬季沿岸区域受到闽浙沿岸流的影响呈现出较低的温度,而外海区域由于受到黑潮影响,SST等温线几乎平行岸界。而春季随着上层海水的逐渐升温及偏北风的减弱,冬季型温度逐渐开始向夏季型过渡。夏季不同海面区域呈现出不同温度,高值集中在研究区南部,为23 ℃左右,低值区域为福建宁德、浙江沿海一带。总体上SST高于20 ℃,仅福建宁德沿海及浙江沿海SST较低,为18 ℃左右。夏季太阳辐射增强,研究区海域SST升高,温差缩小,SST的分布已经无法明显反应黑潮的影响,而福建北部及浙江南部沿海出现的低温带可能与东海沿岸的上升流有关。秋季台湾海峡周边海域SST达到了25 ℃以上,台湾海峡及内陆沿海区域也达到了23℃以上。9月福建省仍受副热带高压影响,气温、SST均维持较高水平。10—11月副高南撤东退,福建省及海峡地区逐渐受冷涡东移渗透南下的冷空气影响,陆面、海表气温开始降低,受海气耦合作用,SST滞后降低,逐渐由夏季型转为冬季型。
3.3 SST的旬变化特征
通常较广泛使用的月均SST数据虽可以反映出SST的变化情况,但旬数据提高了时间分辨率,能更细致地表现出SST的时空变化情况。图5和图6给出了台湾海峡及其周边海域的逐旬变化情况,从整体上看与月变化情况相似,依旧呈现自西北向东南的带状分布。1月上旬福建省沿岸温度较低,福建省北部沿海、浙江沿海一带呈现最低值。1月中旬SST分布以维持为主,较上旬无明显变化。1月下旬SST出现上升,高温区域往西北方向推进,沿岸低温退往浙江沿海一带。2月上旬SST整体下降,恢复到1月中旬水平。2月中下旬台湾海峡及福建浙江沿海一带SST持续降低,但海峡中心澎湖列岛周围SST持续上升,并略往北边扩大。3月上旬开始,福建北部沿海及浙江沿海的SST低值区开始略有向西北后撤趋势,同时,也开始向东北方向延伸。4月上旬至下旬,研究区北部低值区范围南扩,使台湾岛东部外海SST略有降低,但海峡内部SST略有提高。至5月上旬,研究区整体SST均偏低。5月中旬SST开始回升,到5月下旬整个内陆沿海SST均有不同程度的降低,但福建北部沿海的低值区开始升温。6月上旬至中旬,研究区北部低值区开始反弹,但到6月下旬时已经北退。7月上旬SST略有降低,7月中旬SST回升,但在西南处出现小范围低值区。7月下旬SST继续上升,仅台湾海峡南部出现小范围低值区。待到8月上旬,全研究区SST均达到高值。而8月中旬由于台风影响,海峡南部周边海域出现低值区,以福建南部沿海至广东沿海为最低值,研究区其余区域SST也略有降低。至8月下旬,台风活动仍较为活跃,低值区范围出现在台湾岛西南方向,周边区域SST重新回到高位。9月上旬时,低值区消退,研究区整体SST出现东西向高于南北向的情况。9月中旬北部低值区开始出现,研究区SST呈现东南向的中间高两边低的情况。而9月下旬整体SST提升,低值区退往浙江沿海。到了10月上旬,低值区范围突然扩大,但到10月中旬后范围逐渐缩小直至稳定。此后直至12月下旬,研究区SST无太大区域性变化,仅有不同程度的温度变化,总体又恢复了自北至南逐渐升高的带状分布。
图5

图5
台湾海峡及其周边海域SST逐旬变化空间分布
Fig.5
Spatial distribution of SST change by ten days of Taiwan Strait and its surrounding water
图6
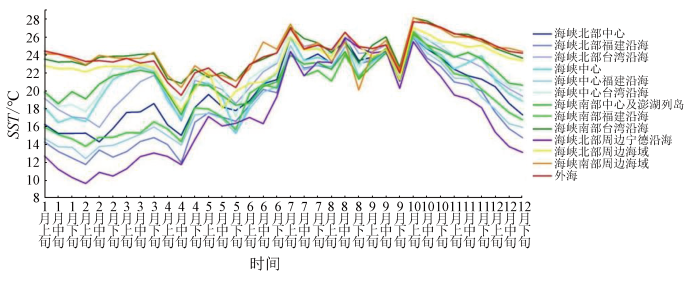
图6
台湾海峡及其周边海域典型区域平均SST逐旬变化
Fig.6
Ten days variation of mean SST in typical regions of Taiwan Strait and its surrounding water
从图6中可以看出,全年SST变化最显著的典型区域为内陆沿海一带,其中以福建宁德沿海为最典型。7月上旬—10月中旬为研究区SST较高时期,但呈现出波动的状态。而2月下旬—3月下旬,台湾海峡内部出现了短时间的小高值区,这在海峡台湾沿海、海峡中线区域尤为明显。4月中旬及5月下旬各区域SST都出现了明显的谷值,以4月中旬为甚,但不同的区域SST降低的程度不尽相同。
4 SST在气象中的初步应用
4.1 月尺度SST与福建内陆降水的相关性分析
图7

图7
福建省8个国家气象观测站及浮标站位置
Fig.7
Location of eight national meteorological observatories and the buoy station in Fujian Province
图8
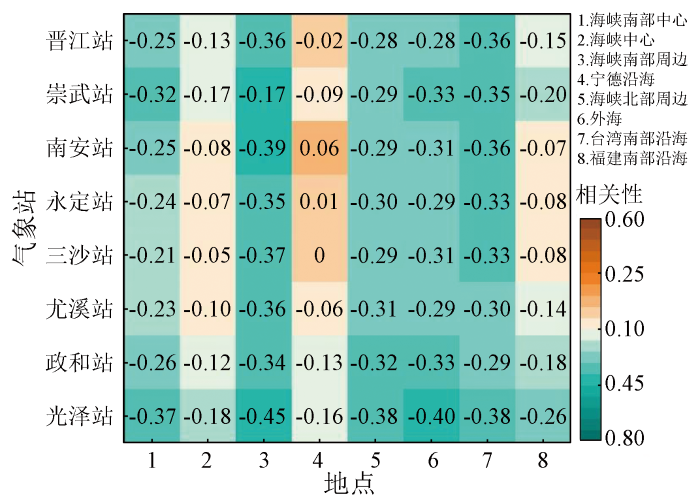
图8
较优结果的SST与降水相关性
Fig.8
Correlation between SST and precipitation with better results
有一定关系,观测站与相关海域间的距离尺度为中小尺度系统,而月累计降水量已无法从局地SST加热作用上去考虑对中小尺度系统的影响,其统计值已覆盖了扰动项。而月平均SST也无法展示SST的波动情况,便无法精确针对单次过程的影响进行分析,仅能从宏观上展现台湾海峡SST与福建省内陆降水之间的联系,便弱化了二者的相关性。
4.2 旬尺度SST与福建沿海海雾相关性分析
4.2.1 海雾旬际变化情况
图9

图9
福建沿海16个浮标站4 a旬际海雾累计时数
Fig.9
Accumulative hours of sea fog every 10 days during four years at 16 buoy stations along the coast of Fujian
4.2.2 SST与海雾相关性分析
海雾的发生与消散不仅与气象条件有关,也与下垫面的SST热状况紧密相关[25]。为探寻SST变化对海雾发生的影响,采取定量分析与定性分析结合的方法进行研究。将浮标站所在位置的旬平均SST与海雾旬累计时次进行斯皮尔曼相关性分析,如表2所示,各浮标处SST与海雾均呈现出显著的较强负相关性。选取相关系数最高的12号浮标站数据(-0.781)进行曲线拟合,结果如图10所示,拟合曲线的R2为0.703 7。通过上述定量分析结果及对比台湾海峡SST旬变化情况(图5)与海雾的旬变化情况,可知福建沿海海雾主要在SST为10~25℃之间时生成,且随着SST的升高,海雾在一定程度上呈现减弱趋势。海洋能够影响空气温湿属性,所以海流与SST对海雾的生成与消失起到了显著作用。太平洋海雾主要为平流冷却雾,其雾区与海流关系较为密切,尤其近岸海区,海雾常常出现在冷海流或冷暖海流交汇处[56]。由上文SST的时空变化可知,冬、春季台湾海峡主要受闽浙沿岸流与黑潮支流支配,海峡西岸SST较低,而东岸SST较高,存在冷海流与冷暖海流的交汇,有利于海雾的形成。且春季湿润的偏南气流与频繁南下的弱冷空气也进一步促进了海雾的发生。而随着夏秋季节的来临,沿岸流改向,逐渐升高的台湾海峡SST对海雾的生成起到了负面影响,造成了海雾在夏、秋季节的明显减弱。
表2 16个浮标站SST与海雾相关性统计
Tab.2
| 浮标站编号 | 相关系数 | 浮标站编号 | 相关系数 |
|---|---|---|---|
| 1 | -0.651 | 9 | -0.600 |
| 2 | -0.662 | 10 | -0.645 |
| 3 | -0.669 | 11 | -0.569 |
| 4 | -0.404 | 12 | -0.781 |
| 5 | -0.592 | 13 | -0.579 |
| 6 | -0.721 | 14 | -0.739 |
| 7 | -0.511 | 15 | -0.614 |
| 8 | -0.578 | 16 | -0.696 |
图10
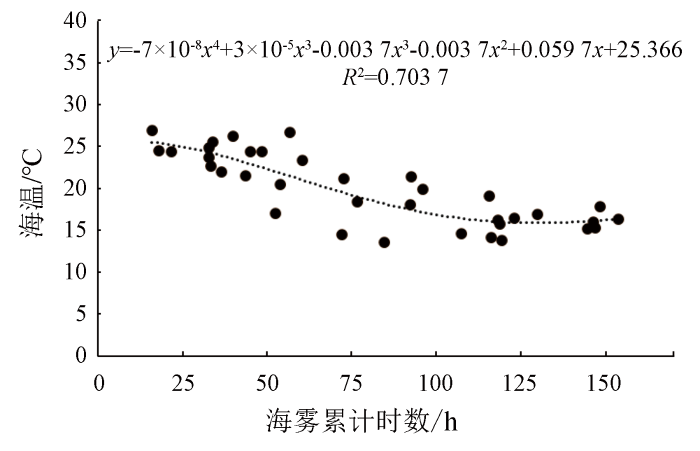
图10
12号浮标SST与海雾相关性拟合
Fig.10
Correlation fitting between SST of buoy No.12 and sea fog
5 结论
本文利用2016—2020年Himawari-8卫星SST产品作为基础数据源,以台湾海峡及其周边海域为研究区,开展了研究区SST的年尺度、季节尺度、旬尺度的SST时空变化分析,并结合地面气象站与海洋浮标站采集的数据,实现了SST产品的初步气象应用,探究了不同尺度的SST与内陆降水、沿海海雾之间的关系,并得出以下结论:
1)受黑潮支流与闽浙沿岸流及季风影响,台湾海峡及其周边海域年平均SST沿海岸线由西北向东南呈带状分布逐渐升高,同时SST也随着纬度的升高而逐渐降低; 海峡两岸SST差距明显,海峡西岸整体SST较东岸低,平均温差为5.94 ℃。
2)台湾海峡及其周边海域的SST分布主要有冬季型与夏季型。冬季SST层次分明,沿岸区域受闽浙沿岸流的影响SST较低,由于同时也受到黑潮的影响,SST等温线近乎平行岸界。夏季太阳辐射增强,研究区海域SST升高,温差缩小,总体SST高于20 ℃。而由于副热带高压影响,10月后SST方逐渐由夏季型转为冬季型。
3)旬SST资料提高了时间分辨率,能更精细地刻画台湾海峡SST的时空变化情况,全年旬SST变化最显著的是福建宁德沿海一带海域,2月下旬—3月下旬在海峡台湾中线区域出现短时间高值区,7月上旬—10月中旬为研究区SST较高时期,但呈现出波动的状态。
4)福建省内陆月降水量与月平均SST总体只存在着较弱的负相关,但台湾海峡南部周边和北部周边以及台湾岛东部外海海域,这些与福建内陆相对较远的区域,如南平地区的光泽站,月平均SST和月降水量基本都有相对较高的负相关。
5)SST是影响海雾生成的重要因子之一,受到沿岸流与黑潮支流影响,福建沿海的海雾与其下垫面的SST之间存在着较强的负相关关系。而福建沿海海雾主要在SST为10~25 ℃之间时生成,且随着SST的升高,海雾的发生次数在一定程度上呈现减弱趋势。
参考文献
Impact of the thermal state of the tropical Western Pacific on onset date and process of the South China Sea summer monsoon
[J].
Sahel rainfall and decadal to multi-decadal sea surface temperature variability
[J].
Oceanic forcing of Sahel rainfall on interannual to interdecadal time scales
[J].We present evidence, based on an ensemble of integrations with NSIPP1 (version 1 of the atmospheric general circulation model developed at NASA's Goddard Space Flight Center in the framework of the Seasonal-to-Interannual Prediction Project) forced only by the observed record of sea surface temperature from 1930 to 2000, to suggest that variability of rainfall in the Sahel results from the response of the African summer monsoon to oceanic forcing, amplified by land-atmosphere interaction. The recent drying trend in the semiarid Sahel is attributed to warmer-than-average low-latitude waters around Africa, which, by favoring the establishment of deep convection over the ocean, weaken the continental convergence associated with the monsoon and engender widespread drought from Senegal to Ethiopia.
华南地区秋季无降水日的变化特征及其与海温的联系
[J].
Features of the autumn non-rainfall frequency over South China and the associated ocean conditions
[J].
Characterizing recent trends in U.S.heavy precipitation
[J].
黄海北部海温与海雾的关系及海雾长期预报
[J].
Relationship between the sea-condition and the sea fog,and the corresponding long-range forecast of sea fog in the northern Yellow Sea
[J].
福建一次春季海雾的边界层特征及其成因分析
[J].
Characteristics of the boundary layer of a spring sea fog in Fujian and its cause analysis
[J].
Atmospheric boundary layer structure and turbulence during sea fog on the southern China coast
[J].
华南沿海海雾的气候特征及其与赤道东太平洋海温的关系
[J].
Climatic features of the sea fog along the South China coast and its relation to the eastern equatorial Pacific SST
[J],
闽南沿海一次春季海雾过程微物理特征分析
[J].
Microphysical structure analysis of a spring sea fog event in southern coastal area of Fujian
[J].
福建省近海区域海面表层温度的卫星遥感应用研究
[J].
Study on the utilization of satellite remote sensing for sea surface temperature of coastal area in Fujian province
[J].
用AVHRR资料计算月平均海水表层温度场
[J].
Calculation of monthly mean sea surface layer temperature field with AVHRR data
[J].
西北太平洋部分海域AVHRR、TMI与MODIS遥感海表层温度的初步验证
[J].
Primary validation of AVHRR/MODIS/TMI SST for part of the Northwest Pacific
[J].
HY-1卫星海温反演的误差分析
[J].
Error analysis of sea surface temperature retrieved from the HY-1 satellite data
[J].
基于AVHRR/SST的西太平洋暖池近期变化研究
[J].
An investigation of recent western pacific warm pool variabilities based on AVHRR/SST
[J].
静止气象卫星反演海温及其分析技术方法的研究
[J].
Study on SST with GMS observation and the method of analysis technique
[J].
台湾海峡海表面温度的遥感反演及精度检验
[J].
Retrieval and validation of sea surface temperature in the Taiwan Strait using MODIS data
[J]
FY-3卫星VIRR海表温度产品进展
[J].
Progress of VIRR sea surface temperature product of FY-3 satellite
[J].
SST retrieving of the Pearl River Estuary by thermal infrared images from Landsat8 satellite
[J].
利用Landsat TM6数据反演大亚湾海水表层温度
[J].
影响春季热带太平洋地区海温变化的动力热力作用分析
[J].
Analysis of the influence of dynamic and thermal effects on sea temperature in the tropical Pacific Ocean during spring
[J].
SST retrieving of DAYA Bay from Landsat TM6
[J].
On the variability of winds,sea surface temperature,and surface layer heat content in the western equatorial Pacific
[J].
Oceanic heat content variability in the tropical Pacific during the 1982-1983 El Niño
[J].
Characteristics of the sea surface temperature variation in adjacent area of the Yangtze River Estuary
[J].
中国东海黑潮海温变化特征及成因分析
[J].
The characteristics of sea temperature variation in the Kuroshio area in the East China Sea and its causes
[J].
Climatology and change of the South China sea surface temperature based on satellite observations
[J].
西太平洋赤道附近海温与中国东南沿海台风关系的初步分析
[J].
Primary analysis of relation between SST of West-Pacific near Equator and typhoon along southeast China
[J].
Analysis of temporal and spatial characteristics of sea surface temperature variations over the past 34 years in coral reef areas of the South China Sea
[J].
利用MODIS数据反演南海南部海表温度及时空变化分析
[J].
DOI:10.11873/j.issn.1004-0323.2020.1.0132
[本文引用: 1]

南海海水表面温度对中国陆地的气候变化具有显著的影响。以南海南部海域为例,首先对MODIS基础数据进行几何校正及影像去云等预处理,利用辐射传输模型MODTRAN计算大气透过率,利用MODIS数据第31和32波段辐射亮度值计算亮度温度,采用劈窗算法反演南海南部海域海表温度,反演结果与产品及实测数据进行回归分析,采取决定系数(R <sup>2</sup>)、误差平方和(SSE)及均方根误差(RMSE)进行拟合情况评价。决定系数(R <sup>2</sup>)大于0.8,SSE、RMSE较小,其中反演结果与实测数据的SSE为1.025,RMSE为0.158,说明反演精度良好。研究表明:温度具有明显的区域和季节变化特征,秋冬较低,春夏较高,在空间上从离近岸向中心海域方向递减,海盆中心温度低。温度受气候的影响,与厄尔尼诺现象呈正相关,与拉尼娜现象呈负相关。
Sea surface temperature inversion of the Southern South China Sea from MODIS and temporal and spatial variation analysis
[J].
Spatial and temporal distribution and variation of aerosol optical depth in coastal southeast China based on Himawari-8 satellite
[J].
闽南—台湾浅滩渔场海表温度对鲐鲹鱼类群聚资源年际变动的影响初探
[J].
Potential influence of sea surface temperature on the interannual fluctuation of the catch and the distribution of chub macherel and round scad in the Minnan-Taiwan bank fishing ground,China
[J].
Hourly sea surface temperature fusion based on Himawari-8 satellite
[J].
近百年中国近海海温变化
[J].
The long-term change for sea surface temperature in the last 100 years in the offshore sea of China
[J].
Progress in the marine sedimentary environment research for the Taiwan Strait
[J].
基于Floyd算法的海温时间序列分割
[J].
Sea surface temperature time series segmentation based on Floyd algorithm
[J].
Satellite observations of the thermal front in the Taiwan Strait and its adjacent seas
[J].
Sea surface temperature from the new Japanese geostationary meteorological Himawari-8 satellite
[J].
中国东海海表温度时空演化分析
[J].
Spatiotemporal evolution of sea surface temperature in the East China Sea
[J].
南大洋海温长期变化研究进展
[J].
DOI:10.11867/j.issn.1001-8166.2020.076
[本文引用: 1]
近几十年来,南大洋是全球吸热最显著、存储热量最多的洋盆,但其海温变化的机制以及演变过程至今还不清楚,因此南大洋成为近年来气候变化研究的热点海域。通过回顾有关南大洋海温长期变化的观测事实和模式模拟的研究结果,介绍了前人研究中有关风场、表面热通量、海冰等不同因素在南大洋海温变化中的作用,以及海洋平均环流、海洋涡旋等海洋内部动力过程对南大洋海温的调整机制,并提出从海洋对外辐射强迫的快、慢时间尺度响应这一角度来全面理解南大洋海温的变化机理和演变过程。最后结合目前的研究现状和未来需要深入研究的问题进行了探讨和展望,以期推动在气候变化背景下对南大洋内部响应过程本质的认识和其气候效应方面的研究。
Research progress of long-term ocean temperature changes in the southern ocean
[J].
DOI:10.11867/j.issn.1001-8166.2020.076
[本文引用: 1]
In the recent decades, a large amount of anthropogenic heat has been absorbed and stored in the Southern Ocean. Results from observations and climate models' simulations both show that the Southern Ocean displays large warming in the upper and subsurface ocean that maximizes at 45°~40°S. However, the underlying mechanisms and evolution processes of the Southern Ocean temperature changes remain unclear, leaving the Southern Ocean to be a hotspot of climate change studies in the recent years. The present study summarized the current progress in the observations and numerical modeling of long-term temperature changes in the Southern Ocean. The effects of changes in wind, surface heat flux, sea-ice and other factors on the ocean temperature changes were presented, along with the introduction to the role of oceanic mean circulation and eddies. The present study further proposed that a deepening of the understanding in the Southern Ocean temperature change may be achieved by investigating the fast and slow responses of the Southern Ocean to external radiative forcing, which are respectively associated with the fast adjustments of the ocean mixed-layer and the slow evolution of the deep ocean. Specifically, the striking and fast mixed-layer ocean warming north of 50°S is tightly related to the surface heat absorption over upwelling regions and wind-driven meridional heat transport, resulting in enhanced warming around 45°S. While in the slow response of the Southern Ocean temperature, the enhanced ocean warming shifts southward and downward, mainly associating with the heat transfer from oceanic eddies. The Southern Ocean temperature has pronounced climatic effects on many aspects, such as global energy balance, sea-level rise, ocean stratification changes, regional surface warming and atmospheric circulation changes. However, large model biases/deficiencies in simulating the present-day climatology and essential ocean dynamic processes last in generations of climate models, which are the main challenge in advancing our understanding in the mechanisms for the Southern Ocean climate changes. Therefore, to achieve reliable future projections of the Southern Ocean climate, substantial efforts will be needed to improve the model performances and physical understanding in the relative role of various processes in ocean temperature changes at different time scales.
Atmosphere-ocean interaction on weekly timescales in the North Atlantic and Pacific
[J].
Atmospheric GCM response to extratropical SST anomalies:Synthesis and evaluation
[J].
全球变暖背景下热带太平洋海温长期趋势研究
[J].
Long term trend of tropical Pacific temperature under global warming
[J].
An active role of extratropical sea surface temperature anomalies in determining anomalous turbulent heat flux
[J].
海陆温差指数与我国华北地区降水的相关性分析
[J].
Correlation analysis between sea-land temperature difference index and precipitation in North China
[J].
Characteristics of Air-sea interaction associated with large-scale sea surface temperature warm anomalies over the North Pacific in winter on submonthly timescales
[J].
近20年全球冬、夏季海平面气压场和500 hPa高度场年代际变化特征分析
[J].利用1958-1997年全球海平面气压场和500hPa高度场的月平均资料分析了70年代中后期年代际突变前后16a平均的冬、夏海平面气压场和500hPa高度场的变化特征。结果表明,发生在70年代中后期的年代际气候突变是全球性的;突变后与突变前相比,冬季海平面气压场上的阿留申低压增强并发生了东移,与之对应的冬季500hPa高度场上的东亚大槽减弱,同时也发生了明显的系统性东移;冬季,蒙古高压北部减弱,南部稍有增强;夏季,印度低压和东亚的季风低压均减弱;而副热带高压系统普遍增强。
Analyses on interdecadal change characteristics of global winter and summer sea surface pressure field and 500 hPa height field in recent twenty years
[J].
Progress of regional oceanography study associated with western boundary current in the South China Sea
[J].
Modulation of land-sea distribution on air-sea interaction and formation of subtropical anticyclones
[J].
MODIS遥感数据在我国台湾海峡海雾监测中的应用
[J].
The application of monitoring sea fog in Taiwan Strait using MODIS remote sensing data
[J].
