

0 引言
翟俊等[20]利用Landsat TM/ETM+卫星数据、MODIS MCD43B3和MCD43B2数据分析1990—2010年中国土地覆被变化如何改变地表反照率,并计算中国50个生态区地表反照率变化导致的年际辐射强迫情况,得到中国土地覆被变化通过改变地表反照率引起了0.062 W/m2的平均辐射强迫,为增温的气候效应; 王倩[21]使用MODIS MCD12Q1和MCD43A3数据研究2001—2016年秦岭淮河区域地表覆被变化引起反照率变化的时空变化特征,利用CERES EBAF Surface_Ed2.8月辐射收支数据分析地表下行短波辐射的时空变化特征并计算出反照率变化导致的年际尺度辐射强迫情况,得出地表覆被类型为耕地、林地、草地、城市和建设区的正强迫大于负强迫,产生升温效应,地表覆被类型为水域的负强迫大于正强迫,产生降温效应。且两者均得出土地覆被变化会影响气候的变化。
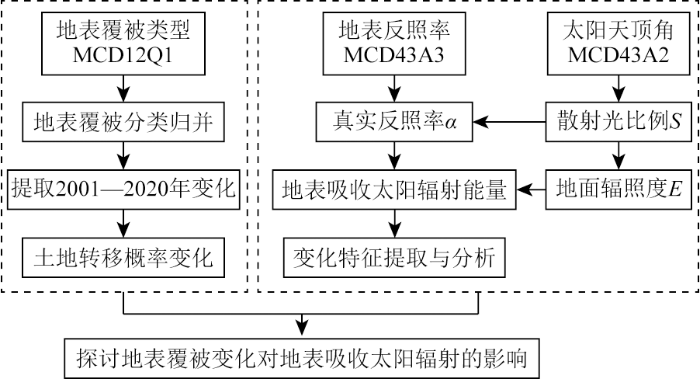
本文以中国西北地区为研究区域,选择2001—2020年MODIS MCD12Q1地表覆被数据、MCD43A3地表反照率数据和MCD43A2太阳天顶角数据,通过空间统计方法,分析地表覆被和地表太阳辐射吸收的空间分布特征,通过时序分析,揭示地表覆被变化对地表太阳辐射吸收的影响,如图1所示。
图1
1 研究区概况与数据源
1.1 研究区概况
图2
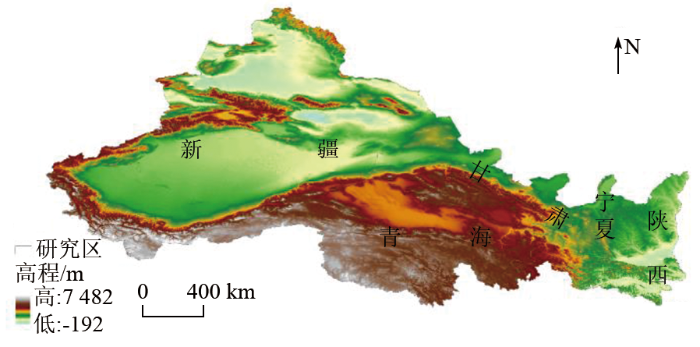
研究区总面积约3.2×10⁶ km2,占中国陆地总面积的1/3。该区是世界上生态系统最脆弱的区域之一[23],是太阳辐射的高值区之一[24],是中国生态建设的一大难题,其气候增率明显高于全球水平[25]。中国从20世纪开始实施6大林业生态工程,改变土地利用/覆盖,中国西北植被覆盖率逐渐增加回升,因此土地荒漠化得到有效缓解[8]。因全球气候变暖向暖湿变化,及时实施以大多改变为灌木或草本植物为主用来维持生态平衡与改善环境等政策显得尤为重要[26]。该区太阳辐射大部分呈单峰型分布,青海高原为双峰型,太阳辐射总体来看,由东南和西北向中部增加,最高值出现于青海高原高寒生态区[27],最低值在陕西中南部。太阳总辐射年/季变化与全球变化趋势一致,5—7月总辐射最多[24]。
1.2 数据源
地表覆被数据选用2001年、2005年、2010年、2015年和2020年的MODIS MCD12Q1,来源于美国宇航局NASA(
2 研究方法
2.1 数据处理
MODIS数据选用可覆盖整个研究区的h23v04,h24v04,h25v04,h23v05,h24v05,h25v05,h26v05和h27v05共8景影像。利用MRT(MODIS reprojection tools)工具对影像进行批量拼接、格式转换和裁剪处理。利用地表反照率和太阳天顶角数据,基于7月1—15日的15个日均地表吸收太阳辐射值进行平均作为该年份地表真实吸收太阳辐射值。
2.2 地表覆被数据的归并
表1 重分类信息
Tab.1
| 归并后 | 值 | 描述 | 对应IGBP地表覆被类型 |
|---|---|---|---|
| 林地 | 1 | 树木覆盖率>60% | 1常绿针叶林、2常绿阔叶林、3落叶针叶林、4落叶阔叶林、5混交林、6郁闭灌木丛、7开放灌木丛 |
| 草地 | 2 | 草本植物为主,树木 覆盖率10%~60% | 8多树草地、9稀树草地、10草地 |
| 耕地 | 3 | 种植农作物土地 | 12耕地、14农田/自然植被 |
| 水体 | 4 | 永久湿地与水域 | 11永久湿地、17水域 |
| 建设用地 | 5 | 居民点、交通等用地 | 13城市区和建筑用地 |
| 永久冰雪 | 6 | 冰与积雪 | 15永久冰雪 |
| 裸地 | 7 | 未利用土地 | 16裸地 |
2.3 地表吸收太阳辐射的计算
首先计算晴空条件下的散射光比例S[33],计算公式为:
式中θ为太阳天顶角。
再将MCD43A3短波黑空反照率αb、白空反照率αw与散射光比例S一同求出真实反照率α,也称蓝空反照率,计算公式为:
并利用MCD43A2太阳天顶角数据θ求得地面辐照度E,即:
式中E0为太阳常数,指在日地平均距离间,大气顶界垂直于太阳光线的单位面积每秒钟接收的太阳辐射,取值为1 367 W/m2[34]。
太阳辐射因云的反射和散射、气溶胶、大气的散射和吸收等因素削弱[11],因此地表真实吸收太阳辐射即净辐射Rn的计算公式为:
将计算出每天的Rn(15 d/a),通过像元值去0后平均的方法,求出每一种地表覆被类型i在2001—2020年20 a间平均吸收的太阳辐射值
式中:year=1,2,···,5,分别代表2001年、2005年、2010年、2015年和2020年; i为各种地表覆被类型,分别为林地、草地、耕地、水体、建设用地、永久冰雪和裸地;Rn,i,year为某年第i种地表覆被类型吸收的太阳辐射值。
3 结果与分析
3.1 地表覆被空间分布
研究区裸地大面积分布于新疆及甘肃和青海西北部,如图3所示。草地主要分布于东南和西北部。耕地聚集在陕西中南部、甘肃东南角草地附近以及条状分布在新疆西北处。林地集中分布在陕西中部及南部、甘肃南部与陕西接壤部分。永久冰雪以条状分布在新疆中南部和南部。水体主要分布在青海和新疆。建设用地除西安市外分布较分散。
图3-1
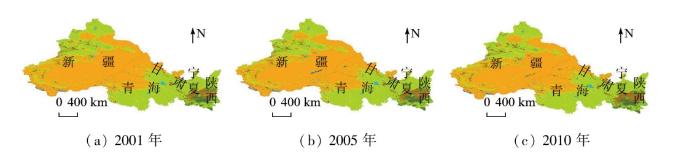
图3-2
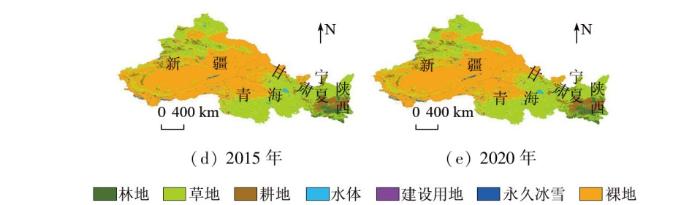
不同地表覆被类型面积变化如表2所示,面积从大到小为: 裸地>草地>耕地>林地>永久冰雪>水体>建设用地。类型未变化的面积占93.41%。地表覆被类型整体结构特征为: 裸地、草地和耕地是3种主要的地表覆被类型,三者面积之和始终占总面积的95%左右。裸地: 面积变化与其他6种类型不同,裸地在2001—2020年20 a间始终呈萎缩且有加速萎缩的态势,共减少71 443.12 km2,但仍是最大的地表覆被类型,超过研究区面积的一半。草地: 面积上下浮动,最终增加11 636.43 km2。耕地: 面积变化显著,一直处于大幅度增加状态,增加量是所有增加的地表覆被类型中最多的,共增加28 438.83 km2。
表2 不同地表覆被类型面积变化情况
Tab.2
| 时间 | 类型 | ||||||
|---|---|---|---|---|---|---|---|
| 林地 | 草地 | 耕地 | 水体 | 建设用地 | 永久冰雪 | 裸地 | |
| 2001年 | 68 418.15 | 1 135 276.41 | 151 978.12 | 16 918.54 | 8 129.77 | 15 056.37 | 1 613 118.60 |
| 2005年 | 71 313.26 | 1 135 107.04 | 159 211.47 | 16 846.20 | 8 192.02 | 22 361.85 | 1 595 864.12 |
| 2010年 | 76 573.25 | 1 135 563.62 | 170 331.43 | 17 215.41 | 8 288.61 | 21 068.10 | 1 579 855.52 |
| 2015年 | 79 796.14 | 1 132 188.33 | 180 304.04 | 17 715.99 | 8 474.08 | 22 984.58 | 1 567 432.80 |
| 2020年 | 87 243.72 | 1 146 912.84 | 180 416.95 | 18 555.95 | 8 690.67 | 25 400.34 | 1 541 675.48 |
3.2 地表覆被空间分布动态变化
表3 2001—2020年地表覆被转移矩阵
| 2001年 | 2020年 | |||||||
|---|---|---|---|---|---|---|---|---|
| 林地 | 草地 | 耕地 | 水体 | 建设用地 | 永久冰雪 | 裸地 | 合计 | |
| 林地 | — | 2 691.18 | 24.9 | 41.43 | 0 | 60.75 | 79.21 | 2 897.47 |
| 草地 | 18 465.15 | — | 47 131.31 | 952.23 | 196.63 | 172.8 | 14 965.57 | 81 883.69 |
| 耕地 | 2 497.34 | 18 492.2 | — | 29.62 | 355.69 | 0 | 27.69 | 21 402.54 |
| 水体 | 98.74 | 291.72 | 12.88 | — | 0 | 309.32 | 752.16 | 1 464.82 |
| 建设用地 | 0 | 0 | 0 | 0 | — | 0 | 0 | 0 |
| 永久冰雪 | 0.64 | 62.04 | 0.86 | 10.52 | 0 | — | 1 600.49 | 1 674.55 |
| 裸地 | 661.15 | 71 982.99 | 2 671.43 | 2 068.45 | 8.59 | 11 475.65 | — | 88 868.26 |
| 合计 | 21 723.02 | 93 520.13 | 49 841.38 | 3 102.25 | 560.91 | 12 018.52 | 17 425.12 | 198 191.33 |
图4-1
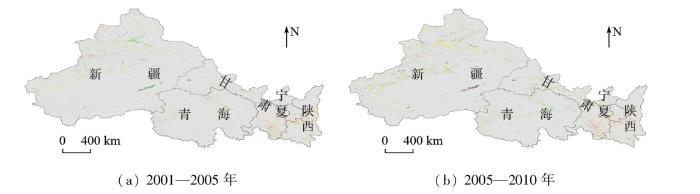
图4-1
地表覆被分类变化空间分布
Fig.4-1
Spatial distribution of land cover classification changes
图4-2
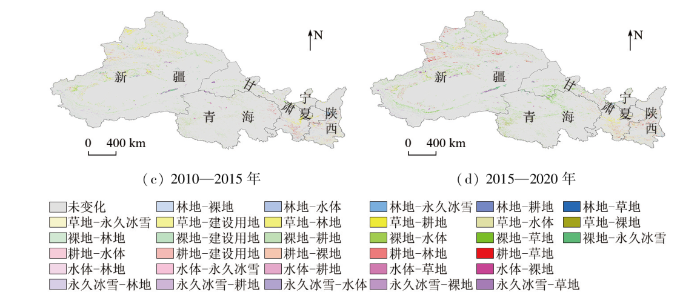
图4-2
地表覆被分类变化空间分布
Fig.4-2
Spatial distribution of land cover classification changes
图5
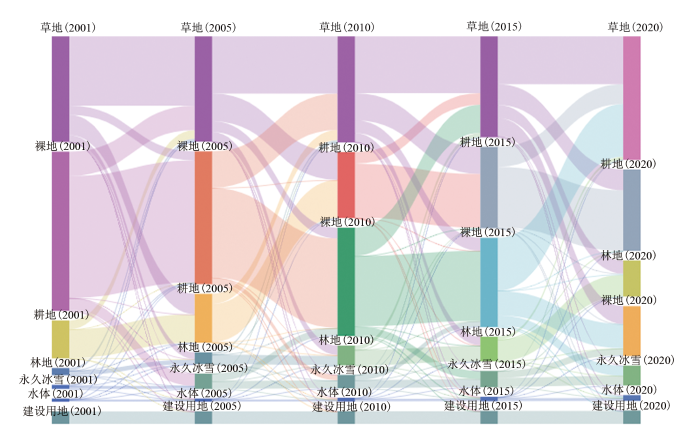
图5
2001—2020年地表覆被类型转移变化情况
Fig.5
Changes in land cover type shifts during 2001—2020
从表3的转移情况可看出,2001—2020年20 a间除裸地呈萎缩态势外,其余类型均呈增长态势。发生变化的面积共198 191.33 km2。未发生转换的类型有林地—建设用地、耕地—永久冰雪、水体—建设用地及永久冰雪—建设用地。2001—2005年和2015—2020年向外流转最多的类型是裸地,而2005—2015年是草地。建设用地未发生过转出,仅有转入。因此本文主要研究变化面积较大的4种类型间的转换和土地转移概率。第1—4阶段分别对应2001—2005年、2005—2010年、2010—2015年、2015—2020年。
裸地20 a间共转出88 868.26 km2,其中81.00%转为草地,12.91%转为永久冰雪,转为建设用地占比最小。裸地的转入主要来自于草地、永久冰雪和水体。由图4可知,裸地转为草地集中在新疆、青海及甘肃西部。转为永久冰雪发生在新疆。
草地20 a间共转出81 883.69 km2,其中超过一半转为耕地,22.55%转为林地,18.28%转为裸地。转为草地主要有裸地、耕地和林地。各类型向草地的转入情况总体呈先增加后减少再大幅度增加的趋势,整体出现净增加和净减少交替的情况。
耕地20 a间共转出21 402.54 km2,其中86.40%转为草地,11.67%转为林地,只分布在研究区东部。这可能因为退耕还林还草等原因使耕地向二者流转占比较大。耕地主要转入类型为草地和裸地。耕地整体一直处于净增加的状态。
林地20 a间共转出2 897.47 km2。林地92.88%转为草地,可能是人为砍伐树林,原本林地下的草地被发现; 林地被砍伐后,人为进行生态恢复,播撒草籽后形成新草地。林地流转主要来自于草地、耕地和裸地。
3.3 地表吸收太阳辐射分布动态变化
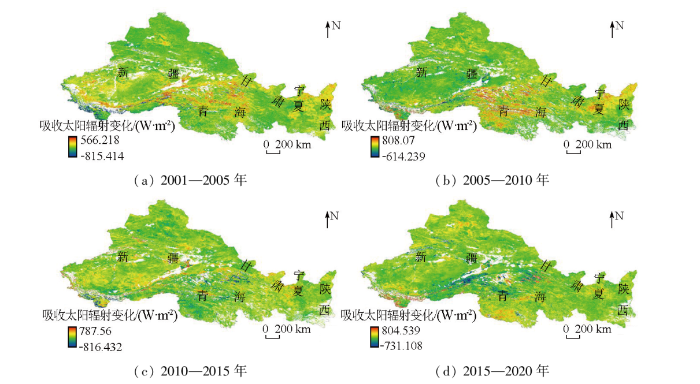
图6
图6
地表吸收太阳辐射空间分布
Fig.6
Spatial distribution of solar radiation absorbed by the Earth’s surface
地表吸收太阳辐射的大小与地表覆被类型相关,并且差异较大,如图7所示。结果表明,年均吸收太阳辐射最大值始终出现在水体,其次是林地,基本集中在[1 000,1 250) W/m2之间。而最小值一直在永久冰雪中产生,2001—2020年间出现最小吸收值为260.91 W/m2。各类地表覆被类型吸收太阳辐射值的均值排序为: 水体>林地>耕地>草地>建设用地>裸地>永久冰雪。
图7
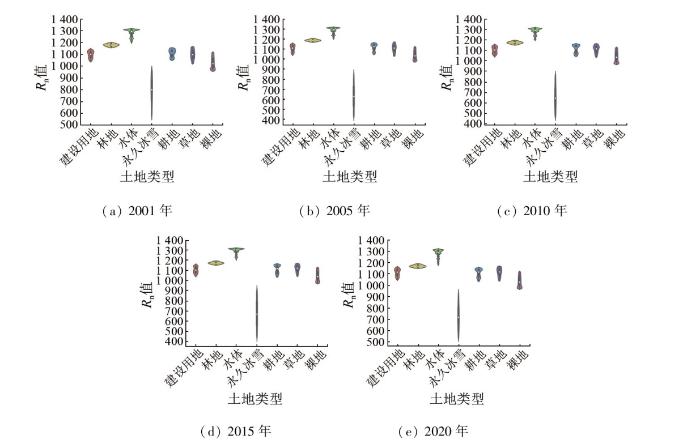
图7
不同地表覆被类型年均吸收太阳辐射的数值范围
Fig.7
Numerical ranges of average annual absorption of solar radiation by different land cover types
如图8所示,地表吸收太阳辐射增加地区主要集中于新疆西南处和北部,而减少区域分布于新疆南部边界和青海中部及北部附近。
图8
3.4 吸收太阳辐射对地表覆被变化的响应
地表覆被变化会影响地表对太阳辐射的吸收情况,因此量化其中影响尤为重要。基于地表覆被类型变化和地表吸收太阳辐射值,得出不同地表覆被类型吸收太阳辐射的空间分布情况,如图9所示。图中数字“1-7”依次表示林地、草地、耕地、水体、建设用地、水体、永久冰雪、裸地,正负则表示地表覆被变化引起太阳辐射吸收值的增加与减少。如: “12-”表示为林地变为草地导致吸收太阳辐射减少。
图9
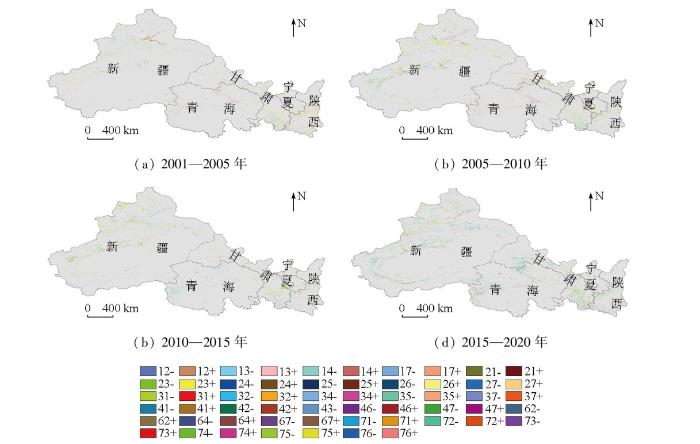
图9
不同地表覆被类型吸收太阳辐射变化空间分布
Fig.9
Spatial distribution of changes in solar radiation absorption by different surface types
图10
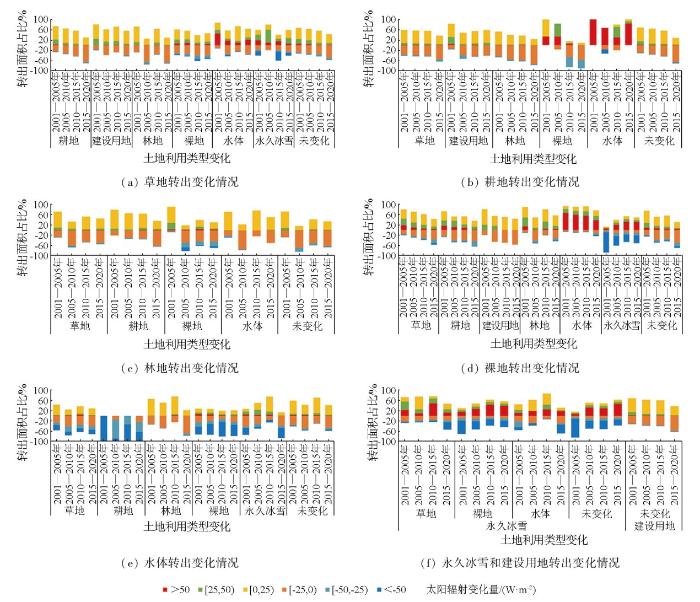
图10
不同地表类型吸收太阳辐射变化
Fig.10
Changes in solar radiation absorption by different surface types
裸地向其他6种类型均有转换。裸地未变化、转为草地和转为耕地情况相同,2001—2015年间以增加为主,而2015—2020年间以减少为主,主要变化范围在-25~50 W/m2。转为建设用地除2010—2015年间增加和减少比例均为50%以外,其余的与裸地未变化情况一致。未变化和转为建设用地集中在0~25 W/m2间变化。转为林地除2005—2010年间以减少为主,其余均以增加为主,主要在0~50 W/m2间。转为永久冰雪只有2010—2015年间情况不同,以增加为主,其他时段均以减少为主。特别地,裸地向水体转换,2001—2020年间均以增加为主。转为永久冰雪吸收辐射变化在小于-50 W/m2之间面积最大,而转为水体则在大于50 W/m2之间面积最大。
草地未变化区域吸收太阳辐射除第4阶段减少外,其余均以增加为主,且幅度随时间逐渐下降,主要集中在-25~25 W/m2范围内变化,占总体变化范围的70%以上。转为耕地的情况同未改变地区情况相同,变化幅度一大半处于0~25 W/m2区间内。转为建设用地和水体的情况一致,2001—2020年间始终以增加为主,但比例变小。其中,转为建设用地时变化幅度主要集中在0~25 W/m2,而转为水体主要聚集于>50 W/m2。转为林地出现增加减少反复变换的情况,2001—2005年和2010—2015年间以增加为主,而2005—2010年和2015—2020年间以减少为主。转为裸地时,2001—2010年间以增加为主,大多数变化范围为0~25 W/m2,而2010—2020年间以减少为主,变化区域在-25~0 W/m2之间。
耕地未变化区域在2001—2015年间对地表吸收太阳辐射增加明显,而2015—2020年间以减少为主。转为草地同耕地未变化情况一样,但比例变化程度较耕地未变化弱。转为林地的情况与转为草地的情况相反。转为裸地在前2个阶段以增加为主,其中第1阶段只有增加,在后2个阶段以减少为主。向裸地转出所引起的太阳辐射吸收是变化程度最大最明显的。耕地转为水体在2001—2020年间均以增加为主,特别地,在第1和4个阶段只有增加。转出为其他类型时,在-25~25 W/m2间变化的最多。
林地未变化区域除2001—2005年间以增加为主外,其余均以减少为主。转为耕地与林地未变化情况相同,而转为裸地与其相反。其中,林地转为裸地在第1阶段增加比例高达93.30%,是林地转出的所有比例中最高的。向草地转换时,在第1和3个阶段以增加为主,在第1和3个阶段以减少为主。转为水体只有2005—2010年间以减少为主,2001—2005年和2010—2020年间均以增加为主。林地转出时,变化范围在0~25 W/m2间面积最大。
水体和永久冰雪面积较小,水体未变化时,在第1和3阶段以增加为主,第2和4阶段以减少为主。而永久冰雪未变化时则与水体情况相反,在第1和3阶段以减少为主,第2和4阶段以增加为主。建设用地未变化区域,整体上以增加为主,其中前3个阶段均以增加为主,而第4个阶段以减少为主。
4 讨论与结论
4.1 讨论
地表覆被类型决定吸收的太阳辐射在地表的分配,其分配形成不同尺度上气候系统的边界环境。地表覆被类型变化导致能量的重新分配,从而影响气候变化、地表与大气间能量平衡和水汽交换。
4.1.1 地表覆被类型的变化
西北地区严格执行耕地占补平衡制度,实施耕地和基本农田保护政策,通过控制建设用地占用耕地、生态退耕对农业结构作调整[27,38-39]。土地复垦为耕地,用于种植业或特色农业发展,因此耕地持续增加。通过生态修复与建设措施对废弃采矿、采挖区等工矿地进行土地复垦,增加林草面积,用于林牧业发展,林草地面积持续增加。转变农业生产经营活动形式和严禁过度采探矿使草地三化情况得到一定程度遏制[40]。2001—2020年间,草地始终是林地和耕地转换的主要类型,因此草地面积的变化与林地和耕地关系最为密切。通过合理控制建设用地规模,优化布局和结构,建设用地在2001—2020年间稳步增加但幅度并不大。研究区裸地占地面积最大,合理利用可垦荒地,改善中国西北的生态环境成为重要工作目标。利用裸地开发牧草地等导致裸地面积减少显著。综上,应继续推进中国天然林保护工程、水土流失治理工程和农村牧区环境综合整治工程,加强西北防沙治沙,保护生态脆弱区等工作。
4.1.2 地表覆被类型变化对吸收太阳辐射影响
不同地表覆被类型的转换影响地表反照率变化,导致吸收太阳辐射变化情况和分布位置不同而影响气候。地表覆被类型转换对应的吸收太阳辐射变化情况中变化最明显的为裸地、草地、耕地。其中,耕地、草地、裸地、永久冰雪吸收太阳辐射增加的区域大于吸收太阳辐射减少的区域; 而水体、林地则多半为吸收太阳辐射减少。
其他类型转为草地,使地表吸收二氧化碳的植被数量和种类增加,大气中二氧化碳含量减少; 其他地类变为耕地,地表粗糙程度增加,进而影响蒸散发和潜热通量增加,因此两者的转入导致吸收太阳辐射增加大于减少。林地的冠层结构和耕地、草地不同,地表反照率较两者低,对森林的砍伐等增加地表反照率,叶面积和粗糙程度变大,导致蒸散发减少,潜热通量减少,造成地表吸收太阳辐射减少。水体对太阳辐射的吸收能力更强,因此转为其他类型时,大多数主要为吸收太阳辐射减少,少数增加情况可能由于尺度和数据精度等原因。裸地表面植被稀疏且分布分散,地表反照率低,吸收太阳辐射能力强,转换为永久冰雪时,其地表反照率远低于永久冰雪,吸收太阳辐射减少。但由于林地、草地地表反照率和干燥的裸地近似,因此裸地转换为两者时,吸收太阳辐射出现增加的情况。建设用地没有转出只有转入,导致地表反照率逐渐下降,建筑物的三维形态和建筑物阴影将影响建设用地对太阳辐射的吸收[41],越高越复杂的建筑物越能使地表吸收太阳辐射增加。永久冰雪可能会导致林地表面的雪被枝叶影子遮挡,耕地和草地由于植被冠层高度较低而被覆盖,地表反照率增加,吸收太阳辐射能力弱,永久冰雪转换为草地、林地和水体时,吸收太阳辐射增加。但由于全球变暖,永久冰雪可能化为水或化为水又因受冷空气影响变为冰面后,都会使地表反照率降低,导致永久冰雪在转换为裸地时,出现吸收太阳辐射减少的情况。
本研究发现,地表覆被类型未变化的地区吸收太阳辐射也不同,这可能由于林地经过年份增加而长高、冠层高度产生变化、耕地作物发生变化、土地湿润程度导致地表反照率变化、城市化与工业化加重、建设用地内部发生的变化(如低层建筑物重建为高层建筑物)等原因造成的。综上所述,地表覆被类型变化对吸收太阳辐射有着不可忽视的影响,但太阳辐射的吸收是由于多种因素共同影响,因此研究气溶胶、地表粗糙度和叶面积指数等对研究地表辐射吸收变化和能量平衡有着重要意义。
4.2 结论
本文分析研究区不同地表覆被类型的变化对应的吸收太阳辐射的情况,进而探讨其影响。主要结论如下:
1)研究区2001—2020年20 a间,只有裸地面积急剧减少,其他6种类型均有不同程度的扩张,面积变化排序为: 裸地>草地>耕地>林地>永久冰雪>水体>建设用地。主要转出类型有裸地、草地和耕地。转入类型主要有草地、耕地和林地。2001—2020年间面积变化最大的是裸地向草地的转换,达到71 982.99 km2,占总变化面积的36.27%。
2)吸收太阳辐射变化区域主要分布于新疆中南部、青海中部偏北、甘肃东部及与青海接壤处和宁夏东西部。
3)地表吸收太阳辐射强弱的影响因素主要有海拔、纬度位置、大气透明度和地表覆被类型等。本文主要研究不同地表覆被类型引起的地表吸收太阳辐射变化。最显著的为水体与草地、耕地和裸地的相互转换。各类型吸收太阳辐射能力排序为: 水体>林地>耕地>草地>建设用地>裸地>永久冰雪。
4)即使地表覆被类型相同,但吸收太阳辐射值也不同。草地、耕地、建设用地和裸地未变化区域以增加为主,而林地未变化时以减少为主。水体未变化时,在第1和3阶段以增加为主,在第2和4阶段以减少为主。而永久冰雪未变化情况与水体的相反。
参考文献
国际气候治理中的公正转型议题:概念辨析与治理进展
[J].
Just transition in climate regime:Concept development and governance progress
[J].
Creating a sustainable food future:A menu of solutions to sustainably feed more than 9 billion people by 2050
[J].
Fourth assessment report (AR4).Climate change 2007:The physical science basis
[R].
贵州省黎平县地表覆被变化引起的生态系统碳储量变化
[J].
Changes in ecosystem carbon stock caused by land cover conversion in Liping County of Guizhou Province
[J].
Climate change 2007:Mitigation.contribution of working group III to the fourth assessment report of the intergovernmental panel on climate change
[J].
Assessing the efficiency of changes in land use for mitigating climate change
[J].
森林碳汇的研究热点与趋势——基于知识图谱分析
[J].
Trends and hotspots of forest carbon sinks based on the knowledge map
[J].
Spatial and temporal variations of land use and vegetation cover in Southwest China from 2000 to 2015
[J].
从Himawari08卫星估算晴空地表长波辐射及其日变化特征初探
[J].
Estimation and diurnal variation analysis of clear-sky surface longwave radiation fluxes from Himawari08 satellite
[J].
地面太阳辐射的变化、影响因子及其可能的气候效应最新研究进展
[J].
DOI:10.11867/j.issn.1001-8166.2008.09.0915
[本文引用: 1]

近几十年来,全球和我国大部分区域的地面太阳辐射都经历了一个从减少到增加的过程,也就是所谓的地球“变暗”到“变亮”;引起这种变化的原因复杂多样,总云量的变化无法完全解释,而气溶胶的变化则有可能在某些地区(包括中国)起着重要作用;地面太阳辐射的这种变化会产生重要的气候效应,在“变亮”的过程中有可能使温室气体的增暖效应表现得更加明显。从以上3个方面,对近几年国内外利用地面观测资料和卫星遥感资料所得到的最新研究成果进行了总结和分析,这些研究所揭示的与全球气候变化有关的基本事实也可以为我国的气候变化研究提供一定的参考和启示。
The progress in variation of surface solar radiation,factors and probable climatic effects
[J].
Phenology and species determine growing-season albedo increase at the altitudinal limit of shrub growth in the sub-Arctic
[J].
DOI:10.1111/gcb.13297
PMID:27158930
[本文引用: 1]
Arctic warming is resulting in reduced snow cover and increased shrub growth, both of which have been associated with altered land surface-atmospheric feedback processes involving sensible heat flux, ground heat flux and biogeochemical cycling. Using field measurements, we show that two common Arctic shrub species (Betula glandulosa and Salix pulchra), which are largely responsible for shrub encroachment in tundra, differed markedly in albedo and that albedo of both species increased as growing season progressed when measured at their altitudinal limit. A moveable apparatus was used to repeatedly measure albedo at six precise spots during the summer of 2012, and resampled in 2013. Contrary to the generally accepted view of shrub-covered areas having low albedo in tundra, full-canopy prostrate B. glandulosa had almost the highest albedo of all surfaces measured during the peak of the growing season. The higher midsummer albedo is also evident in localized MODIS albedo aggregated from 2000 to 2013, which displays a similar increase in growing-season albedo. Using our field measurements, we show the ensemble summer increase in tundra albedo counteracts the generalized effect of earlier spring snow melt on surface energy balance by approximately 40%. This summer increase in albedo, when viewed in absolute values, is as large as the difference between the forest and tundra transition. These results indicate that near future (<50 years) changes in growing-season albedo related to Arctic vegetation change are unlikely to be particularly large and might constitute a negative feedback to climate warming in certain circumstances. Future efforts to calculate energy budgets and a sensible heating feedback in the Arctic will require more detailed information about the relative abundance of different ground cover types, particularly shrub species and their respective growth forms and phenology.© 2016 John Wiley & Sons Ltd.
Global biogeophysical interactions between forest and climate
[J].
加快构建西北地区生态保护新格局
[J].
Accelerate construction of new pattern of ecological protection in Northwest China
[J].
国内外气象干旱研究现状与前沿分析
[J].
Research status and frontier analysis of meteorological drought at domestic and abroad
[J].
西北地区植被覆盖变化及其与降水和气温的相关性
[J].
Changes of vegetation cover and its correlation with precipitation and temperature in Northwest China
[J].
1990—2010年中国土地覆被变化引起反照率改变的辐射强迫
[J].土地覆被变化通过改变地表反照率而影响地表辐射收支与能量平衡,从而对区域和全球气候产生影响。本文利用高时空分辨率遥感数据分析1990-2010 年中国土地覆被变化改变地表反照率的时空驱动机制,并计算全国50 个生态区地表反照率变化导致的年际尺度辐射强迫,揭示土地覆被变化在生态区尺度上影响气候变化的生物地球物理机制。结果表明:1990-2010 年全国土地覆被变化以耕地开垦、草地沙化、城市化等人类土地利用活动导致的土地覆被变化最为明显,全国草地与林地面积分别减少了0.60%和0.11%;建设用地和耕地面积分别增加了0.60%和0.19%。全国土地覆被变化通过改变地表反照率引起的平均辐射强迫为0.062 W/m<sup>2</sup>,表现为增温的气候效应,但在生态区尺度辐射强迫空间差异很大。京津唐城镇与农城郊农业生态区主要土地覆被变化为耕地转为建设用地,引起地表反照率降低了0.00456,产生0.863 W/m<sup>2</sup>的辐射强迫,表现为增温的气候效应;而三江平原温带湿润农业与湿地生态区主要的土地覆被变化为林草地转为耕地,引起地表反照率升高了0.00152,产生-0.184 W/m<sup>2</sup>的辐射强迫,表现为降温的气候效应。
Radiative forcing over China due to albedo change caused by land cover change during 1990—2010
[J].
西北地区植被耗水量的时空变化规律及其对气象干旱的响应
[J].
Spatiotemporal variation of vegetation water consumption and its response to meteorological drought in Northwest China
[J].
中国西北地区太阳总辐射的气候特征
[J].利用中国西北地区28个测站1961年-2003年1月-12月太阳总辐射资料,采用趋势分析、Mann-Kendall分析、相关分析、对比分析等方法,分析了43年来西北地区太阳总辐射的时空分布特征及其变化规律。结果表明:①西北地区太阳总辐射在(4300~7000)MJ/(m<sup>2</sup>·a)之间,从东南和西北向中部增加,高值区在青海高原。冬季总辐射最少,夏季最多,春季多于秋季;区域内总辐射表现出“愈多愈稳”的分布特征;②西北地区年总辐射以92.07 MJ/(m<sup>2</sup>·10a)的速率递减,1973年是突变点,北疆和西北地区东部的减少率最大,减少中心在吐鲁番和西宁;总辐射年、季变化相似,20世纪60年代-70年代偏多,80年代达到最小值,90年代以后有所增加但仍以偏少为主,这与全球的变化趋势一致;③青海高原的太阳总辐射呈双峰型分布,其余大多数地方为单峰型;④通过分析发现云量、相对湿度、降水等影响总辐射的地理分布,间接证明大气气溶胶含量的增加可能是总辐射下降的原因。
Climatic characteristics of gross solar radiation over Northwestern China
[J].With the trend analysis, Mann-Kendall and correlation analysis, the spatial and temporal distributions of gross solar radiation across Northwestern China were carefully examined using monthly mean data for the period 1961-2003 from 28 observational stations. It was shown that the gross solar radiation over the study region ranged roughly from 4300 to 7000 MJ/(m<sup>2</sup>·a). An increasing trend in the gross solar radiation from the southeast and the northwest to the middle regions was observed. Higher gross solar radiation values frequently occurred over the Qinghai plateau. As for the seasonality, the gross solar radiation in winter was the lowest, ranging from 185 to 400 MJ/m<sup>2</sup>. The gross solar radiation in summer was found highest, ranging from 540 to 750 MJ/m<sup>2</sup>. The gross solar radiation in spring falling between 400 and 685 MJ/m<sup>2</sup> was greater than that in autumn, with a range from 290 to 530 MJ/m<sup>2</sup>. In addition, higher temporal stability in the gross solar radiation frequently took place over the regions with greater gross solar radiation. In general, the gross solar radiation across Northwestern China decreased at a rate of approximately 92.07 MJ/(m<sup>2</sup>·10a), with an abrupt change in the year 1973. The decreasing rate was largest over northern Xinjiang and the east of the area, showing two lowest decreasing rates around Turfan in Xinjiang and Xining City in Qinghai. Inter-annual gross solar radiation trends appeared to be similar with seasonal trends. The gross solar radiation was larger during the period from the 1960s to the 1970s; however, it achieved a minimum magnitude in the 1980s. In the 1990s, it increased to certain degree but basically lay in a small magnitude. This trend seems to be consistent with global trends. The Qinghai plateau displayed two-peak spatial distribution of gross solar radiation, showing a peak in May and the other in July, and a minimum value in January or February. It was indicated that cloud cover, relative humidity and precipitation can primarily affect the gross solar radiation over space but were not responsible for the observed decreasing trends in gross solar radiation. It was stated that the temperature and the gross solar radiation showed similar variation trends, which would likely result from increases in aerosol content in the atmosphere.
2003—2012年中国地表太阳辐射时空变化及其影响因子
[J].
Change analysis of surface solar radiation in China from 2003 to 2012
[J].
基于MODIS数据的中国耕地时空变化及其影响因素
[J].
Spatio-temporal changes in cultivated land and their influencing factors in China based on MODIS data
[J].
Afforestation in China cools local land surface temperature
[J].
Land management and land-cover change have impacts of similar magnitude on surface temperature
[J].
Local cooling and warming effects of forests based on satellite observations
[J].
DOI:10.1038/ncomms7603
PMID:25824529
[本文引用: 1]
Li, Yan; Li, Shuangcheng Peking Univ, Coll Urban & Environm Sci, Beijing 100871, Peoples R China. Li, Yan; Kalnay, Eugenia Univ Maryland, Dept Atmospher & Ocean Sci, College Pk, MD 20742 USA. Li, Yan; Li, Shuangcheng Peking Univ, Minist Educ, Key Lab Earth Surface Proc, Beijing 100871, Peoples R China. Li, Yan; Motesharrei, Safa; Kalnay, Eugenia Univ Maryland, Inst Phys Sci & Technol, College Pk, MD 20742 USA. Zhao, Maosheng; Mu, Qiaozhen Univ Maryland, Dept Geog Sci, College Pk, MD 20742 USA. Motesharrei, Safa Univ Maryland, Dept Phys, College Pk, MD 20742 USA. Motesharrei, Safa Natl Socioenvironm Synth Ctr SESYNC, Annapolis, MD 21401 USA. Mu, Qiaozhen Univ Montana, Dept Ecosyst & Conservat Sci, Numer Terradynam Simulat Grp, Missoula, MT 59812 USA.
Influence of the sky radiance distribution on various formulations of the Earth surface albedo
[J].
The atmospheric radiation measurement (ARM) program:Programmatic background and design of the cloud and radiation test bed
[J].
太阳常数变化对冬季全球辐射强迫及气候影响的数值模拟研究
[J].
A modeling study of the response of radiative forcing and climate to solar constant variation in boreal winter
[J].
塔里木河流域2000—2014年地表覆盖动态变化监测
[J].
Dynamic change monitoring on surface cover in Tarim River Basin during 2000 to 2014
[J].
基于GEE平台的1990年以来北京市土地变化格局及驱动机制分析
[J].
DOI:10.11873/j.issn.1004-0323.2018.4.0573
[本文引用: 1]
针对传统的遥感影像解译速度缓慢、效率较低、人力物力需求量大等问题,基于谷歌地球引擎(Google Earth Engine,GEE)平台,利用Landsat TM/OLI遥感影像,采用分类回归树(Classification and Regression Tree,CART)方法,对1990~2016年北京市土地覆被/土地利用变化(LUCC,Land Use and Land Cover Change)开展了遥感解译研究,分析了北京市土地覆被/土地利用时空动态变化特征和耕地、人造地表面积变化的驱动机制。研究表明:①GEE在区域尺度遥感数据分析和处理等方面具有方便快捷的优势。②CART方法进行遥感分类精度较高,研究所得的6期土地覆被/利用数据产品与训练样本交叉验证的学习精度均在93%以上,方法可靠有效。2010年的分类产品与测试样本混淆矩阵的验证精度为88.67%,Kappa系数为0.86。2010年的分类产品与GlobeLand30\|2010数据的空间一致性为74.0%,其中林地一致性高达84.28%;两套产品中,人造地表、草地和水体面积比重相差不足1%,各地类面积构成一致性较高。③北京市主要土地类型为耕地、林地和人造地表,面积比重为90%左右;1990~2016年期间人造地表和林地面积呈增加态势,耕地和水体呈萎缩态势,其中,人造地表面积增加1 371 km<sup>2</sup>,增幅高达87%以上,耕地萎缩幅度近40%;1990~2016年北京市平原地区人造地表由圈层状的“摊大饼”扩张态势向“遍地开花”扩张态势转变;人造地表的扩张主要通过对耕地的侵占实现。人口快速增长、经济快速发展以及政策等社会经济发展因素驱动北京市土地覆被/土地利用的演化进程。
Land change patterns and driving mechanism in Beijing since 1990 based on GEE platform
[J].
中国西北地区太阳辐射时空分异特征
[J].
DOI:10.13866/j.azr.2023.06.02
[本文引用: 1]
应用近60 a中国西北169个国家基本气象站气象观测资料,对中国西北总辐射的时域变化、空间分布和次区域时空演变特征进行了研究。结果表明:(1) 青海西北部的柴达木盆地和甘肃西部为太阳能资源最丰富区,陕西南部和甘肃东南部的较小区域为资源丰富区,其余大面积区域均为资源很丰富区。(2) 1961—2020年除新疆西南部、甘肃和新疆接壤区、甘肃北部和陕西北部的小范围区域总辐射呈上升趋势外,西北大部分区域总辐射呈下降趋势。(3) EOF第一模态特征向量场表明,总辐射振荡强度由西向东加强,各分量高载荷区主要集中于中东部,该区域是总辐射易出现异常、振荡强且敏感的地区。(4) EOF第二模态特征向量场自西向东呈双偶极子型;青海全境和甘肃大部为正值区域,也是总辐射异常振荡最强的区域。(5) 依据REOF特征向量不同模态空间分异结构类型,可将研究区域划分为主要受东亚季风影响的“西北东部异常型”、主要受东亚季风影响边缘区的“西北中部异常型”和主要受西风带影响的“西北西部异常型”等 3个次区域。3个次区域总辐射减少的突变点分别出现在1973年、2017年和2008年。
Anomaly temporal-spatial distribution of solar radiation in Northwest China
[J].
DOI:10.13866/j.azr.2023.06.02
[本文引用: 1]
The temporal variation, spatial distribution, and temporal and spatial evolution characteristics of the total radiation in Northwest China were studied using meteorological observation data from 169 national meteorological stations in Northwest China, over the past 60 years. The Qaidam Basin in the Northwest of Qinghai and the west of Gansu were the most abundant areas for solar energy resources, the smaller areas in the south of Shaanxi and the southeast of Gansu were found to be resource rich areas, and the other large areas are resource rich areas. From 1961 to 2020, the total radiation showed an upward trend in Southwest Xinjiang, the border area between Gansu and Xinjiang, and smaller areas in northern Gansu and northern Shaanxi, while the total radiation showed a downward trend in most regions of Northwest China. The eigenvector field of EOF mode 1 shows that the total radiation oscillation intensifies from west to east, and the high load area for each component is mainly concentrated in the middle and east, which is the region where the total radiation is prone to be abnormal and the oscillation is strong and sensitive. The eigenvector field of the second EOF mode presents a dipole type from west to east. Qinghai and most of the Gansu are positive regions, which are also the regions with the strongest total radiation and abnormal oscillation. According to the different modal spatial differentiation structure types for the REOF eigenvectors, the study area can be divided into three sub regions, namely: “Eastern northwest anomaly type” which is affected by the East Asian monsoon; “Central northwest anomaly type” which is the marginal region and mainly affected by the East Asian monsoon; and “Western Northwest anomaly type” which is mainly affected by the westerlies. The mutation points for total radiation reduction in the three subregions occurred in 1973, 2017, and 2008 respectively.
基于主被动遥感技术的地表覆被类型变化检测方法——以新疆西天山国家级自然保护区为例
[J].
Detection method of surface cover type change based on active and passive remote sensing technology:A case study of the west Tianshan national nature reserve in Xinjiang
[J].
基于GIS分析的西北地区土地利用与景观格局演变研究——以甘肃省兰州市为例
[J].
Study on the evolution of land use and landscape pattern in northwest China Based on GIS:Taking Lanzhou City of Gansu Province as an example
[J].
锡林郭勒草原近30年草地退化的变化特征及其驱动因素分析
[J].
Temporal and spatial pattern of grassland degradation and its determinants for recent 30 years in Xilingol
[J].
