0 引言
图像融合最早始于20世纪70年代,发展至今,已成为多源遥感数据处理的主要手段[1 ] 。全色锐化作为遥感数字图像融合的主要方法,是将低空间分辨率多光谱遥感图像与高空间分辨率的全色图像进行融合,生成高空间分辨率的多光谱图像的过程。其锐化融合结果可以大大提高后续遥感图像解译与处理精度,在地物识别、变化检测、图像分类等遥感图像处理中有较高的应用需求[2 ⇓ -4 ] 。
目前,遥感图像全色锐化方法大致可分为2类: 成分替换方法和多分辨率分解方法[5 ] 。成分替换方法是将多光谱图像变换到另一个空间,分离出光谱特征和纹理细节特征,并采用全色图像替换多光谱细节特征,再逆变换回到初始空间。成分替换方法主要有: IHS变换[6 ] 、Brovey法[7 ] 、主成分变换(principal component analysis,PCA)[8 ] 以及Gram-Schmidt法[9 ] 等。成分替换方法简单易行,细节保持较好,但光谱扭曲较大。多分辨率分解方法是先采用多尺度分析对多源遥感图像进行分解,再将分解后的子带信息在多方向以及多分辨率下进行融合,最后再通过重构得到融合后的高质量图像。常见的多分辨率分解方法有非下采样剪切波变换法(nonsubsampled shearlet transform, NSST)[10 ] 、基于平滑滤波器的强度调制法(smoothing filter-based intensity modulation, SFIM) [7 ] 、高通滤波法(high pass filter, HPF) [7 ] 、金字塔变换[11 ] 、轮廓波变换[12 ] 、剪切波变换[13 ] 、非下采样轮廓波变换(nonsubsampled contourlet transform, NSCT)[14 -15 ] 等。多分辨率分解方法光谱扭曲小,但计算量较大、细节保持不足。
为了解决遥感图像全色锐化中单一的NSCT变换细节保持不足,且容易产生“虚影”等问题,本文结合NSCT与引导滤波(guided filter, GF)变换特性,提出了一种新的全色锐化算法。该算法首先利用NSCT变换将全色图像与多光谱图像的低频分量与高频分量分离出来,通过NSCT分解重构,分别提取多光谱图像和全色图像的细节信息; 然后将多光谱图像细节信息和全色图像细节信息输入到GF中,得到具有全色信息的多光谱新的细节分量; 接着将经过NSCT重构的多光谱细节分量减去经过GF的多光谱细节分量得到新的细节分量,与全色图像细节信息相加得到总细节信息; 最后将总细节信息注入到多光谱图像中获得全色锐化结果。
1 研究方法
1.1 NSCT变换与GF滤波原理
1.1.1 NSCT变换
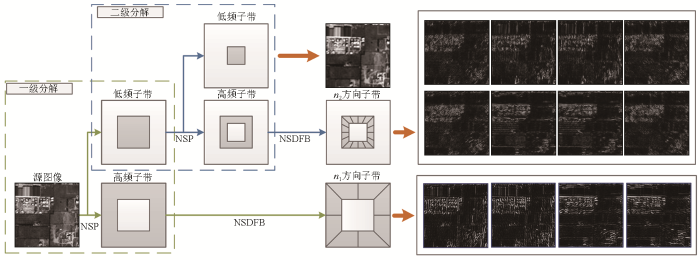
Cunha等[16 ] 根据非下采样小波变换原理,在轮廓波变换对图像分解处理的基础上,提出了NSCT变换的概念。NSCT变换首先由非下采样金字塔(nonsubsampled pyramid, NSP)滤波器组对图像进行多分辨率分解,然后采用非下采样方向滤波器组(nonsubsampled direction filter bank, NSDFB)对多尺度分解得到的高频子带进行多方向分解,以2层分解、各层方向分解数为n 1 和n 2 为例,NSCT分解示意图如图1 所示。
图1
图1
NSCT二级分解示意图
Fig.1
Schematic diagram of NSCT secondary decomposition
1.1.2 GF原理
GF技术是He等[17 -18 ] 在解决图像去雾问题中所提出的一种滤波方法,该方法滤波结果边缘保持性较好,且能够将引导图像的特征注入到输入图像中。若规定引导图像为G ,输出图像为O ,则GF的数学表达为:
(1) O k = a q G k + b q ∀ k ∈ w q
式中: aq 和bq 为引导图像G 当窗口中心位于q 时的线性变换系数; q 和k 为图像像素的索引; ωq 为引导图像G 中以q 为中心,大小为(2R +1)×(2R +1)的窗口,R 设置为5。
将输入图像I 和输出图像O 之间的线性方程转换成求取最优参数问题,则线性系数aq 和bq 可以表示为:
(2) E ( a q , b q ) = ∑ k ∈ ω q ( a q G k + b q - I q ) 2 + ε a q 2
(3) a q = 1 ω ∑ k ∈ ω q G q I q - μ q I q ¯ σ q 2 + ε
(4) b q = I q ¯ - a q μ q
式中: μq 和σ q 2 G 在窗口ωq 中的均值和方差; I q ¯ I 在ωq 中的均值; |ω |为ω 窗口内的总像素个数。
1.2 结合NSCT与GF的全色锐化算法
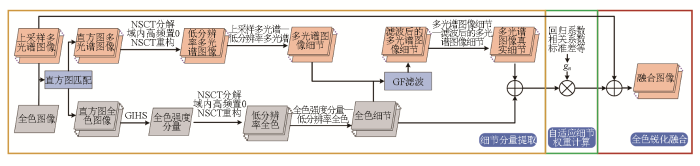
本文提出一种结合NSCT变换和GF滤波的遥感图像全色锐化算法。该算法主要由细节分量提取模块、自适应细节权重计算模块和全色锐化融合模块组成,算法流程框图如图2 所示。该算法利用广义IHS(generalized intensity-hue-saturation, GIHS)变换提取直方图匹配后的全色图像强度分量,并使用NSCT获取插值后的多光谱图像的第n 个波段MSUn 和全色图像强度分量各自的细节分量; 随后,通过GF滤波,将全色图像细节分量作为引导图像,引导MSUn 图像细节分量来计算多光谱图像的真正细节信息,再加上全色图像细节分量来获得总细节信息; 最后,对MSUn 图像各波段自适应注入总细节信息,按照多分辨率分析法进行全色锐化融合,得到高空间分辨率的多光谱图像。
图2
图2
本文全色锐化算法流程
Fig.2
Flow chart of the proposed pansharpening algorithm
1.2.1 细节分量提取
为了下文表述方便,定义上采样的多光谱图像为MSU ,n 为第n 波段,直方图匹配后的多光谱图像为MSH ,低分辨率的多光谱图像为MSL ,提取到的多光谱细节为MSD ,经过GF得到多光谱图像为MSG ,融合图像为MSO ; 提取到多光谱图像中的真正细节为M ,直方图匹配后的全色图像为PANH ,全色图像的强度分量为PANI ,低分辨率的全色图像为PANL ,提取的全色细节为PAND 。
在细节分量提取中,使用NSCT提取直方图匹配后的多光谱图像和全色图像的细节信息,进而通过GF引导获得总细节分量信息,具体步骤如下:
1)将与MSUn 图像直方图匹配后的全色图像进行GIHS变换,提取PANI ;
2)对MSHn 图像的每个波段均进行NSCT分解,并将所有高频系数置0。随后经过NSCT重构得到MSHn 图像各波段的低频强度分量MSLn ,用MSUn 图像减去MSLn ,得到多光谱图像的细节信息MSDn ;
3)对PANI 进行NSCT分解,将域内的高频系数全部置0,重构系数得到低频强度分量PANL ,用PANI 减去PANL 得到全色图像细节信息PAND ;
4)使用GF,将PAND 作为引导图像,MSDn 作为输入图像,得到输出图像MSGn ;
5)最后云计算得到第n 个波段的最终细节分量Dn ,计算公式为:
(5) D n = P A N D + ( M S D n - M S G n )
1.2.2 自适应细节权重计算
由于多光谱图像每个波段光谱信息存在差异,统一为MSUn 图像注入相同强度细节分量势必会导致融合图像产生较大的光谱失真。为此,本文采用自适应细节权重,为每个波段注入不同强度的细节分量[19 ] 。规定n 为第n 个波段,N 为多光谱图像的总波段数; r 为多光谱图像与全色图像的空间分辨率比值; Xl 为将X 图像先下采样1/r ,再上采样r 倍得到的低通图像。则细节权重gn 的数学描述如式(6)—(11)所示。
(6) P A N L = α 0 + ∑ n = 1 N α n M H n
式中: MHn 为[M ×N ,L +1]的矩阵,其中M ,N 和L 分别为MSUn 的行数、列数和波段数; MHn 的第1列全为1,后4列是将MSHn 进行形状变换得到的矩阵。
利用式(6)求回归系数α ,α =[α 0 ,α 1 ,…,αn ]。
(7) I 1 = M H n × α
(8) I n = c o r r ( M S H n , I 1 ) × P A N + 1 c o r r ( M S H n , I 1 ) ] × M S H n
式中: corr ()为相关系数; PAN 为原始全色图像。将In 进行下采样1/r ,再上采样r 倍,得到低分辨率的亮度分量Iln ,从而计算gn ,公式为:
(9) β = r e g r e e ( I l n , M S H n )
(10) I P n = M H n × β
(11) g n = 0.95 × c o r r ( I P n , M S H n ) × s t d ( M S H n ) 1 N ∑ n = 1 N s t d ( M S H n )
式中: regree (A ,B )为A 与B 的回归系数; corr (A ,B )为A 与B 的相关系数; std (A )为A 的标准差; MSHn 为直方图匹配后的多光谱图像。
1.2.3 全色锐化融合
由前面计算得到的强度分量细节信息,对MSUn 图像各波段自适应注入高分强度分量细节信息,按照多分辨率分析法进行全色锐化融合,得到高空间分辨率的多光谱图像,从而计算锐化融合结果MSOn ,公式为:
(12) M S O n = M S U n + g n × D n n = 1,2 , … , N
1.3 评价指标
除了采用主观评价方式对图像融合效果进行主观评判以外,论文还选用了光谱扭曲度D λ 、空间细节失真度D s 、无参考指标(quality with no reference, QNR)、四元数指标(Q4)、相对全局综合误差(relative dimensionless global error in synthesis, ERGAS)、光谱映射角(spectral angle mapper, SAM)、广义图像质量指标(universal image quality index, UIQI)和相关系数(correlation coefficient, CC)共8种客观评价指标[20 ] 对图像融合效果进行客观评价,其中D λ ,D s 和QNR属于在全分辨率融合下的评价指标,Q4,ERGAS,SAM,UIQI和CC属于按照wald协议[21 ] ,将原始多光谱图像作为参考图像,将原始多光谱图像和全色图像都进行下采样后,降分辨率融合下的评价指标。
Q 4指标用来衡量融合图像的光谱变形程度,其值越大说明融合图像的光谱扭曲越小,最优值为1。Q 4指标公式为:
(13) Q 4 = 4 | σ x y | x - y - / ( σ x 2 + σ y 2 ) ( x - 2 y - 2 )
式中: x 和y 为分别为融合图像与参考图像的四元数; σ
光谱扭曲度D λ 、空间细节失真度D s 和综合评价索引QNR的计算公式为:
(14) D λ = 1 N ( N - 1 ) ∑ i = 1 N ∑ j = 1 , j ≠ i N | Q 4 ( F i , F j ) - Q 4 ( f i , f j ) | p p
(15) D s = 1 N ∑ i = 1 N | Q 4 ( F i , P ) - Q 4 ( f i , P L ) | q q
(16) Q N R = ( 1 - D λ ) α ( 1 - D s ) β
式中: f 和F 分别为低空间分辨率的多光谱图像和高空间分辨率的融合图像; Q 4( )为Q 4指标; i 和j 为波段序号; N 为多光谱图像的总波段数; P 为全色图像; PL 为通过低通滤波得到的低分辨率全色图像; p =q =1; α 和β 为控制D λ 和D s 的2个常数,文中都设置为1。D λ 和D s 的最优值为0,QNR 的最佳值为1。
SAM是最常用的光谱差异测量方法,SAM值越小,表示参考图像与融合图像之间的光谱相似性越大。SAM的公式为:
(17) S A M = 1 N ∑ i = 1 N a r c c o s ( f i , F i ‖ f i ‖ · ‖ F i ‖ )
式中: 符号< >为内积; 符号‖‖为范数; i 为波段; N 为图像总波段数; f 和F 分别为多光谱图像和融合图像。
ERGAS用来衡量融合图像的光谱失真程度,值越小越好,其计算公式为:
(18) E R G A S = 100 c 1 N ∑ i = 1 N R M S E i 2 μ i 2
式中: RMSEi 为融合后的图像与参考标准图像第i 个波段的均方根误差; c 为多光谱图像与全色图像的空间分辨率的比值; μi 为融合后的图像第i 个波段的均值。
UIQI是衡量融合影像与参考影像间的亮度和对比度之间的相似性,通过滑动窗口进行计算,最后在所有窗口和所有波段上取平均值得到。UIQI值越大,融合质量越好,最佳值是1。计算公式为:
(19) U I Q I = σ F , f σ F σ f × 2 μ F μ f μ F 2 + μ f 2 × 2 σ F σ f σ F 2 + σ f 2
CC表示了2幅影像间的空间相关性,可以衡量融合影像的几何失真情况,值越大说明失真越小,其计算公式为:
(20) C C = 1 N ∑ i = 1 N C C S ( F i , f i )
(21) C C S ( U , V ) = ∑ h = 1 H ∑ w = 1 W ( U h w - μ U ) ( V h w - μ V ) ∑ h = 1 H ∑ w = 1 W ( U h w - μ U ) 2 ( V h w - μ V ) 2
式中: U 和V 为单波段影像; H 和W 为图像的总行数和总列数; h 和w 为行号和列号。
2 实验与分析
2.1 实验数据
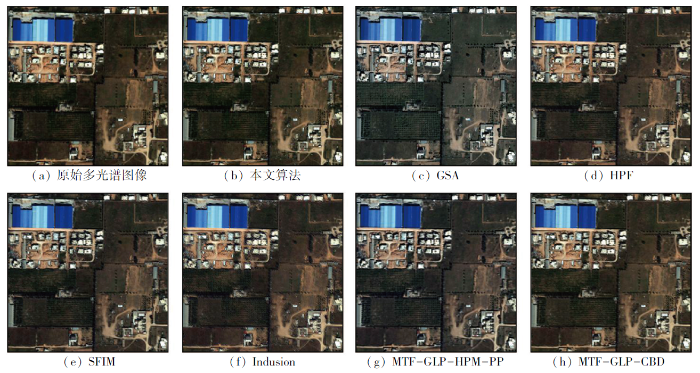
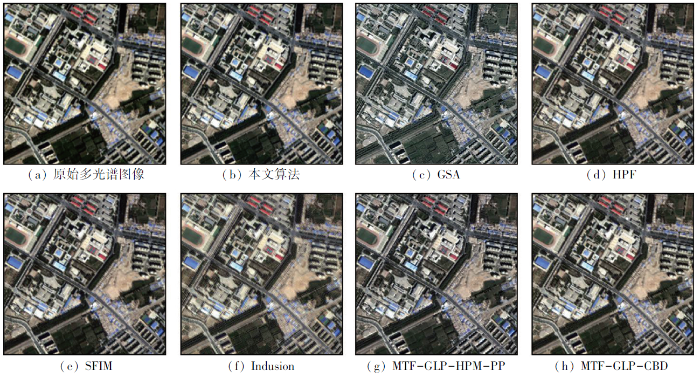
为验证本文所提出算法的有效性,论文采用2组高分遥感数据集进行仿真验证。第一组数据采用的是WorldView-2遥感卫星采集的农田区域,其中全色图像和多光谱图像大小分别为1 024×1 024和256×256×4,多光谱图像的空间分辨率为2 m,全色图像的空间分辨率为0.5 m。第二组数据选取GF-2遥感卫星获取的敦煌市城镇地区,全色图像和多光谱图像大小与第一组数据集一致,多光谱图像和全色图像的空间分辨率分别为3.44 m和0.86 m。
另外,开展了本文方法与GSA[22 ] ,HPF[23 ] ,SFIM[23 ] ,Indusion[24 ] ,MTF-GLP-HPM-PP[7 ] 和MTF-GLP-CBD[7 ] 这6种经典遥感图像融合算法对比实验。文中所有实验以及相关代码均在MATLAB软件下开展,NSCT分解级数为3级,从“细”到“粗”分解的方向子带数分别为8,8,16; GF中的滤波窗口大小R 设置为5,归一化因子ε 为0.01。
2.2 融合结果
图3 所示为采用WorldView-2的7种算法融合实验对比结果。从主观上来看,其他6种对比融合算法均获得了较好的融合结果,但与本文算法相比,仍存在一定的差异。从融合图像的光谱扭曲来看,GSA方法和MTF-GLP-HPM-PP法融合图像光谱扭曲最大,在农田和道路区域较为明显; SFIM法和HPF法在边缘处可以看出融合结果存在重影现象; 本文所提算法的融合结果对多光谱图像光谱保真上明显优于GSA,SFIM,Indusion和MTF-GLP-HPM-PP图像融合算法。从融合图像的空间细节注入程度来看,本文算法相较于HPF,SFIM和Indusion等多分辨率分析法,对比度更好,且地物更加准确、清晰。
图3
图3
WV-2数据集全色锐化结果
Fig.3
Pansharpening results of WV-2 dataset
图4 所示为GF-2数据集的融合结果。从图中可以看出GSA和MTF-GLP-HPM-PP法融合图像在右下角绿地区域颜色较浅, GSA融合图像的左上角房屋颜色偏深,操场颜色偏浅,均出现光谱较大失真; Indusion融合影像有明显的模糊重影现象; 而HPF,SFIM,MTF-GLP-CBD和本文算法融合影像颜色自然,纹理丰富。
图4
图4
GF-2数据集全色锐化结果
Fig.4
Pansharpening results of GF-2 dataset
2.3 指标评价结果
表1 和表2 所示为本文算法与其他6种融合对比方法的客观评价结果,几种算法的指标最优值在表中以加粗表示。从表1 和表2 可以看出,本文算法的融合指标精度均优于其他经典融合算法。由于综合考虑了多光谱图像和全色图像中的细节,本文方法在图像纹理细节保持、光谱保真、与参考标准图像相关性评价等方面,相较传统锐化融合算法有较大的提高。因此,主观与客观2种图像融合效果评判验证了本文算法的有效性和可行性。
3 结论
论文提出了一种结合NSCT与GF的新的全色锐化算法。通过NSCT的多尺度多方向的小波分解与重构特性,分别提取多光谱图像和全色图像的细节分量,并结合GF计算出多光谱图像中真正的细节,将全色图像细节与多光谱图像细节相加得到总的细节信息,随后将总细节信息自适应注入多光谱图像进而获得具有高空-谱分辨率信息的多光谱融合图像。实验结果表明,提出的全色锐化算法可以解决由于传统NSCT变换导致融合中原图像损失较多的细节信息的问题,提升了多分辨率遥感图像融合精度与质量。从多个数据集的主、客观评价实验,验证了本文算法有效性。
但随着遥感数据量的迅猛增长,传统的多分辨率分析法已经不能满足大规模的数据融合。基于深度学习的融合方法已经崛起,且取得了不错的成果,下一步团队将通过深度学习来融合图像的特征并优化融合任务。
参考文献
View Option
[1]
Hu J Hu P Wang Z et al . Spatial dynamic selection network for remote-sensing image fusion
[J]. IEEE Geoscience and Remote Sensing Letters , 2021 ,19:8013205.
[本文引用: 1]
[2]
Cao S Y Hu X J Dynamic prediction of urban landscape pattern based on remote sensing image fusion
[J]. International Journal of Environmental Technology and Management , 2021 , 24 (1/2 ):18 .
[本文引用: 1]
[3]
Xu J Luo C Chen X et al . Remote sensing change detection based on multidirectional adaptive feature fusion and perceptual similarity
[J]. Remote Sensing , 2021 , 13 (15 ):3053 .
[本文引用: 1]
[4]
Li H Song D Liu Y et al . Automatic pavement crack detection by multi-scale image fusion
[J]. IEEE Transactions on Intelligent Transportation Systems , 2019 , 20 (6 ):2025 -2036 .
[本文引用: 1]
[5]
盖钧飞 , 李小军 , 赵鹤婷 , 等 . 结合脉冲耦合神经网络的自适应全色锐化算法
[J]. 测绘科学 , 2023 , 48 (1 ):60 -69 .
[本文引用: 1]
Ge J F Li X J Zhao H T et al . Adaptive panchromatic sharpening algorithm with pulse coupled neural network
[J]. Science of Surveying and Mapping , 2023 , 48 (1 ):60 -69 .
[本文引用: 1]
[6]
Wady S M A Bentoutou Y Bengermikh A et al . A new IHS and wavelet based pansharpening algorithm for high spatial resolution satellite imagery
[J]. Advances in Space Research , 2020 , 66 (7 ):1507 -1521 .
[本文引用: 1]
[7]
Dadrass Javan F Samadzadegan F Mehravar S et al . A review of image fusion techniques for pan-sharpening of high-resolution satellite imagery
[J]. ISPRS Journal of Photogrammetry and Remote Sensing , 2021 ,171:101 -117 .
[本文引用: 5]
[8]
Wu Z Huang Y Zhang K Remote sensing image fusion method based on PCA and curvelet transform
[J]. Journal of the Indian Society of Remote Sensing , 2018 , 46 (5 ):687 -695 .
[本文引用: 1]
[9]
张涛 , 刘军 , 杨可明 , 等 . 结合Gram-Schmidt变换的高光谱影像谐波分析融合算法
[J]. 测绘学报 , 2015 , 44 (9 ):1042 -1047 .
DOI:10.11947/j.AGCS.2015.20140637
[本文引用: 1]
针对高光谱影像谐波分析融合(HAF)算法在影像融合时不顾及地物光谱曲线整体反射率这一缺陷,提出了结合Gram-Schmidt变换的高光谱影像谐波分析融合(GSHAF)改进算法。GSHAF算法可在完全保留融合前后像元光谱曲线波形形态的基础上,将高光谱影像融合简化为各像元光谱曲线的谐波余相组成的二维影像与高空间分辨率影像之间的融合。它是在原始高光谱影像光谱曲线被谐波分解为谐波余项、振幅和相位后,首先将其谐波余项与高空间分辨率影像进行GS变换融合,这样便可有效地修正融合后像元光谱曲线的反射率特征,随后再利用该融合影像与谐波振幅、相位进行谐波逆变换,完成高光谱影像谐波融合。本文最后利用Hyperion高光谱遥感影像与ALI高空间分辨率影像对GSHAF算法进行可行性分析,再以HJ-1A等卫星数据对其进行普适性验证,试验结果表明,GSHAF算法不仅可以完全地保留光谱曲线波形形态,而且融合后影像的地物光谱曲线反射率更接近真实地物。
Zhang T Liu J Yang K M et al . Fusion algorithm for hyperspectral remote sensing image combined with harmonic analysis and gram-schmidt transform
[J]. Acta Geodaetica et Cartographica Sinica , 2015 , 44 (9 ):1042 -1047 .
DOI:10.11947/j.AGCS.2015.20140637
[本文引用: 1]
For the defect that harmonic analysis algorithm for hyperspectral image fusion(HAF) in image fusion regardless of spectral reflectance curves, the improved fusion algorithm for hyperspectral remote sensing image combined with harmonic analysis and Gram-Schmidt transform(GSHAF) is proposed in this paper. On the basis of completely retaining waveform of spectrum curve of fused image pixel, GSHAF algorithm can simplify hyperspectral image fusion to between the two-dimensional image by harmonic residual of each pixel spectral curve and high spatial resolution image. It is that the spectral curve of original hyperspectral image can be decomposed into harmonic residual, amplitude and phase, then GS transform with harmonic residual and high spatial resolution image, which can effectively amend spectral reflectance curve of fused image pixel. At last, this fusion image, harmonic amplitude and harmonic phase are inverse harmonic transformed. Finally, with Hyperion hyperspectral remote sensing image and ALI high spatial resolution image to analysis feasibility for GSHAF, then with HJ-1A and other satellite data to verify universality. The result shows that the GSHAF algorithm can not only completely retained the waveform of spectral curve, but also maked spectral reflectance curves of fused image more close to real situation.
[10]
吴一全 , 王志来 . 混沌蜂群优化的NSST域多光谱与全色图像融合
[J]. 遥感学报 , 2017 , 21 (4 ):549 -557 .
[本文引用: 1]
Wu Y Q Wang Z L Multispectral and panchromatic image fusion using chaotic Bee Colony optimization in NSST domain
[J]. Journal of Remote Sensing , 2017 , 21 (4 ):549 -557 .
[本文引用: 1]
[11]
Jin H Wang Y A fusion method for visible and infrared images based on contrast pyramid with teaching learning based optimization
[J]. Infrared Physics & Technology , 2014 ,64:134 -142 .
[本文引用: 1]
[12]
Do M N Vetterli M The contourlet transform:An efficient directional multiresolution image representation
[J]. IEEE Transactions on Image Processing:A Publication of the IEEE Signal Processing Society , 2005 , 14 (12 ):2091 -2106 .
[本文引用: 1]
[13]
Lim W Q The discrete shearlet transform:A new directional transform and compactly supported shearlet frames
[J]. IEEE Transactions on Image Processing:a Publication of the IEEE Signal Processing Society , 2010 , 19 (5 ):1166 -1180 .
[本文引用: 1]
[14]
Singh H Cristobal G Blanco S et al . Nonsubsampled contourlet transform based tone-mapping operator to optimize the dynamic range of diatom shells
[J]. Microscopy Research and Technique , 2021 , 84 (9 ):2034 -2045 .
[本文引用: 1]
[15]
徐欣钰 , 李小军 , 赵鹤婷 , 等 . NSCT和PCNN相结合的遥感图像全色锐化算法
[J/OL]. 自然资源遥感 ,[2023-09-18 ].http://kns.cnki.net/kcms/detail/10.1759.P.20221102.1831.020.html.
URL
[本文引用: 1]
Xu X Y Li X J Zhao H T et al . Pansharpening algorithm of remote sensing images based on by combining NSCT and PCNN
[J]. Remote Sensing for Natural Resources .[2023-09-18].http://kns.cnki.net/kcms/detail/10.1759.P.20221102.1831.020.html.
URL
[本文引用: 1]
[16]
Cunha A L Zhou J Do M N The nonsubsampled contourlet transform:Theory,design,and applications
[J]. IEEE Transactions on Image Processing:A Publication of the IEEE Signal Processing Society , 2006 , 15 (10 ):3089 -3101 .
[本文引用: 1]
[17]
He K Sun J Tang X Single image haze removal using dark channel prior
[J]. IEEE Transactions on Pattern Analysis and Machine Intelligence , 2011 , 33 (12 ):2341 -2353 .
DOI:10.1109/TPAMI.2010.168
PMID:20820075
[本文引用: 1]
In this paper, we propose a simple but effective image prior-dark channel prior to remove haze from a single input image. The dark channel prior is a kind of statistics of outdoor haze-free images. It is based on a key observation-most local patches in outdoor haze-free images contain some pixels whose intensity is very low in at least one color channel. Using this prior with the haze imaging model, we can directly estimate the thickness of the haze and recover a high-quality haze-free image. Results on a variety of hazy images demonstrate the power of the proposed prior. Moreover, a high-quality depth map can also be obtained as a byproduct of haze removal.
[18]
He K Sun J Tang X Guided image filtering
[J]. IEEE Transactions on Pattern Analysis and Machine Intelligence , 2013 , 35 (6 ):1397 -1409 .
DOI:10.1109/TPAMI.2012.213
PMID:23599054
[本文引用: 1]
In this paper, we propose a novel explicit image filter called guided filter. Derived from a local linear model, the guided filter computes the filtering output by considering the content of a guidance image, which can be the input image itself or another different image. The guided filter can be used as an edge-preserving smoothing operator like the popular bilateral filter [1], but it has better behaviors near edges. The guided filter is also a more generic concept beyond smoothing: It can transfer the structures of the guidance image to the filtering output, enabling new filtering applications like dehazing and guided feathering. Moreover, the guided filter naturally has a fast and nonapproximate linear time algorithm, regardless of the kernel size and the intensity range. Currently, it is one of the fastest edge-preserving filters. Experiments show that the guided filter is both effective and efficient in a great variety of computer vision and computer graphics applications, including edge-aware smoothing, detail enhancement, HDR compression, image matting/feathering, dehazing, joint upsampling, etc.
[19]
Choi J Yu K Kim Y A new adaptive component-substitution-based satellite image fusion by using partial replacement
[J]. IEEE Transactions on Geoscience and Remote Sensing , 2011 , 49 (1 ):295 -309 .
[本文引用: 1]
[20]
张立福 , 彭明媛 , 孙雪剑 , 等 . 遥感数据融合研究进展与文献定量分析(1992-2018)
[J]. 遥感学报 , 2019 , 23 (4 ):603 -619 .
[本文引用: 1]
Zhang L F Peng M Y Sun X J et al . Progress and bibliometric analysis of remote sensing data fusion methods(1992-2018)
[J]. Journal of Remote Sensing , 2019 , 23 (4 ):603 -619 .
[本文引用: 1]
[21]
Wald L Ranchin T Mangolini M Fusion of satellite images of different spatial resolutions:Assessing the quality of resulting images
[J]. Photogrammetric Engineering and Remote Sensing , 1997 , 63 (6 ):691 -699 .
[本文引用: 1]
[22]
Aiazzi B Baronti S Selva M Improving component substitution pansharpening through multivariate regression of MS+Pan data
[J]. IEEE Transactions on Geoscience and Remote Sensing , 2007 , 45 (10 ):3230 -3239 .
[本文引用: 1]
[23]
Vivone G Dalla Mura M Garzelli A et al . A new benchmark based on recent advances in multispectral pansharpening:Revisiting pansharpening with classical and emerging pansharpening methods
[J]. IEEE Geoscience and Remote Sensing Magazine , 2021 , 9 (1 ):53 -81 .
[本文引用: 2]
[24]
Vivone G Alparone L Chanussot J et al . A critical comparison among pansharpening algorithms
[J]. IEEE Transactions on Geoscience and Remote Sensing , 2015 , 53 (5 ):2565 -2586 .
[本文引用: 1]
Spatial dynamic selection network for remote-sensing image fusion
1
2021
... 图像融合最早始于20世纪70年代,发展至今,已成为多源遥感数据处理的主要手段[1 ] .全色锐化作为遥感数字图像融合的主要方法,是将低空间分辨率多光谱遥感图像与高空间分辨率的全色图像进行融合,生成高空间分辨率的多光谱图像的过程.其锐化融合结果可以大大提高后续遥感图像解译与处理精度,在地物识别、变化检测、图像分类等遥感图像处理中有较高的应用需求[2 ⇓ -4 ] . ...
Dynamic prediction of urban landscape pattern based on remote sensing image fusion
1
2021
... 图像融合最早始于20世纪70年代,发展至今,已成为多源遥感数据处理的主要手段[1 ] .全色锐化作为遥感数字图像融合的主要方法,是将低空间分辨率多光谱遥感图像与高空间分辨率的全色图像进行融合,生成高空间分辨率的多光谱图像的过程.其锐化融合结果可以大大提高后续遥感图像解译与处理精度,在地物识别、变化检测、图像分类等遥感图像处理中有较高的应用需求[2 ⇓ -4 ] . ...
Remote sensing change detection based on multidirectional adaptive feature fusion and perceptual similarity
1
2021
... 图像融合最早始于20世纪70年代,发展至今,已成为多源遥感数据处理的主要手段[1 ] .全色锐化作为遥感数字图像融合的主要方法,是将低空间分辨率多光谱遥感图像与高空间分辨率的全色图像进行融合,生成高空间分辨率的多光谱图像的过程.其锐化融合结果可以大大提高后续遥感图像解译与处理精度,在地物识别、变化检测、图像分类等遥感图像处理中有较高的应用需求[2 ⇓ -4 ] . ...
Automatic pavement crack detection by multi-scale image fusion
1
2019
... 图像融合最早始于20世纪70年代,发展至今,已成为多源遥感数据处理的主要手段[1 ] .全色锐化作为遥感数字图像融合的主要方法,是将低空间分辨率多光谱遥感图像与高空间分辨率的全色图像进行融合,生成高空间分辨率的多光谱图像的过程.其锐化融合结果可以大大提高后续遥感图像解译与处理精度,在地物识别、变化检测、图像分类等遥感图像处理中有较高的应用需求[2 ⇓ -4 ] . ...
结合脉冲耦合神经网络的自适应全色锐化算法
1
2023
... 目前,遥感图像全色锐化方法大致可分为2类: 成分替换方法和多分辨率分解方法[5 ] .成分替换方法是将多光谱图像变换到另一个空间,分离出光谱特征和纹理细节特征,并采用全色图像替换多光谱细节特征,再逆变换回到初始空间.成分替换方法主要有: IHS变换[6 ] 、Brovey法[7 ] 、主成分变换(principal component analysis,PCA)[8 ] 以及Gram-Schmidt法[9 ] 等.成分替换方法简单易行,细节保持较好,但光谱扭曲较大.多分辨率分解方法是先采用多尺度分析对多源遥感图像进行分解,再将分解后的子带信息在多方向以及多分辨率下进行融合,最后再通过重构得到融合后的高质量图像.常见的多分辨率分解方法有非下采样剪切波变换法(nonsubsampled shearlet transform, NSST)[10 ] 、基于平滑滤波器的强度调制法(smoothing filter-based intensity modulation, SFIM) [7 ] 、高通滤波法(high pass filter, HPF) [7 ] 、金字塔变换[11 ] 、轮廓波变换[12 ] 、剪切波变换[13 ] 、非下采样轮廓波变换(nonsubsampled contourlet transform, NSCT)[14 -15 ] 等.多分辨率分解方法光谱扭曲小,但计算量较大、细节保持不足. ...
A new IHS and wavelet based pansharpening algorithm for high spatial resolution satellite imagery
1
2020
... 目前,遥感图像全色锐化方法大致可分为2类: 成分替换方法和多分辨率分解方法[5 ] .成分替换方法是将多光谱图像变换到另一个空间,分离出光谱特征和纹理细节特征,并采用全色图像替换多光谱细节特征,再逆变换回到初始空间.成分替换方法主要有: IHS变换[6 ] 、Brovey法[7 ] 、主成分变换(principal component analysis,PCA)[8 ] 以及Gram-Schmidt法[9 ] 等.成分替换方法简单易行,细节保持较好,但光谱扭曲较大.多分辨率分解方法是先采用多尺度分析对多源遥感图像进行分解,再将分解后的子带信息在多方向以及多分辨率下进行融合,最后再通过重构得到融合后的高质量图像.常见的多分辨率分解方法有非下采样剪切波变换法(nonsubsampled shearlet transform, NSST)[10 ] 、基于平滑滤波器的强度调制法(smoothing filter-based intensity modulation, SFIM) [7 ] 、高通滤波法(high pass filter, HPF) [7 ] 、金字塔变换[11 ] 、轮廓波变换[12 ] 、剪切波变换[13 ] 、非下采样轮廓波变换(nonsubsampled contourlet transform, NSCT)[14 -15 ] 等.多分辨率分解方法光谱扭曲小,但计算量较大、细节保持不足. ...
A review of image fusion techniques for pan-sharpening of high-resolution satellite imagery
5
2021
... 目前,遥感图像全色锐化方法大致可分为2类: 成分替换方法和多分辨率分解方法[5 ] .成分替换方法是将多光谱图像变换到另一个空间,分离出光谱特征和纹理细节特征,并采用全色图像替换多光谱细节特征,再逆变换回到初始空间.成分替换方法主要有: IHS变换[6 ] 、Brovey法[7 ] 、主成分变换(principal component analysis,PCA)[8 ] 以及Gram-Schmidt法[9 ] 等.成分替换方法简单易行,细节保持较好,但光谱扭曲较大.多分辨率分解方法是先采用多尺度分析对多源遥感图像进行分解,再将分解后的子带信息在多方向以及多分辨率下进行融合,最后再通过重构得到融合后的高质量图像.常见的多分辨率分解方法有非下采样剪切波变换法(nonsubsampled shearlet transform, NSST)[10 ] 、基于平滑滤波器的强度调制法(smoothing filter-based intensity modulation, SFIM) [7 ] 、高通滤波法(high pass filter, HPF) [7 ] 、金字塔变换[11 ] 、轮廓波变换[12 ] 、剪切波变换[13 ] 、非下采样轮廓波变换(nonsubsampled contourlet transform, NSCT)[14 -15 ] 等.多分辨率分解方法光谱扭曲小,但计算量较大、细节保持不足. ...
... [7 ]、高通滤波法(high pass filter, HPF) [7 ] 、金字塔变换[11 ] 、轮廓波变换[12 ] 、剪切波变换[13 ] 、非下采样轮廓波变换(nonsubsampled contourlet transform, NSCT)[14 -15 ] 等.多分辨率分解方法光谱扭曲小,但计算量较大、细节保持不足. ...
... [7 ]、金字塔变换[11 ] 、轮廓波变换[12 ] 、剪切波变换[13 ] 、非下采样轮廓波变换(nonsubsampled contourlet transform, NSCT)[14 -15 ] 等.多分辨率分解方法光谱扭曲小,但计算量较大、细节保持不足. ...
... 另外,开展了本文方法与GSA[22 ] ,HPF[23 ] ,SFIM[23 ] ,Indusion[24 ] ,MTF-GLP-HPM-PP[7 ] 和MTF-GLP-CBD[7 ] 这6种经典遥感图像融合算法对比实验.文中所有实验以及相关代码均在MATLAB软件下开展,NSCT分解级数为3级,从“细”到“粗”分解的方向子带数分别为8,8,16; GF中的滤波窗口大小R 设置为5,归一化因子ε 为0.01. ...
... [7 ]这6种经典遥感图像融合算法对比实验.文中所有实验以及相关代码均在MATLAB软件下开展,NSCT分解级数为3级,从“细”到“粗”分解的方向子带数分别为8,8,16; GF中的滤波窗口大小R 设置为5,归一化因子ε 为0.01. ...
Remote sensing image fusion method based on PCA and curvelet transform
1
2018
... 目前,遥感图像全色锐化方法大致可分为2类: 成分替换方法和多分辨率分解方法[5 ] .成分替换方法是将多光谱图像变换到另一个空间,分离出光谱特征和纹理细节特征,并采用全色图像替换多光谱细节特征,再逆变换回到初始空间.成分替换方法主要有: IHS变换[6 ] 、Brovey法[7 ] 、主成分变换(principal component analysis,PCA)[8 ] 以及Gram-Schmidt法[9 ] 等.成分替换方法简单易行,细节保持较好,但光谱扭曲较大.多分辨率分解方法是先采用多尺度分析对多源遥感图像进行分解,再将分解后的子带信息在多方向以及多分辨率下进行融合,最后再通过重构得到融合后的高质量图像.常见的多分辨率分解方法有非下采样剪切波变换法(nonsubsampled shearlet transform, NSST)[10 ] 、基于平滑滤波器的强度调制法(smoothing filter-based intensity modulation, SFIM) [7 ] 、高通滤波法(high pass filter, HPF) [7 ] 、金字塔变换[11 ] 、轮廓波变换[12 ] 、剪切波变换[13 ] 、非下采样轮廓波变换(nonsubsampled contourlet transform, NSCT)[14 -15 ] 等.多分辨率分解方法光谱扭曲小,但计算量较大、细节保持不足. ...
结合Gram-Schmidt变换的高光谱影像谐波分析融合算法
1
2015
... 目前,遥感图像全色锐化方法大致可分为2类: 成分替换方法和多分辨率分解方法[5 ] .成分替换方法是将多光谱图像变换到另一个空间,分离出光谱特征和纹理细节特征,并采用全色图像替换多光谱细节特征,再逆变换回到初始空间.成分替换方法主要有: IHS变换[6 ] 、Brovey法[7 ] 、主成分变换(principal component analysis,PCA)[8 ] 以及Gram-Schmidt法[9 ] 等.成分替换方法简单易行,细节保持较好,但光谱扭曲较大.多分辨率分解方法是先采用多尺度分析对多源遥感图像进行分解,再将分解后的子带信息在多方向以及多分辨率下进行融合,最后再通过重构得到融合后的高质量图像.常见的多分辨率分解方法有非下采样剪切波变换法(nonsubsampled shearlet transform, NSST)[10 ] 、基于平滑滤波器的强度调制法(smoothing filter-based intensity modulation, SFIM) [7 ] 、高通滤波法(high pass filter, HPF) [7 ] 、金字塔变换[11 ] 、轮廓波变换[12 ] 、剪切波变换[13 ] 、非下采样轮廓波变换(nonsubsampled contourlet transform, NSCT)[14 -15 ] 等.多分辨率分解方法光谱扭曲小,但计算量较大、细节保持不足. ...
混沌蜂群优化的NSST域多光谱与全色图像融合
1
2017
... 目前,遥感图像全色锐化方法大致可分为2类: 成分替换方法和多分辨率分解方法[5 ] .成分替换方法是将多光谱图像变换到另一个空间,分离出光谱特征和纹理细节特征,并采用全色图像替换多光谱细节特征,再逆变换回到初始空间.成分替换方法主要有: IHS变换[6 ] 、Brovey法[7 ] 、主成分变换(principal component analysis,PCA)[8 ] 以及Gram-Schmidt法[9 ] 等.成分替换方法简单易行,细节保持较好,但光谱扭曲较大.多分辨率分解方法是先采用多尺度分析对多源遥感图像进行分解,再将分解后的子带信息在多方向以及多分辨率下进行融合,最后再通过重构得到融合后的高质量图像.常见的多分辨率分解方法有非下采样剪切波变换法(nonsubsampled shearlet transform, NSST)[10 ] 、基于平滑滤波器的强度调制法(smoothing filter-based intensity modulation, SFIM) [7 ] 、高通滤波法(high pass filter, HPF) [7 ] 、金字塔变换[11 ] 、轮廓波变换[12 ] 、剪切波变换[13 ] 、非下采样轮廓波变换(nonsubsampled contourlet transform, NSCT)[14 -15 ] 等.多分辨率分解方法光谱扭曲小,但计算量较大、细节保持不足. ...
A fusion method for visible and infrared images based on contrast pyramid with teaching learning based optimization
1
2014
... 目前,遥感图像全色锐化方法大致可分为2类: 成分替换方法和多分辨率分解方法[5 ] .成分替换方法是将多光谱图像变换到另一个空间,分离出光谱特征和纹理细节特征,并采用全色图像替换多光谱细节特征,再逆变换回到初始空间.成分替换方法主要有: IHS变换[6 ] 、Brovey法[7 ] 、主成分变换(principal component analysis,PCA)[8 ] 以及Gram-Schmidt法[9 ] 等.成分替换方法简单易行,细节保持较好,但光谱扭曲较大.多分辨率分解方法是先采用多尺度分析对多源遥感图像进行分解,再将分解后的子带信息在多方向以及多分辨率下进行融合,最后再通过重构得到融合后的高质量图像.常见的多分辨率分解方法有非下采样剪切波变换法(nonsubsampled shearlet transform, NSST)[10 ] 、基于平滑滤波器的强度调制法(smoothing filter-based intensity modulation, SFIM) [7 ] 、高通滤波法(high pass filter, HPF) [7 ] 、金字塔变换[11 ] 、轮廓波变换[12 ] 、剪切波变换[13 ] 、非下采样轮廓波变换(nonsubsampled contourlet transform, NSCT)[14 -15 ] 等.多分辨率分解方法光谱扭曲小,但计算量较大、细节保持不足. ...
The contourlet transform:An efficient directional multiresolution image representation
1
2005
... 目前,遥感图像全色锐化方法大致可分为2类: 成分替换方法和多分辨率分解方法[5 ] .成分替换方法是将多光谱图像变换到另一个空间,分离出光谱特征和纹理细节特征,并采用全色图像替换多光谱细节特征,再逆变换回到初始空间.成分替换方法主要有: IHS变换[6 ] 、Brovey法[7 ] 、主成分变换(principal component analysis,PCA)[8 ] 以及Gram-Schmidt法[9 ] 等.成分替换方法简单易行,细节保持较好,但光谱扭曲较大.多分辨率分解方法是先采用多尺度分析对多源遥感图像进行分解,再将分解后的子带信息在多方向以及多分辨率下进行融合,最后再通过重构得到融合后的高质量图像.常见的多分辨率分解方法有非下采样剪切波变换法(nonsubsampled shearlet transform, NSST)[10 ] 、基于平滑滤波器的强度调制法(smoothing filter-based intensity modulation, SFIM) [7 ] 、高通滤波法(high pass filter, HPF) [7 ] 、金字塔变换[11 ] 、轮廓波变换[12 ] 、剪切波变换[13 ] 、非下采样轮廓波变换(nonsubsampled contourlet transform, NSCT)[14 -15 ] 等.多分辨率分解方法光谱扭曲小,但计算量较大、细节保持不足. ...
The discrete shearlet transform:A new directional transform and compactly supported shearlet frames
1
2010
... 目前,遥感图像全色锐化方法大致可分为2类: 成分替换方法和多分辨率分解方法[5 ] .成分替换方法是将多光谱图像变换到另一个空间,分离出光谱特征和纹理细节特征,并采用全色图像替换多光谱细节特征,再逆变换回到初始空间.成分替换方法主要有: IHS变换[6 ] 、Brovey法[7 ] 、主成分变换(principal component analysis,PCA)[8 ] 以及Gram-Schmidt法[9 ] 等.成分替换方法简单易行,细节保持较好,但光谱扭曲较大.多分辨率分解方法是先采用多尺度分析对多源遥感图像进行分解,再将分解后的子带信息在多方向以及多分辨率下进行融合,最后再通过重构得到融合后的高质量图像.常见的多分辨率分解方法有非下采样剪切波变换法(nonsubsampled shearlet transform, NSST)[10 ] 、基于平滑滤波器的强度调制法(smoothing filter-based intensity modulation, SFIM) [7 ] 、高通滤波法(high pass filter, HPF) [7 ] 、金字塔变换[11 ] 、轮廓波变换[12 ] 、剪切波变换[13 ] 、非下采样轮廓波变换(nonsubsampled contourlet transform, NSCT)[14 -15 ] 等.多分辨率分解方法光谱扭曲小,但计算量较大、细节保持不足. ...
Nonsubsampled contourlet transform based tone-mapping operator to optimize the dynamic range of diatom shells
1
2021
... 目前,遥感图像全色锐化方法大致可分为2类: 成分替换方法和多分辨率分解方法[5 ] .成分替换方法是将多光谱图像变换到另一个空间,分离出光谱特征和纹理细节特征,并采用全色图像替换多光谱细节特征,再逆变换回到初始空间.成分替换方法主要有: IHS变换[6 ] 、Brovey法[7 ] 、主成分变换(principal component analysis,PCA)[8 ] 以及Gram-Schmidt法[9 ] 等.成分替换方法简单易行,细节保持较好,但光谱扭曲较大.多分辨率分解方法是先采用多尺度分析对多源遥感图像进行分解,再将分解后的子带信息在多方向以及多分辨率下进行融合,最后再通过重构得到融合后的高质量图像.常见的多分辨率分解方法有非下采样剪切波变换法(nonsubsampled shearlet transform, NSST)[10 ] 、基于平滑滤波器的强度调制法(smoothing filter-based intensity modulation, SFIM) [7 ] 、高通滤波法(high pass filter, HPF) [7 ] 、金字塔变换[11 ] 、轮廓波变换[12 ] 、剪切波变换[13 ] 、非下采样轮廓波变换(nonsubsampled contourlet transform, NSCT)[14 -15 ] 等.多分辨率分解方法光谱扭曲小,但计算量较大、细节保持不足. ...
NSCT和PCNN相结合的遥感图像全色锐化算法
1
... 目前,遥感图像全色锐化方法大致可分为2类: 成分替换方法和多分辨率分解方法[5 ] .成分替换方法是将多光谱图像变换到另一个空间,分离出光谱特征和纹理细节特征,并采用全色图像替换多光谱细节特征,再逆变换回到初始空间.成分替换方法主要有: IHS变换[6 ] 、Brovey法[7 ] 、主成分变换(principal component analysis,PCA)[8 ] 以及Gram-Schmidt法[9 ] 等.成分替换方法简单易行,细节保持较好,但光谱扭曲较大.多分辨率分解方法是先采用多尺度分析对多源遥感图像进行分解,再将分解后的子带信息在多方向以及多分辨率下进行融合,最后再通过重构得到融合后的高质量图像.常见的多分辨率分解方法有非下采样剪切波变换法(nonsubsampled shearlet transform, NSST)[10 ] 、基于平滑滤波器的强度调制法(smoothing filter-based intensity modulation, SFIM) [7 ] 、高通滤波法(high pass filter, HPF) [7 ] 、金字塔变换[11 ] 、轮廓波变换[12 ] 、剪切波变换[13 ] 、非下采样轮廓波变换(nonsubsampled contourlet transform, NSCT)[14 -15 ] 等.多分辨率分解方法光谱扭曲小,但计算量较大、细节保持不足. ...
The nonsubsampled contourlet transform:Theory,design,and applications
1
2006
... Cunha等[16 ] 根据非下采样小波变换原理,在轮廓波变换对图像分解处理的基础上,提出了NSCT变换的概念.NSCT变换首先由非下采样金字塔(nonsubsampled pyramid, NSP)滤波器组对图像进行多分辨率分解,然后采用非下采样方向滤波器组(nonsubsampled direction filter bank, NSDFB)对多尺度分解得到的高频子带进行多方向分解,以2层分解、各层方向分解数为n 1 和n 2 为例,NSCT分解示意图如图1 所示. ...
Single image haze removal using dark channel prior
1
2011
... GF技术是He等[17 -18 ] 在解决图像去雾问题中所提出的一种滤波方法,该方法滤波结果边缘保持性较好,且能够将引导图像的特征注入到输入图像中.若规定引导图像为G ,输出图像为O ,则GF的数学表达为: ...
Guided image filtering
1
2013
... GF技术是He等[17 -18 ] 在解决图像去雾问题中所提出的一种滤波方法,该方法滤波结果边缘保持性较好,且能够将引导图像的特征注入到输入图像中.若规定引导图像为G ,输出图像为O ,则GF的数学表达为: ...
A new adaptive component-substitution-based satellite image fusion by using partial replacement
1
2011
... 由于多光谱图像每个波段光谱信息存在差异,统一为MSUn 图像注入相同强度细节分量势必会导致融合图像产生较大的光谱失真.为此,本文采用自适应细节权重,为每个波段注入不同强度的细节分量[19 ] .规定n 为第n 个波段,N 为多光谱图像的总波段数; r 为多光谱图像与全色图像的空间分辨率比值; Xl 为将X 图像先下采样1/r ,再上采样r 倍得到的低通图像.则细节权重gn 的数学描述如式(6)—(11)所示. ...
遥感数据融合研究进展与文献定量分析(1992-2018)
1
2019
... 除了采用主观评价方式对图像融合效果进行主观评判以外,论文还选用了光谱扭曲度D λ 、空间细节失真度D s 、无参考指标(quality with no reference, QNR)、四元数指标(Q4)、相对全局综合误差(relative dimensionless global error in synthesis, ERGAS)、光谱映射角(spectral angle mapper, SAM)、广义图像质量指标(universal image quality index, UIQI)和相关系数(correlation coefficient, CC)共8种客观评价指标[20 ] 对图像融合效果进行客观评价,其中D λ ,D s 和QNR属于在全分辨率融合下的评价指标,Q4,ERGAS,SAM,UIQI和CC属于按照wald协议[21 ] ,将原始多光谱图像作为参考图像,将原始多光谱图像和全色图像都进行下采样后,降分辨率融合下的评价指标. ...
Fusion of satellite images of different spatial resolutions:Assessing the quality of resulting images
1
1997
... 除了采用主观评价方式对图像融合效果进行主观评判以外,论文还选用了光谱扭曲度D λ 、空间细节失真度D s 、无参考指标(quality with no reference, QNR)、四元数指标(Q4)、相对全局综合误差(relative dimensionless global error in synthesis, ERGAS)、光谱映射角(spectral angle mapper, SAM)、广义图像质量指标(universal image quality index, UIQI)和相关系数(correlation coefficient, CC)共8种客观评价指标[20 ] 对图像融合效果进行客观评价,其中D λ ,D s 和QNR属于在全分辨率融合下的评价指标,Q4,ERGAS,SAM,UIQI和CC属于按照wald协议[21 ] ,将原始多光谱图像作为参考图像,将原始多光谱图像和全色图像都进行下采样后,降分辨率融合下的评价指标. ...
Improving component substitution pansharpening through multivariate regression of MS+Pan data
1
2007
... 另外,开展了本文方法与GSA[22 ] ,HPF[23 ] ,SFIM[23 ] ,Indusion[24 ] ,MTF-GLP-HPM-PP[7 ] 和MTF-GLP-CBD[7 ] 这6种经典遥感图像融合算法对比实验.文中所有实验以及相关代码均在MATLAB软件下开展,NSCT分解级数为3级,从“细”到“粗”分解的方向子带数分别为8,8,16; GF中的滤波窗口大小R 设置为5,归一化因子ε 为0.01. ...
A new benchmark based on recent advances in multispectral pansharpening:Revisiting pansharpening with classical and emerging pansharpening methods
2
2021
... 另外,开展了本文方法与GSA[22 ] ,HPF[23 ] ,SFIM[23 ] ,Indusion[24 ] ,MTF-GLP-HPM-PP[7 ] 和MTF-GLP-CBD[7 ] 这6种经典遥感图像融合算法对比实验.文中所有实验以及相关代码均在MATLAB软件下开展,NSCT分解级数为3级,从“细”到“粗”分解的方向子带数分别为8,8,16; GF中的滤波窗口大小R 设置为5,归一化因子ε 为0.01. ...
... [23 ],Indusion[24 ] ,MTF-GLP-HPM-PP[7 ] 和MTF-GLP-CBD[7 ] 这6种经典遥感图像融合算法对比实验.文中所有实验以及相关代码均在MATLAB软件下开展,NSCT分解级数为3级,从“细”到“粗”分解的方向子带数分别为8,8,16; GF中的滤波窗口大小R 设置为5,归一化因子ε 为0.01. ...
A critical comparison among pansharpening algorithms
1
2015
... 另外,开展了本文方法与GSA[22 ] ,HPF[23 ] ,SFIM[23 ] ,Indusion[24 ] ,MTF-GLP-HPM-PP[7 ] 和MTF-GLP-CBD[7 ] 这6种经典遥感图像融合算法对比实验.文中所有实验以及相关代码均在MATLAB软件下开展,NSCT分解级数为3级,从“细”到“粗”分解的方向子带数分别为8,8,16; GF中的滤波窗口大小R 设置为5,归一化因子ε 为0.01. ...


