

0 引言
陕西省是国家“一带一路”倡议和西部大开发战略重点发展区域,在我国经济、社会发展中具有重要的区位优势。同时作为我国第一批退耕还林(草)工程试点地区之一,经过2轮实施植被覆盖和生态系统质量已发生显著转变[7⇓-9]。已有学者开展了省域植被NDVI变化及其影响因素的研究[10-11],研究内容多集中于水、热、光等气候因素对植被NDVI的影响,忽略了陕西省作为能源大省人为活动尤其是矿业行为对其的影响(文中“矿业行为”泛指对矿区植被与生态状况造成正面或负面影响的一切人为活动,不局限于采矿活动,涵盖了《中华人民共和国矿产资源法(修订草案)》中针对矿产资源的保护、勘探、开发、选冶及矿区生态修复等行为,也突破了国土“三调”地类方案中“采矿用地”的限定),而矿业行为在促进经济发展的同时也对局部生态环境造成不可逆转或修复的破坏[12-13]。目前,面对矿产资源违法开采信息获取不及时、精准度低的难题,可通过多源卫星遥感数据采用克里金数据分析、子区域多标签学习等人机交互解译的方法进行监测[14⇓-16]。根据监测角度和内容不同,矿区遥感监测研究大致分为以下4类: 第一类是从地表覆盖类型变化角度评估生态系统状况,例如,高文龙等[17]针对海流兔流域矿区,评价了2006—2018年的地表覆盖类型变化,发现该矿区发展并未对生态环境造成较大伤害; 第二类是从生态系统质量单一光谱指数监测角度监测矿区生态系统状况,Li等[18]设计一种基于时间NDVI轨迹分析的三步法,重建了Virginia西南部煤田的扰动历史,发现在研究期间采矿的干扰区域逐渐扩大; 第三类是从生态系统质量综合指标角度监测矿区生态系统状况,Zhu等[19]以河南省某矿区为例,基于遥感生态指数(remote sensing ecological index,RSEI)提出一种移动窗遥感生态指数(moving window-remote sensing ecology index,MW-RSEI)模型,发现 2009—2018年矿区内MW-RSEI均值由0.668下降至0.611,其中城市扩张和采矿是生态环境恶化的主要驱动因素,而植被覆盖度低是露天矿对矿区生态环境影响严重的最主要原因; 第四类是从生态系统服务功能角度监测矿区生态系统状况,Xiao等[20]利用植被覆盖度和植被净初级生产力(net primary productivity,NPP)确定生态参数,对神东矿区的生态资本进行估算,分析了不同强度开采区域生态系统服务价值的时空变化,发现矿区内生态成本在逐年增加且分布表现为由东北向西南逐渐降低[20]。然而,这些研究多集中在单一矿山地质环境和生态服务价值方面,或者仅限于矿山开发数据获取方面,所用数据较单一、精度有限,研究的时序较短,或仅利用了若干时间断面,无法客观连续地揭示生态空间格局及其异质性特征。本文利用长时序NDVI数据,反映植被生态在横向空间域(不同矿集区)和纵向时间域(2001—2022年)的演替规律,进而探讨其对气候环境和矿业行为双重扰动的响应程度,其结果对于区域生态保护和矿山修复治理等具有十分重要的理论价值和现实意义[21⇓-23]。
1 研究区概况
陕西省(105°29'~111°15'E,31°42'~39°35'N)位于西北内陆腹地(图1),面积约20.56万km2,海拔在500~2 000 m,呈南北高中部低、自西向东倾斜的地势格局[24]。从北向南大致分为陕北黄土高原(包括榆林、延安、铜川地区),关中平原(包括西安、咸阳、宝鸡、渭南地区)和秦巴山地(包括汉中、商洛、安康地区)3个地貌区,秦岭地区平均海拔最高(1 295 m),关中地区最低(546 m)。由于地处东部湿润区和西部干旱区的交界地带,陕西省气候复杂多样、差异显著,自北向南纵跨中温带、暖温带、北亚热带,属典型的大陆性季风气候区,年均降水量约576.9 mm,年均气温约13.0 ℃,无霜期218 d左右。
图1

图1
陕西省地貌分区及矿产地分布
Fig.1
Landform division and distribution map of mineral resources in Shaanxi Province
陕西省自然资源丰富,矿产资源储量巨大,已发现各类矿产138种(含亚矿种),探明中型以上规模矿产地518处(超大型15处、大型280处、中型223处)。与不同的地质构造作用和地理地貌单元相伴随,陕北高原因蕴藏丰厚的煤、石油、天然气、盐等矿产,成为了我国北方重要的能源化工基地; 秦岭因出产贵金属、有色金属及各类非金属矿产,金堆城素有“中国钼都”之称[25]。然而,资源越富集的地区矿业行为也越活跃,据统计2016年陕西省就保有生产矿山4 288个,这在复杂地貌交错带露天采矿活跃地区表现的更为突出,已对区域的植被生长和生态格局造成较大影响。
2 数据源及处理平台
2.1 数据源
NDVI数据源自美国国家航空航天局(National Aeronautics and Space Administration,NASA)戈达德航天中心的MODIS数据产品(https://ladsweb.modaps.eosdis.nasa.gov/),所用MOD13Q1属于MODIS三级数据产品,空间分辨率为250 m、时间分辨率为16 d,已经过去云、辐射校正、大气校正等处理,降低了冠层背景变化影响,可在高植被覆盖情况下保持敏感[26-27]。陕西省在全球正弦投影系统中编号为h26v05和h27v05,本次选取2001年1月—2022年12月影像506期,通过MODIS Reprojection Tool(MRT)工具进行波段提取、镶嵌、投影转换等处理。处理后数据格式由HDF转换为TIFF格式,批量转换为WGS_1984坐标系统,再利用ArcGIS工具依据研究区行政边界做裁剪处理。为尽可能规避云层、大气与太阳高度角等干扰影响,采用最大值合成法(maximum value composite,MVC)获得年NDVI值[28-29]。
气温、降雨、湿度数据分别来自广东省科学院广州地理研究所最新发布的中国区域1 km分辨率逐月近地表平均气温数据集(2000—2020年)、中国区域1 km分辨率逐月降水量数据集(2000—2020年)、中国区域1 km分辨率逐月平均相对湿度数据集(2000—2020年),数据精度均为1 km,量纲分别为℃,mm和百分比(%),投影方式为经纬度、采用WGS 84椭球体[30]。
2.2 处理平台
本次趋势分析和(偏)相关分析均是在MATLAB2016(a) 平台运行,MATLAB是一种高级编程语言,具有强大的数学和绘图功能、可定制性高,结合自编脚本可以扩展功能来解决复杂的数学问题,运用到的关键代码参考IT技术论坛[34]。在利用MATLAB分析之前,将气候(气温、降水、湿度)和矿业数据统一投影转换为WGS_1984,统一行列为548×776,输出栅格大小为1 000 m。
3 研究方法
3.1 趋势分析
式中: slope为像元回归方程的斜率,当slope>0时代表该像元NDVI为增加趋势,当slope=0时表示该像元NDVI基本不变,当slope<0时表示该像元NDVI为减少趋势; n为研究时间序列的长度,本文中n=22(2001—2022年总共22 a); i代表第i年; NDVIi 为第i年的NDVI值。
NDVI变化趋势的显著性采用F检验,显著性仅代表趋势性变化可置信程度的高低[36]。根据显著性的检验结果将NDVI的变化趋势分为如下5个类型: 极显著减少(slope<0,P<0.01); 显著减少(slope<0,0.01≤P<0.05); 变化不显著(P≥0.05); 显著增加(slope>0,0.01≤P<0.05); 极显著增加(slope>0,P<0.01)。
3.2 相关分析
采用皮尔逊(Pearson)相关分析方法,利用矿(集)区数量代表矿业行为强度,分别研究气温、降水、湿度、矿业行为与NDVI之间的关系,采用t检验法来检验相关系数的显著性,并根据检验结果,分为极显著(P<0.01)、显著(0.01≤P<0.05)、不显著(P≥0.05)。相关系数[35]计算公式为:
式中: rxy为相关系数,值在(-1,1)之间,rxy=0表示2个变量不相关,rxy值越趋近于1表示正相关关系越强,反之越趋近于-1则负相关关系越强; n为年份; i为n年中的某一年; xi为自变量(2001—2020年间第i年的气温、降水、湿度等),yi为因变量(NDVI);
4 结果与分析
4.1 NDVI空间分布特征
2001—2022年陕西省年均NDVI集中于0.41~0.97之间,多年NDVI均值为0.706(图2)。结合植被覆盖数据来看,主要林区NDVI分布在[0.60,0.97]之间,约占全省林区面积的43.1%,其中NDVI≥0.8的林区占林区面积的26.7%,主要分布在秦巴山地,植被类型以落叶阔叶林为主,混交林次之; 而0.4≤NDVI<0.6的林区占林区面积的13.7%,分布在白于山以北和渭北台塬东部,植被类型多为常绿针叶林和灌丛。可见,陕西省NDVI分布具有明显的空间异质性。
图2

图2
2001—2022年陕西省植被年均NDVI的空间分布
Fig.2
Spatial distribution of annual NDVI from 2001 to 2022 of Shaanxi Province
从NDVI变化趋势空间分布及显著性检验结果来看(图3),2001—2022年陕西省约有81.5%地区NDVI呈增加趋势,每年趋势率0≤slope<0.006,slope≥0.006的地区分别达到全省面积的40.1%和41.4%。其中NDVI增加趋势达到极显著水平的地区占全省面积的73.3%,NDVI增加趋势达到显著水平的地区占全省面积的7.7%,增加地区主要分布在陕北黄土高原和以及秦巴山地。与之相反,全省约有3.1%地区NDVI呈减少趋势,每年趋势率-0.038<slope≤0,其中减少趋势达到显著水平、极显著水平的地区分别占全省面积的0.7%和2.4%,减少地区主要分布在关中平原的西安、咸阳、渭南等城市。
图3
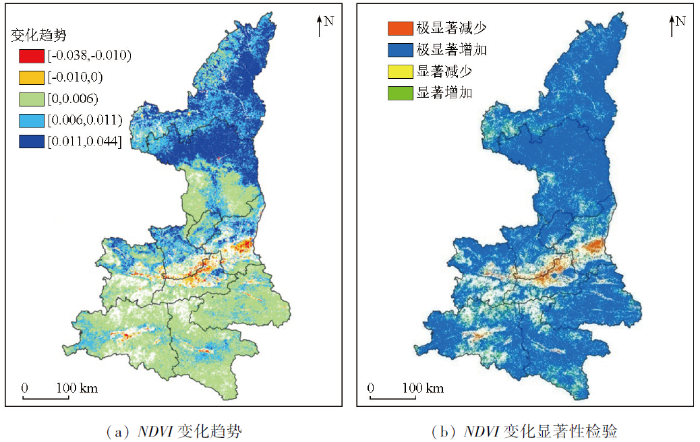
图3
2001—2022年陕西省植被年均NDVI变化趋势和显著性检验
Fig.3
Spatial distribution of annual NDVI of linear trend and significance test from 2001 to 2022 of Shaanxi Province
4.2 NDVI时间变化特征
2001—2022年陕西省NDVI处于波动上升趋势(图4),0.80≤NDVI≤0.97的地区面积比例每年最高,变化范围为31.63%~53.44%,总体占比呈增加趋势; 0.6≤NDVI<0.8的地区面积比例每年次高,变化范围为21.88%~34.43%,虽有波动但占比较稳定。NDVI<0.4和0.4≤NDVI<0.6的面积比例呈波动减少趋势,年均分别减少0.67和0.74个百分点; 0.6≤NDVI≤0.97的面积比例呈显著增加趋势,年均增加1.23个百分点。从地貌分区来看,陕北黄土高原NDVI平均每年增加0.010,关中平原和秦巴山地NDVI平均每年分别增加0.004和0.003(图5)。2022年陕西省NDVI达到历史新高(0.78),较2001年(0.64)增加22.7%,年均增加0.006,增加趋势达了极显著水平(P<0.01),表明2001—2022年间陕西省植被覆盖和生态环境明显好转。其中秦巴山地多年平均NDVI最高为0.86,关中平原多年平均NDVI次高为0.65,陕北黄土高原多年平均NDVI最低为0.60。值得注意的是,在2015年陕西NDVI均值出现极(低)值拐点,尤其是在一些能源型城市(铜川、榆林)短期内NDVI呈现先减后增的“V”形演变趋势,这可能与当年的极端气候因素以及新一轮国土资源大调查项目实施有关[10,37-38]。
图4

图4
2001—2022年陕西省逐年NDVI及其不同等级面积比例变化
Fig.4
The Change of annual averaged NDVI and proportion of area of different NDVI grade from 2001 to 2022 of Shaanxi Province
图5
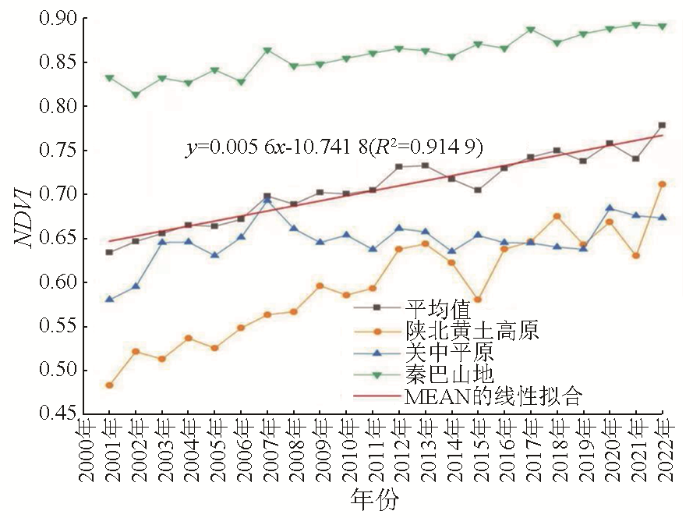
图5
2001—2022年陕西不同地貌区年均NDVI变化
Fig.5
The change of annual average NDVI of different landform division in Shaanxi Province from 2001 to 2022
4.3 NDVI相关性特征
图6-1

图6-1
2001—2020年陕西省气温、降水量、相对湿度和矿业行为趋势特征
Fig.6-1
Spatial patterns of trend coefficients of annual temperature, precipitation, humidity and mining activity from 2001 to 2020 of Shaanxi Province
图6-2
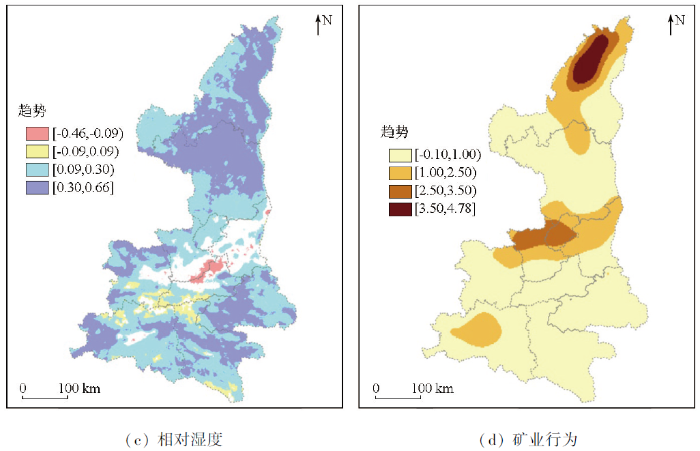
图6-2
2001—2020年陕西省气温、降水量、相对湿度和矿业行为趋势特征
Fig.6-2
Spatial patterns of trend coefficients of annual temperature, precipitation, humidity and mining activity from 2001 to 2020 of Shaanxi Province
借助MATLAB软件平台逐像元分别计算2001—2020年陕西省NDVI与气温、降水、相对湿度、矿业行为的相关系数,结果显示在NDVI多年均值较低的区域,NDVI与气温表现出一定的正相关,而在NDVI多年均值较高的区域,NDVI与气温表现出一定的负相关,正、负相关系数分别集中在0.4≤rxy<0.6与-0.6≤rxy<-0.4,相应占全省面积的2.2%和12.2%(图7(a)); NDVI与降水、相对湿度都表现出正相关性,相关系数分别集中在0.40≤rxy<0.97与0.40≤rxy<0.94,分别占全省面积的42.5%和11.1%(图7(b)和(c)); NDVI与矿业行为的相关性随着矿(集)区规模越大表现越显著,在渭北台塬和毛乌素沙漠表现出一定正相关,而在陕西黄土高原最北部和秦巴山地西南部表现出一定负相关,正、负相关的地区分别占全省面积的7.9%和4.3%,相关系数分别集中在0.4≤rxy<0.6与-0.6≤rxy<-0.4(图7(d))。NDVI与气温、相对湿度、矿业行为达到(极)显著相关的地区分别占全省面积的14.3%,15.3%和12.3%,而NDVI与降水达到(极)显著相关的地区占全省面积的45.2%,说明降水是影响陕西省植被NDVI变化的最主要因子。
图7-1
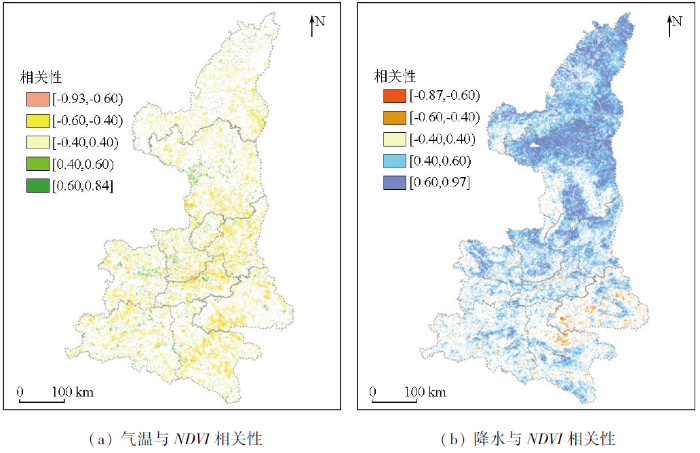
图7-1
陕西省2001—2020年NDVI与年均气温、降水量、相对湿度和矿业行为的相关性
Fig.7-1
Correlation between NDVI and average temperature, precipitation, humidity and mining activity from 2001 to 2020 of Shaanxi Province
图7-2

图7-2
陕西省2001—2020年NDVI与年均气温、降水量、相对湿度和矿业行为的相关性
Fig.7-2
Correlation between NDVI and average temperature, precipitation, humidity and mining activity from 2001 to 2020 of Shaanxi Province
5 讨论
5.1 NDVI时空演变及其分异性
5.2 NDVI变化对多因子的响应
NDVI对气候的响应因研究区域、时空尺度和数据精度等因素的不同而表现出一定的差异性[5,35,48],NDVI与气温、降水的相关性随着研究时段延长而增强。在大部分地区NDVI与气温和降水呈显著正相关,相较于气温,NDVI对降水的时滞效应更为突出[7,10,49-50]; 也有学者研究发现,NDVI与每年前几个月的降水总量相关性更强[51]; 在东南沿海和西北黄土高原全区NDVI与气温、降水和湿度等因子之间没有显著相关性,甚至在同一地区不同植被类型NDVI对气温和降水存在反差性响应[35,52-53]。本次研究发现降水是影响陕西省植被NDVI变化的最主要因子,但在局部(延安中部、铜川北部)落叶阔叶林、灌丛分布区NDVI对气温的响应较对降水强烈。总体而言,植被NDVI与气温和降水的响应存在明显空间分异,在陕北黄土高原一些多年NDVI均值较低的地区,NDVI与气温表现出一定的正相关,而在秦巴山地东部(安康、商洛)和关中平原东部(西安、咸阳南部、渭南)一些多年NDVI均值相对较高的地区,NDVI与气温表现出一定的负相关; NDVI与降水、湿度都表现出正相关性,在陕北黄土高原和关中平原NDVI与降雨相关性更显著,而在秦巴山地NDVI与湿度相关性更显著。
矿产资源开发利用是我国社会经济发展的重要支撑,陕西又是全国能源矿山开发强度较大的区域之一,矿业始终占据着国民生产总值的半壁江山[54],矿区开发与生态环境之间的冲突在所难免。2001—2022年陕西NDVI均值在2015年出现极低值,NDVI与矿业行为的相关性随着矿(集)区规模越大表现越显著,因采矿活动剧烈干扰了区域土地利用,进而影响矿区及周围植被生态状况。在个别地区(榆林南部)多年NDVI变化率呈现先负后正的“V”形趋势,甚至在黄土高原最北部(榆林北部)和秦巴山地西南部(汉中东南部)表现出一定负相关。这是因为2001—2012年处于我国经济社会和地质发展的黄金期,国家基础设施建设对大宗矿产资源(铁、铝、铜、煤、石油等)需求巨大,陕北地区为我国大型煤炭基地,秦巴山地盛产建材及其他非金属矿产,矿企低效粗放式的开采造成区域土地利用变化和植被生态破坏问题突出,尤以煤炭、油页岩等为主的能源矿山、建材及其他非金属矿山损毁土地和植被最严重[55-56],仅2012年陕西省矿业开采损毁土地约63.75万亩➊(➊ 1 亩≈666.67 m2),这类损毁面积大、范围广、时间长,并持续在防风固沙、固碳释氧方面对区域生态系统服务功能造成负面影响[57-58]。随后在国民经济发展增速“换挡减速”的背景下,受全球矿产品价格持续走低波及,公益性地质勘查经费和商业性社会投资明显缩水,矿业秩序重整使矿山数量不断减少,至2017年仅西安市、宝鸡市、潼关县等地先后关闭“多、小、散、乱”矿山514家[59]。在“绿水青山就是金山银山”等生态文明理念的指引下,随着绿色矿山实施规范的落实,环境保护与土地复垦复绿程度被纳入评价条件[60],陕西省统筹山水林田湖草系统治理,生态优先、绿色发展、因地制宜、分类施策被融入矿业生产实践,大矿小开、一矿多开、采优弃劣、采易丢难等局面得以扭转,至2017年已累计完成矿山环境恢复治理19.78万亩[59],生态修复成效在渭北台塬和毛乌素沙漠开始显现,致使铜川和榆林西部NDVI与矿业行为表现出正相关。综合来看NDVI与矿业行为表现出正、负相关的地区分别占全省面积的7.9%和4.3%,可见矿业行为对陕西省NDVI变化的正向贡献大于负向,促使NDVI高值区间分布更趋扩大和均衡。此外,NDVI与生态环境的向好演变也受益于退耕还林(草)工程、天然林资源保护工程以及水土保持工程等的实施[7,47,61⇓-63]。
论文初衷不是对单一矿区的生态环境及其影响因素进行监测评价,而是根据研究区的自然资源禀赋特征和产业经济模式探索在气候、矿业行为双重影响下的植被生态受干扰程度。本文突出矿业行为作为具体相关要素,不同于已有研究中将人为活动作为影响因素针对某一矿区的矿山地质环境和生态价值进行分析评估,研究成果对于目前职能部门正在开展的矿产督察和环保督察具有指示意义。一定程度上虽然矿(集)区数量可以代表矿业行为强度,但是矿产地位置并不能完全等同矿业行为及其对植被的影响范围。故文中以公益性地调项目提交的矿产地位置和规模类型通过核密度面化处理来反映人为活动在资源勘探、开发及矿区修复过程中的行为强度及影响范围,类似的面化处理法已在一些论文研究中得到有效应用,如刘立利用克里金数据分析方法,着重探讨了湖南地区矿山违法开采随着时间变化的空间分布特征[15]。另外,对于贵金属、有色金属等隐伏开采的矿产,建议结合矿权范围和开采方式合理确定其对植被生态的影响范围。
6 结论
1)2001—2020年20 a间,陕西省NDVI均值为0.706,并呈波动上升趋势,年均增加0.006(其中陕北黄土高原NDVI平均每年增加0.01,关中平原和秦巴山地平均每年分别增加0.004和0.003),NDVI极低值位于2015年。
2)2001年以来陕西省NDVI呈增加趋势的地区面积占比81.5%,呈减少趋势的面积比例仅为3.1%,且NDVI<0.4的林区面积呈显著减少趋势,平均每年减少0.67个百分点,NDVI≥0.6的林区面积呈显著增加趋势,平均每年增加1.23个百分点,表明陕西省植被覆盖和生态环境明显好转。
3)相关分析反映降水是影响陕西省2001—2020年20 a间植被NDVI变化的最主要因子,在全省大部分地区NDVI与降水、湿度都表现出显著正相关性,但植被NDVI对气温的响应存在明显空间分异,在陕北黄土高原NDVI与气温表现出较明显的正相关,而在秦巴山地和关中平原东部NDVI与气温表现出一定的负相关。
4)植被NDVI与矿业行为的相关性随着矿(集)区规模越大表现越显著,在一些能源型城市(铜川、榆林南)短期内NDVI呈现先减后增的“V”形趋势,总体而言矿业行为对陕西省植被NDVI变化的正向贡献大于负向。
参考文献
Hydrogeomorphic ecosystem responses to natural and anthropogenic changes in the Loess Plateau of China
[J].
1982—2013年中国植被NDVI空间异质性的气候影响分析
[J].
DOI:10.11821/dlxb201903010
[本文引用: 2]

为研究气候变化与植被活动之间的复杂关系,采用1982-2013年GIMMS NDVI与气象站点温度与水分的监测资料,应用基于像元的地理加权回归方法,探究了中国植被NDVI及其动态特征对气候变化响应的空间格局。中国植被NDVI与地表温度呈空间非平稳关系,在空间上的负相关关系主要集中在东北、西北及东南部分地区,空间正相关则更为集中和连片;针对不同气候指标的标准化系数对比可知,植被NDVI受水分控制作用较为显著的区域主要集中在北方地区以及青藏高原,温度的主导作用区域则分布在华东、华中及西南地区,其中年均最高气温对NDVI的主导区域范围最广;植被NDVI动态与气候变率的回归结果表明,增温速率的升高会通过加剧干旱等机制对植被活动产生抑制作用,水分变率对植被活动的强弱起到了重要的调节作用。
Revealing the climatic impacts on spatial heterogeneity of NDVI in China during 1982-2013
[J].
DOI:10.11821/dlxb201903010
[本文引用: 2]
Climate change is a major driver of vegetation activity, and thus its complex processes become a frontier and difficulty in global change research. To understand the complex relationship between climate change and vegetation activity, the spatial distribution and dynamic characteristics of the response of NDVI to climate change from 1982 to 2013 in China were investigated by the geographically weighted regression (GWR) model. The GWR was run based on the combined datasets of satellite vegetation index (GIMMS NDVI) and climate observation (temperature and moisture) from meteorological stations nationwide. The results noted that the spatial non-stationary relationship between NDVI and surface temperature has appeared in China. The significant negative temperature-vegetation relationship was distributed in northeast, northwest and southeast parts of the country, while the positive correlation was more concentrated from southwest to northeast. And then, by comparing the normalized regression coefficients for different climate factors, regions with moisture dominants for NDVI were observed in North China and the Tibetan Plateau, and regions with temperature dominants for NDVI were distributed in the East, Central and Southwest China, where the annual mean maximum temperature accounts for the largest areas. In addition, regression coefficients between NDVI dynamics and climate variability indicated that the higher warming rate could result in the weakened vegetation activity through some mechanisms such as enhanced drought, while the moisture variability could mediate the hydrothermal conditions for the variation of vegetation activity. When the increasing rate of photosynthesis exceeded that of respiration, there was a positive correlation between vegetation dynamics and climate variability. However, the continuous and dynamic responding process of vegetation activity to climate change will be determined by spatially heterogeneous conditions in climate change and vegetation cover. Furthermore, the description of climate-induced vegetation activity from its rise to decline in different regions is expected to provide a scientific basis for initiating ecosystem-based adaptation strategies in response to global climate change.
2001—2015年中国植被覆盖人为影响的时空格局
[J].
DOI:10.11821/dlxb201903008
[本文引用: 1]
基于MODIS-NDVI和气温、降水数据,使用基于变异系数的人为影响模型定量计算了2001-2015年中国植被覆盖人为影响,辅以趋势分析、Hurst指数等方法探讨了中国植被覆盖人为影响的时空变化特征及未来演变趋势。研究发现:① 2001-2015年,中国植被覆盖人为影响由南向北空间分异愈发明显,年均值为-0.0102,植被覆盖在人类活动影响下轻微减少,负影响面积占51.59%,略大于正影响面积。② 中国植被覆盖人为影响年际变化特征明显,整体呈负影响波动减少趋势,降速为0.5%/10a,其中正影响、负影响均呈增大趋势,正影响增速(0.3%/10a)远大于负影响(0.02%/10a)。③ 2001-2015年间,中国植被覆盖人为正影响重心向东北方向移动,负影响重心向西南方向移动,东北部植被覆盖在人为影响下不断改善,西南部人类活动对植被破坏程度不断增大。④ 中国植被覆盖人为影响主要呈负影响减少和正影响增大趋势,面积占比分别为28.14%和25.21%,生态环境趋于改善。⑤ Hurst指数分析表明,中国植被覆盖人为影响未来演变趋势的反向特征强于正向特征,主要呈人为负影响先减少后增大趋势,面积占比15.59%。
The spatial-temporal patterns of the impact of human activities on vegetation coverage in China from 2001 to 2015
[J].
DOI:10.11821/dlxb201903008
[本文引用: 1]
Based on MODIS-NDVI and climate data, using an artificial influence model based on coefficient of variation to quantitatively calculate the human impact of vegetation cover(NDVIH) in China from 2001 to 2015, Sen+Mann-Kendall model and Hurst index were used to analyze the spatial-temporal feature and the future trends. It was found that: (1) In the year from 2001 to 2015, the Spatial Differentiation of NDVIH in China was more obvious from southern part to northern part, with an average annual mean value of -0.0102, the vegetation coverage decreased slightly under human activities, the negative impact area accounting for 51.59% which is slightly larger than the positive impact area. (2) The interannual variation of NDVIH in China is obvious, showing the negative impact volatility decreased, the rate of decline is 0.5%/10a; among which the positive and negative effects all showed an increasing trend, the positive growth rate (0.3%/10a) is much larger than the negative impact (0.02%/10a). (3) During 2001-2015, the center of gravity of positive impact has moved to the northeast, the center of gravity of negative impact has moved to the southwest, vegetation cover in northeastern China has improved under the influence of mankind, and human activities in the southwest have increased the degree of vegetation destruction. (4) The proportion of "negative impact reduction" and "positive impact increase" trend of NDVIH in China appeared to be the largest which accounting for 28.14% and 25.21% of the total, and the ecological environment is improving. (5) The reverse characteristics of NDVIH change were stronger than the same characteristic in China, mainly showed a negative impact which decreased at the first and then increased with the rate of 15.59% of the total area.
中国不同植被类型归一化植被指数对气候变化和人类活动的响应
[J].
Vegetation dynamics and its response to climate change and human activities based on different vegetation types in China
[J].
1982—2015年黄河流域植被NDVI时空变化及影响因素分析
[J].
DOI:10.16258/j.cnki.1674-5906.2021.05.005
[本文引用: 2]
在全球变化的背景下,刻画植被动态、定量分析气候和人类活动对植被变化的影响对于改善生态系统结构和功能具有重要意义。基于GIMMS-NDVI3g数据、结合土地利用数据和气象数据,采用趋势分析、残差趋势等方法,多尺度、多时段、多类型研究1982—2015年黄河流域植被动态变化,并定量分析气候变化和人类活动对NDVI变化的贡献。结果表明,(1)1982—2015年间,生长季、春季、夏季和秋季NDVI均显著增加;植被明显改善地区主要分布在黄河中下游,而明显退化区域则主要分布在西南部。基于嵌套数据分析发现,随时间序列长度的增加,NDVI增加区域显著扩大。不同土地覆盖类型NDVI的增长速度不同,耕地和林地的增长速度大于其他土地覆盖类型。(2)黄河流域NDVI与气温的相关性更强,植被与温度/降水量相关性随着时段延长而增强。(3)残差趋势法表明,1982—2015年生长季人类活动对黄河流域植被变化的平均贡献率为69%,空间分布上呈现西北部、东部高而西南部、中部低的特征;人类活动贡献率在不同季节存在差异,但均大于气候变化;人类活动对不同季节NDVI变化的贡献率空间分布存在区域差异。黄河流域植被覆盖改善与人类活动息息相关,建议应进一步发挥其在黄河流域西南部地区植被恢复中的作用。
Spatio-temporal changes of vegetation cover and their influencing factors in the Yellow River basin from 1982 to 2015
[J].
Vegetation dynamics in Qinling-Daba Mountains in relation to climate factors between 2000 and 2014
[J].
DOI:10.1007/s11442-016-1253-8
[本文引用: 1]
Using the Moderate Resolution Imaging Spectroradiometer-normalized difference vegetation index (NDVI) dataset, we investigated the patterns of spatiotemporal variation in vegetation coverage and its associated driving forces in the Qinling-Daba (Qinba) Mountains in 2000-2014. The Sen and Mann-Kendall models and partial correlation analysis were used to analyze the data, followed by calculation of the Hurst index to analyze future trends in vegetation coverage. The results of the study showed that (1) NDVI of the study area exhibited a significant increase in 2000-2014 (linear tendency, 2.8%/10a). During this period, a stable increase was detected before 2010 (linear tendency, 4.32%/10a), followed by a sharp decline after 2010 (linear tendency, -6.59%/10a). (2) Spatially, vegetation cover showed a “high in the middle and a low in the surroundings” pattern. High values of vegetation coverage were mainly found in the Qinba Mountains of Shaanxi Province. (3) The area with improved vegetation coverage was larger than the degraded area, being 81.32% and 18.68%, respectively, during the study period. Piecewise analysis revealed that 71.61% of the total study area showed a decreasing trend in vegetation coverage in 2010-2014. (4) Reverse characteristics of vegetation coverage change were stronger than the same characteristics on the Qinba Mountains. About 46.89% of the entire study area is predicted to decrease in the future, while 34.44% of the total area will follow a continuously increasing trend. (5) The change of vegetation coverage was mainly attributed to the deficit in precipitation. Moreover, vegetation coverage during La Nina years was higher than that during El Nino years. (6) Human activities can induce ambiguous effects on vegetation coverage: both positive effects (through implementation of ecological restoration projects) and negative effects (through urbanization) were observed.
Coupling coordination degree of production,living and ecological spaces and its influencing factors in the Yellow River Basin
[J].
生态恢复工程对陕北地区生态系统格局的影响
[J].
Impacts of ecological restoration projects on the ecosystem in the Loess Plateau
[J].
Socio-ecological changes on the Loess Plateau of China after grain to green program
[J].
陕西省植被覆盖时空变化及其对极端气候的响应
[J].
Temporal and spatial variation of vegetation cover and its response to extreme climate in Shaanxi Province
[J].
近17年陕西榆林植被指数的时空变化及影响因素
[J].
Analysis of the spatial-temporal change and impact factors of the vegetation index in Yulin,Shaanxi Province,in the last 17 years
[J].
基于遥感生态指数的神东矿区1995—2020年生态环境质量的时空变化特征分析
[J].
Spatiotemporal analysis of eco-environmental benefits in Shenfu-Dongsheng mining area during 1995—2020 based on RSEI
[J].
陕西省不同地貌类型区植被覆盖度时空变化特征及其影响因素
[J].
DOI:10.11988/ckyyb.201915132021
[本文引用: 4]
为了评价“退耕还林(草)”等生态工程实施以来陕西省不同地貌类型区的植被覆盖变化,基于2000—2017年MODIS数据,采用像元二分模型估算了陕西省植被覆盖度,研究了不同地貌分区植被覆盖度时空变化及其影响因素。结果表明:①18 a来,陕西省植被覆盖度整体呈增加趋势,其中风沙过渡区、黄土高原区增加幅度较大,秦岭山地、汉江盆地与大巴山地增幅较小,关中平原则呈减少趋势。②全省38.88%的区域植被显著改善, 8.49%的区域植被显著退化,黄土高原区为主要改善区,关中平原区及其它地貌类型区的城市周围植被退化。③降水与气温对植被覆盖的影响存在空间差异,黄土高原区植被覆盖度与降水和气温分别以正相关和负相关为主,秦巴山地高海拔地区则均以负相关为主。④相对于地势低缓区域,地势高陡区域植被覆盖度更高,阴坡植被覆盖度较其它坡向高。研究结果将为陕西省生态环境保护分区实施提供科学依据。
Vegetation coverage in different landforms of Shaanxi Province:Spatial and temporal variations and influencing factors
[J].
基于多源遥感的采空塌陷识别技术应用研究
[J].
Application of mining collapse recognition technology based on multi-source remote sensing
[J].
多源卫星遥感的湖南矿山违法开采时空变化
[J].
Spatiotemporal changes of illegal mining in Hunan mines based on multi-source satellite remote sensing
[J].
基于子区域多标签学习的露天煤矿区场景识别
[J].
Opencast coal mine scene recognition based on sub-region multi-label learning
[J].
矿区地物分类及土地利用/覆盖变化动态监测——以海流兔流域为例
[J].
Classification of objects and LUCC dynamic monitoring in mining area:A case study of Hailiutu watershed
[J].
Reconstructing disturbance history for an intensively mined region by time-series analysis of Landsat imagery
[J].
DOI:10.1007/s10661-015-4766-1
PMID:26251060
[本文引用: 1]
Surface mining disturbances have attracted attention globally due to extensive influence on topography, land use, ecosystems, and human populations in mineral-rich regions. We analyzed a time series of Landsat satellite imagery to produce a 28-year disturbance history for surface coal mining in a segment of eastern USA's central Appalachian coalfield, southwestern Virginia. The method was developed and applied as a three-step sequence: vegetation index selection, persistent vegetation identification, and mined-land delineation by year of disturbance. The overall classification accuracy and kappa coefficient were 0.9350 and 0.9252, respectively. Most surface coal mines were identified correctly by location and by time of initial disturbance. More than 8 % of southwestern Virginia's >4000-km(2) coalfield area was disturbed by surface coal mining over the 28-year period. Approximately 19.5 % of the Appalachian coalfield surface within the most intensively mined county (Wise County) has been disturbed by mining. Mining disturbances expanded steadily and progressively over the study period. Information generated can be applied to gain further insight concerning mining influences on ecosystems and other essential environmental features.
Ecological environment assessment of mining area by using moving window-based remote sensing ecological index
[C]//
Is underground coal mining causing land degradation and significantly damaging ecosystems in semi-arid areas? A study from an ecological capital perspective
[J].
基于高分遥感影像的露天矿区土地利用动态监测——以平朔矿区为例
[J].
DOI:10.11873/j.issn.1004-0323.2023.2.0274
[本文引用: 1]
煤炭能源是我国能源体系的重要组成部分,煤炭的露天开采相较于井工开采对周边环境影响更加深远。平朔矿区是我国早期开发的露天矿区,主要采用边修复边开采的露天开采模式,导致矿区内部土地利用变化较快,亟需高效、准确提取各类地物类型及监测其生态恢复情况。以多期高分辨率影像为数据基础,通过多尺度分割和机器学习的面向对象分类方法,提取了研究区2013~2020年的土地利用信息,并进一步分析了平朔露天矿区的土地利用动态变化情况。结果表明:2013~2020年,矿区逐年向东迁移,矿区面积减少7.84 km<sup>2</sup>,农田面积减少36.08 km<sup>2</sup>,林地和草地面积增加64.77 km<sup>2</sup>,水体、排土场、矿区面积减少低于10 km<sup>2</sup>。研究区内土地利用面积变化分析结果表明,绿色矿山建设效果显著。结合平朔煤矿绿色发展政策,本研究将为绿色矿山建设评价提供方法和数据支撑。
Landuse dynamic monitoring in open-pit mining area based on high-resolution remote sensing ima-ge:A case study of pingshuo mining area
[J].
黄河流域矿产资源开发的生态环境影响与空间管控路径
[J].
DOI:10.18402/resci.2020.01.14
[本文引用: 1]
黄河流域作为中国的“能源流域”,合理有序开发矿产资源、统筹协调矿产资源开发与生态环境保护之间的关系,对于黄河流域能矿经济可持续发展和生态保护具有重要现实意义。本文以黄河流域为研究区,综合运用多指标综合评价法、胁迫耦合分析法和GIS空间分析等方法技术,从生态本底的脆弱程度、对重要生态功能区的空间胁迫性以及对重要生态环境因子的胁迫程度等多个层面,分析了区域矿产资源开发对生态环境的胁迫特征及空间分布,将黄河流域46个矿区城市划分为本底胁迫、生态功能胁迫、开发胁迫、本底+开发胁迫、开发+生态功能胁迫、本底+生态功能胁迫、全面胁迫和无胁迫8种不同类型区,并从生态环境保护的角度提出黄河流域矿产资源开发地区的管控路径:①空间管控:严格限制大规模高强度工业化城镇化开发,尤其是控制矿区的开发边界;②强度管控:针对于生态本底脆弱的地区,强度和总体开发规模的管控要兼而并举;③开发方式管控:注重能矿产业的结构调整与升级,在空间上要注重集中建设,宜矿则矿、宜工则工、宜聚则聚。
Eco-environmental impact and spatial control of mineral resources exploitation in the Yellow River Basin
[J].
DOI:10.18402/resci.2020.01.14
[本文引用: 1]
The Yellow River Basin is also known as China’s energy basin. Rational and orderly exploitation of mineral resources and overall coordination of the relationship between mineral resources exploitation and ecological environment protection are of great practical significance for the sustainable development of energy and mineral resources and ecological protection in the region. Taking the Yellow River Basin as the study area, this study comprehensively analyzed the characteristics and spatial distribution of environmental stress of regional mineral resources exploitation using multi-indicator comprehensive evaluation method, stress coupling analysis method, and GIS spatial analysis from the perspectives of ecological background fragility, spatial stress to important ecological function areas, and the degree of stress to important ecological environment factors. The 46 mining cities in the Yellow River Basin were divided into eight types, including background stress areas, ecological function stress areas, development stress areas, background with development stress areas, development with ecological function stress areas, background with ecological function stress areas, comprehensive stress areas, and no stress areas. Finally, the article put forward the control path of mineral resources development areas in the Yellow River Basin in view of ecological environment protection, including: (1) Spatial management and control by strictly restricting large-scale and high-intensity industrialization and urbanization development, especially controlling the development boundary of mining areas. (2) Intensity control for areas with fragile ecological background, the intensity and the overall development scale should be controlled simultaneously. (3) Development mode control to pay attention to the structural adjustment and upgrading of energy and mining industries. It is necessary to focus on spatially concentrated development of mining in places where mining is suitable, of industry where industrial development is suitable, and of cities and towns where urban development is suitable.
露天开采矿区要素遥感提取研究进展及展望
[J].
Research progress and prospect of remote sensing-based feature extraction of opencast mining areas
[J].
陕西省地理国(省)情监测中的基本地貌类型及划分指标
[J].
Fundamental relief types and their classification index used in provincial geographic conditions monitoring in Shaanxi
[J].
Investigation of terrain illumination effects on vegetation indices and VI-derived phenological metrics in subtropical deciduous forests
[J].
Geospatial approach to assess the impact of nutrients on rice equivalent yield using MODIS sensors’-based MOD13Q1-NDVI data
[J].
MOD13Q1 MODIS/Terra vegetation indices 16-Day L3 Global 250 m SIN Grid V006
[EB/OL].
Filtering pathfinder AVHRR land NDVI data for Australia
[J].
A spatial downscaling algorithm for satellite-based precipitation over the Tibetan Plateau based on NDVI,DEM,and land surface temperature
[J].
陕西主要成矿单元矿产特征及成矿时空域
[J].
Mineral characteristics and ore-forming spatiotemporal domain of main metallogenic units in Shaanxi Province
[J].
基于遥感和微博签到数据的住房空置空间识别
[J].
DOI:10.11873/j.issn.1004-0323.2020.4.0820
[本文引用: 1]
房屋空置率是衡量房地产市场健康与否的重要指标。基于夜间灯光遥感数据和全国土地覆盖数据,对房屋空置率进行空间识别。利用微博签到数据,通过基于密度的聚类算法和热力分析对居民活动空间强度进行分析,从“鬼城”指数排名靠前的100个城市中随机选择30个样本城市,进行城市内部房屋空置空间识别。结果表明:2013年全国地级及以上城市基于像元的平均房屋空置率为27.3%。东部地区房屋空置率较低,中西部地区房屋空置现象明显;房屋空置在中小型城市更加突出。
Study on the spatial identification of housing vacancy
[J].
我国矿产资源自然区划研究
[J].
Preliminary study on natural zoning of mineral resources in China
[J].
A comparison of SSEBop-model-based evapotranspiration with eight evapotranspiration products in the Yellow River basin,China
[J].
黄土高原不同植被覆被类型NDVI对气候变化的响应
[J].
Normalized difference vegetation index of different vegetation cover types and its responses to climate change in the Loess Plateau
[J].
2000—2015年青海省不同功能区NDVI时空变化分析
[J].
DOI:10.11733/j.issn.1007-0435.2017.04.003
[本文引用: 1]
基于2000-2015年MOD13Q1的NDVI陆地专题的产品,揭示了青海省不同功能区植被时空分布特征及变化规律,应用趋势分析法阐述过去16年不同功能区NDVI的变化规律,及利用变异系数揭示NDVI稳定性分布规律。结果表明:青海省植被NDVI表现为东南偏高,西北偏低,由东南向西北、由东向西逐渐递减的分布特征。三江源地区NDVI频度分布呈"M"型的双峰模型,柴达木盆地为频度分布最低的单峰模型,东部农业区与环湖地区相似且频度略高的单峰模型。从CV分析,高稳定性地区分布在东部农业区和环湖地区,低稳定性地区分布在柴达木盆地边缘和青海湖南部。由趋势分析可知,过去16年青海省NDVI呈波动性缓慢上升趋势,变化率为0.012·10a<sup>-1</sup>。东部农业区和柴达木盆地增加趋势显著。本文揭示了气候变化和人为因素双重作用下青海省不同功能区植被NDVI变化规律,为各区生态保护提供基础数据和科学参考。
Spatial and temporal variation of NDVI in different functional areas of Qinghai from 2000 to 2015
[J].
DOI:10.11733/j.issn.1007-0435.2017.04.003
[本文引用: 1]
<p>To understand the spatial and temporal changes in functional areas of Qinghai, Normalized Difference Vegetation Index (NDVI) time series data from 2000 to 2015 were collected based on MOD13Q1 product. The coefficient of variation and trend analysis were combined to investigate the volatility and trend characteristic of vegetation. The results showed that vegetation NDVI was higher in southeast than that in northwest, and decreased from southeast to northwest and from east to west. NDVI frequency showed a M-type bimodal distribution in Three-river Source region, and the lowest unimodal distribution was appeared in Qaidam Basin. Lake area and east agriculture area showed similar unimodal distribution. As for CV, higher volatility distributed in lake area and east agriculture area, and lower volatility distributed in the edge of qaidam basin and the south of lake area. In terms of trend analysis, vegetation NDVI showed a fluctuating increase trend with 0.012·10a<sup>-1</sup> in Qinghai and a significant increase in Qaidam Basin and east agriculture area. This study revealed the effect of climate change and human activities on the trends of vegetation NDVI in functional areas, Qinghai, which provided a base data and scientific proof for ecology protection.</p>
人类活动对中国国家级自然保护区生态系统的影响
[J].
Effects of human activities on the ecosystems of China’s national nature reserves
[J].
国土资源地质大调查成果总结报告(1999—2010年)
[R].
Summary report of the New Round Land and Resources Geological Survey(1999—2010)
[R].
Spatiotemporal evolution and prediction of land use/land cover changes and ecosystem service variation in the Yellow River basin,China
[J].
基于MODIS NDVI数据的陕西省植被绿度时空变化及人类活动影响
[J].
Spatio-temporal greenness and anthropogenic analysis in Shaanxi based on MODIS NDVI from 2001 to 2018
[J].
黄河中下游影响区生态空间和生态指数变化评估
[J].
Assessment of ecological space and ecological index changes in the affected area of the middle and lower reaches of the Yellow River
[J].
Determining the contributions of climate change and human activities to vegetation dynamics in agro-pastural transitional zone of Northern China from 2000 to 2015
[J].
基于MODIS时序的陕西省植被物候时空变化特征分析
[J].
Spatial-temporal characteristics of vegetation phenology in Shaanxi Province based on MODIS time series
[J].
1981—2015年中国西北牧区植被覆盖的时空变化
[J].
DOI:10.13866/j.azr.2018.03.14
[本文引用: 1]
我国西北牧区绝大部分属于中温带干旱半干旱地区,其植被对环境变化极为敏感,也易受人类活动干扰。近年来,西北牧区植被发生了明显变化,影响了农牧业生产和生态建设。因此,亟需进一步掌握国家生态工程和种植业结构调整措施下西北牧区植被覆盖的动态变化特性,为农牧业生产和生态建设提供理论支持。利用1981—2015年8 km × 8 km分辨率的GIMMS 3g NDVI产品,采用Theil-Sen Median趋势分析、Mann-Kendall检验与Hurst指数等方法,研究西北牧区植被覆盖的时空变化特性。结果表明:1981—2015年,西北干旱牧区植被覆盖发生了明显变化,改善面积占总面积的41.9%,其中,2006—2015年植被覆盖改善最明显,占比达到63.7%。11种植被类型均呈恢复趋势,其中栽培植被改善面积占比超过80%,而草原和草丛改善超过60%。35 a来,西北干旱牧区植被覆盖呈正向可持续发展趋势,持续性恢复和稳定不变的面积占总面积的70%以上,其中,2006—2015年持续恢复和稳定不变的面积占总面积的63.8%。国家生态工程和种植业结构调整措施对西北牧区植被覆盖有明显影响,未来该区植被覆盖以持续性恢复为主。
Spatiotemporal variation of vegetation cover in the pastoral area in northwestern China during the period of 1981—2015
[J].
1982—2012年中国植被覆盖时空变化特征
[J].
Spatiotemporal changes in vegetation coverage in China during 1982—2012
[J].
退耕还林(草)工程对渭河流域生态系统服务的影响
[J].
DOI:10.13287/j.1001-9332.202111.005
[本文引用: 1]
退耕还林(草)工程作为中国启动的重要生态补偿项目,对维护国家生态安全起着关键作用,系统剖析退耕还林(草)工程对生态系统服务的影响,有助于为健全生态补偿制度提供借鉴。本研究以渭河流域为例,基于土地利用数据、气象数据等资料,在分析退耕还林(草)工程实施以来渭河流域土地利用和生态系统服务时空变化的基础上,运用Invest模型、地理加权回归等方法,探究退耕还林(草)工程对渭河流域水源涵养、土壤保持、碳储量、生境质量等生态系统服务变化的影响。结果表明: 退耕还林(草)工程实施以来,渭河流域林草覆盖率呈波动上升趋势,林草面积增加2704.49 km<sup>2</sup>。2000—2018年间,渭河流域水源涵养、土壤保持、碳储量、生境质量均呈波动上升趋势,其中,水源涵养和固碳服务增幅较大,生境质量和土壤保持增幅较小。退耕还林(草)工程有效提升了渭河流域的水源涵养、土壤保持、固碳、生境质量等生态系统服务,但对不同地域单元生态系统服务影响强度不同。
Impacts of the returning farmland to forest (grassland) project on ecosystem services in the Weihe River basin,China
[J].
近15 a陕西省植被时空变化与影响因素分析
[J].
Vegetation spatiotemporal variation and its driving factors of Shaanxi Province in recent 15 years
[J].
DOI:10.12118/j.issn.1000-6060.2019.02.11
[本文引用: 2]
Based on NDVI from MODIS during the time period from 2000 to 2014, the spatial and temporal variation of vegetation in Shaanxi Province, China was analyzed using the methods of raster pixel trend analysis and stability evaluation. The vegetation change trends in the future were forecasted by R/S (Rescaled range analysis) method in Shaanxi Province. The correlation analysis was applied between annual temperature, precipitation and NDVI in Shaanxi Province. The results showed that the mean values of NDVI in 2000 and 2014 were 0.427 3 and 0.494 2, respectively, which indicated an NDVI increase of 0.067, or 16 % equivalently. The NDVI was increased significantly in northern region of Shaanxi and there was a negative growth in some parts of Guanzhong area, while the NDVI in southern region of Shaanxi was still maintained at a higher level and changed a little. The vegetation variation in Shaanxi Province has obvious spatial regularity. The areas with vegetation of little change accounted for 52.0 % in the whole province, while the areas with improved vegetation coverage accounted for 44.27 %, and the areas where the vegetation was degraded accounted for 3.73 %. It explained that the overall vegetation coverage in Shaanxi Province was improved in the past 15 years. The stability region of vegetation in Shaanxi Province accounted for more than 50% and the Cv value was between 0 and 0.1. The moderate area of vegetation accounted for 28% and the Cv value was between 0.1 and 0.2. The unstable area of vegetation in Shaanxi Province was less than 2% and the Cv value was greater than 0.2. It shows that vegetation condition was relatively stable in Shanxi Province in the past 15 years. The vegetation status was most stable in southern area of Shaanxi Province, southern area of Yan'an City while vegetation status varied greatly in some part of Yulin City, Xi 'an City and the southern part of Weinan City. The analysis of Hurst index showed that 44.54% area of vegetation in Shaanxi Province may face degradation of vegetation in the future. It is possibly distributed mainly in the northern area and the Guanzhong area. 49.78% area of vegetation in Shaanxi Province may face improving or degrading in the future which is mainly distributed in Yan’an City and southern area of Shaanxi Province. The annual temperature and precipitation showed an increasing trend in Shaanxi Province in the past 15 years and the increasing rates were 0.48 ℃·(10 a)-1 and 69.5 mm·a-1 respectively. The correlation analysis results showed that the annual precipitation was the main meteorological factors affecting the NDVI. The changes of vegetation in Shanxi Province had also been influenced by artificial factors such as the project of returning farmland to forest and grass, sand prevention and ecological politics.
澜沧江流域植被NDVI与气候因子的相关性分析
[J].
Analysis of the correlation between NDVI and climate factors in the Lancang River basin
[J].
DOI:10.11849/zrzyxb.2015.09.001
[本文引用: 1]
<p>Based on MODIS NDVI and meteorological data from 2000 to 2010, this study analyzed the correlation between NDVI and meteorological factors pixel by pixel in the Lancang River Basin, studied the spatial pattern of the relationship between vegetation and climate, and explored the possible influence factors. The study indicated that: 1) Both temperature and precipitation had significant impacts on vegetation growth in the Lancang River Basin, and the temperature’s effect was particularly striking. 2) The response of vegetation growth to climate change showed significant time lag effect, and the lag time shortened as the latitude went up. 3) For different vegetation types, both the orders of influence degree of meteorological factors on NDVI and the sensitive degree of NDVI to climate change were, in turn, grassland, cropland, shrub forest and woodland. For the same vegetation, the impact of temperature was greater than that of precipitation, but NDVI was more sensitive to precipitation. 4) Climate characteristics (perennial mean temperature and multi-year average precipitation) had significant impacts on the response time of NDVI to climate change. There is no significant influence of perennial mean temperature on the relationship between NDVI and temperature, but multi-year average precipitation has impacts on the degree of correlation between NDVI and precipitation.</p>
中国不同植被覆盖类型 NDVI对气温和降水的响应特征
[J].
DOI:10.16258/j.cnki.1674-5906.2020.01.003
[本文引用: 1]
基于1982—2012年植被生长季(4—10月)GIMMS NDVI 3g数据集、中国气象数据网同时期气温与降水月值0.5°×0.5°格点数据集(V 2.0)和MODIS土地覆盖产品,运用GIS和相关统计方法,对中国长时间较为稳定的8种典型植被覆盖类型(常绿阔叶林、落叶阔叶林、混交林、开放灌丛、多树的草原、草原、作物以及作物和自然植被的镶嵌体)NDVI与气温和降水的时空响应特征进行研究。结果表明,除西南部分地区和西北小部分裸地或低植被覆盖地区外,其他地区多年生长季平均NDVI与平均气温呈显著正相关;西藏南部和华南大部分地区植被NDVI与降水呈负相关,强降水会对植物生长产生一定阻碍作用,其他地区多年生长季平均NDVI与平均降水呈显著正相关;从植被覆盖类型上看,除常绿阔叶林和多树的草原外,其他植被覆盖类型与气温、降水均呈正相关关系,其中落叶阔叶林、开放灌丛和草原与气温和降水均呈较高的正相关,且对气温的响应比对降水强烈;NDVI对气温和降水的响应具有空间异质性,不同植被覆盖类型NDVI与气温和降水的相关性不同,相同植被覆盖类型NDVI在不同地区的相关性也不同,分布在西南地区的常绿阔叶林NDVI与气温呈正相关,而分布在华南、台湾地区的常绿阔叶林NDVI与气温呈负相关,暖湿西南季风可能是造成差异的原因;植被NDVI对气温、降水的响应存在时滞效应,对降水的时滞效应更为显著,不同植被覆盖类型NDVI对气温和降水的滞后期不同,在生长季末期,落叶阔叶林NDVI对气温的响应滞后期约为1个月,西南开放灌丛和华北草原带NDVI对降水的响应滞后期为1—2个月。研究结果可为中国陆地生态环境建设及保护提供理论依据。
The response characteristics of NDVI with different vegetation cover types to temperature and precipitation in China
[J].
Relative contribution of climate change and human activities to vegetation degradation and restoration in North Xinjiang,China
[J].
Annual and seasonal variation of NDVI explained by current and previous precipitation across Northern Patagonia
[J].
2001—2015年间我国陆地植被覆盖度时空变化及驱动力分析
[J].
Spatial-temporal variation and its driving forces of vegetation coverage in China from 2001 to 2015
[J].
DOI:10.12118/j.issn.1000-6060.2019.02.12
[本文引用: 1]
Vegetation coverage is a quantitative index to reflect the surface condition of plant communities, and it can indicate the regional environmental change, which has important significance for the regional hydrological, ecological conditions and the regional response of the global change. In this study, based on the MODIS-NDVI data during the period from 2001 to 2015, the mean values of vegetation coverage were Firstly calculated every three years, and the differences of distribution during each period were investigated; Secondly, the variation rate of vegetation coverage was computed at the national scale during the study period, and six variation types were defined and the distribution of different types was analyzed in order to understand the variation characteristics; Finally, the drivers of the vegetation coverage change in different areas were analyzed by computing the correlation between vegetation coverage and typical climatic factors, such as annual mean temperature, annual precipitation and annual average sunshine percentage. The results were summarized as follows: (1) The spatial distribution of vegetation coverage in China is gradually reduced from the southeast coast to the northwest inland. From 2001 to 2015, there were regional variations of the vegetation coverage which caused little difference in terms of the overall distribution trend. (2) Over the past 15 years, the vegetation coverage in China had shown an increasing trend, in particular, in the Huaihe River Basin, the North China Plain area and the Loess Plateau region it was increased significantly. While the vegetation coverage of Qinghai Tibet Plateau and Inner Mongolia plateau had little change. (3) According to the time series analysis of the vegetation coverage, the variation type can be divided into six categories, such as continuous growth, reduced-after-initially-increase, and so on. The vegetation coverage in most plain areas showed a continuous growth, while most of the forest-covered area, especially in the southwest, the vegetation coverage showed the variation characteristics of volatility during the study period. (4) By calculating the correlation coefficient between vegetation coverage and the selected climatic factors, it can be found that the vegetation coverage and precipitation were significantly and positively correlated in the Northern China Plain, Inner Mongolia, and most of the northwest area, which indicated that precipitation is the main climatic factor that affects vegetation coverage in those areas. Climate factors such as temperature, sunshine have a significant positive correlation with vegetation coverage in humid climate region, while there is a significant negative correlation in arid climate region.
基于MODIS NDVI的广西沿海植被动态及其主要驱动因素
[J].
The dynamics and main driving factors of coastal vegetation in Guangxi based on MODIS NDVI
[J].
生态文明视阈下矿业治理共同体探索——以陕西为例
[J].
Research on the mining governance community under the perspective of ecological civilization:Taking Shaanxi Province as an example
[J].
市场化方式推进矿山生态修复的实施路径与思考
[J].
Thinking and implementation approach of using market-oriented ways to promote the ecological restoration of mines
[J].
全国采矿损毁土地分布与治理状况及存在问题
[J].
DOI:10.13745/j.esf.sf.2020.10.8
[本文引用: 1]
服务“源头严控、过程严管、后果严惩”全链条管理的全国矿山遥感监测技术体系已经形成。2019年遥感监测查明:全国采矿损毁土地361.05万hm<sup>2</sup>,约占全国陆域面积的0.37%;其中,挖损土地145.93万hm<sup>2</sup>,压占土地130.67万hm<sup>2</sup>,塌陷土地84.45万hm<sup>2</sup>;在建生产矿山采矿损毁土地134.04万hm<sup>2</sup>,废弃矿山采矿损毁土地227.01万hm<sup>2</sup>。全国累计矿山环境恢复治理土地93.08万hm<sup>2</sup>。2018年度,全国新增的采矿损毁土地4.81万hm<sup>2</sup>,新增的矿山环境恢复治理土地6.52万hm<sup>2</sup>。初步分析了全国采矿损毁土地、矿山环境恢复治理土地等遥感工作现状及存在问题,提出对策建议。
Land destroyed by mining in China:Damage distribution,rehabilitation status and existing problems
[J].
基于多源遥感数据的生态系统服务功能时空演变趋势分析
[J].
DOI:10.13474/j.cnki.11-2246.2021.0101
[本文引用: 1]
研究区域生态系统服务功能的时空演变趋势,有助于揭示人类活动或气候变化对该区域生态环境的影响,从而为生态系统服务功能的保育和管理提供依据。本文以淮安市为研究区,通过在时间维上拓展生态系统服务功能重要性评估的遥感指数法,计算了2000—2018每年的水源涵养、水土保持和生物多样性维护功能,并利用Mann-Kendall非参数检验和Hurst趋势性分析方法分析了时空演变趋势,结合中高分辨率遥感数据解译探索了变化原因。研究结果表明:①淮安市大部分区域生态系统服务功能呈显著增加趋势,其中水源涵养和生物多样性的增长趋势持续性较弱,而水土保持增长趋势持续性较强;②生态系统服务功能增加区域主要发生在耕地、林地等植被覆盖区域,减少区域主要发生在建筑用地等非生态用地区域;③淮安市耕地和林地等植被覆盖区域占比基本不变,甚至随着建筑用地占比的增加而稍有减少,生态系统服务功能增加的主要原因可能在于植被活力的增强,具体表现为植被绿度和植被生产力的增加。
Spatiotemporal evolution of ecosystem service functions based on multi-source remote sensing data
[J].
DOI:10.13474/j.cnki.11-2246.2021.0101
[本文引用: 1]
Investigating the spatiotemporal evolution of ecosystem service function is conducive to reveal the impact of human activities or climate change on eco-environment, which could also provide a basis for the conservation and management of ecosystem. In this study, remote sensing methods for evaluating ecosystem service function are improved to depict temporal variation. They are subsequently employed to evaluate the functions of headwater conservation, water and soil conservation, and biodiversity maintenance annually from 2000 to 2018 over Huai'an, China. Mann-Kendall non-parametric test and Hurst trend analysis methods are used for spatiotemporal evaluation. The spatiotemporal evaluation is further explored by combining with the interpretations of higher resolution remote sensing data. Results demonstrate that:① The ecosystem service functions of most regions in Huai'an show a significant trend of increasing, among which the increasing trend of headwater conservation and biodiversity maintenance is weak while that of water and soil conservation is strong. ② The increasing trend mainly occurs in cultivated land, woodland, and other vegetated areas. In contrast, the decreasing trend mainly occurs in non-ecological areas such as building land. ③ The area proportion of cultivated land, forestland, and other vegetated areas in Huai'an is basically unchanged, and even slightly decreased with the increase of building land. The significant increase of ecosystem service function in this area may be chiefly due to the enhancement of vegetation vitality, which is represented in the increase of vegetation greenness and vegetation productivity.
陕西省矿山地质环境治理现状及变化趋势分析
[J].
Mine geological environment governing status quo and variation trend analysis in Shaanxi Province
[J].
陕西绿色矿山建设初见成效
[EB/OL].(
The construction of green mines in Shannxi has achieved initial results
.[EB/OL].(
基于GF-1影像的耕地地块破碎区水稻遥感提取
[J].
DOI:10.11873/j.issn.1004-0323.2019.4.0785
[本文引用: 1]
耕地地块破碎区水稻遥感提取是作物监测研究的热点问题之一。以苏州市高新区为例,通过挖掘关键物候期水稻与下垫面水体光谱特征组合差异,基于分蘖期与齐穗期两景16 m分辨率的GF-1 WFV数据,构建归一化差值植被指数(NDVI)差值法、归一化水体指数和比值植被指数(NDWI-RVI)差值法提取水稻分布,并深入探究了水稻面积提取精度及空间重合度影响因素。结果显示:与非监督分类和监督分类方法相比,植被指数差值法水稻识别精度贡献率可提升30%以上,NDVI差值法提取水稻种植面积的精度、空间重合度、制图总体精度和Kappa系数分别为86.2%、66.1%、92.2%和0.72;NDWI-RVI差值法上述指标分别高达95.5%、78.4%、93.5%和0.846,实现了利用少量中高分辨率遥感影像精确提取耕地地块破碎区水稻分布的目的,可实际服务于太湖地区农业生产及相关决策支持。
Study on extraction of paddy rice planting area in low fragmented regions based on GF-1 WFV images
[J].
生态建设背景下陕西省植被覆盖时空变化及其影响因素研究
[J].
Temporal and spatial variation of vegetation cover and its influencing factors in Shaanxi Province in the context of ecological construction
[J].
生态恢复背景下陕北地区植被覆盖的时空变化
[J].
Spatio-temporal variations of vegetation cover in northern Shaanxi Province under the background of ecological restoration
[J].
