

0 引言
植物物候,是指植物长期受温度、降水、光照等环境因素及生物因素影响而出现的以年为周期的自然节律现象,包含植物的萌芽、开花、叶片舒张、果实成熟、果实脱落、叶片变色、落叶等现象[1]。我国植被物候的研究方法主要有实地观测、控制实验、模型模拟和遥感监测4种方式[2]。传统的物候实地观测方式多采用目视观测法,其优势在于客观性、准确性以及细节性,可以针对单种植物,详细记录其生长发育过程的每个物候期,而该方式的劣势在于观测站数量有限,分布稀疏,只能获得零散的点状数据,且观测工作的人力资源耗费较大。近年来发展的自动拍照技术可有效节约人力资源,但仍不能解决物候期大面积观测的问题。控制实验方法周期短、易操作,但同样存在空间尺度小的局限性。模型模拟方法通过对物候的发生机制进行模拟,以实现未来物候变化的预测,但其模型参数缺乏实际意义,且模拟结果的不确定性较大。而基于遥感的物候监测突破了传统方式在空间上的限制,能够实现大尺度范围内不间断地连续探测,获得较为准确的面状物候数据,为分析物候的空间分布提供基础。
归一化植被指数(normalized difference vegetation index,NDVI)能够反映植被的生长状态,是最常用于植被物候期遥感提取的植被指数之一。在遥感传感器对地观测、数据传输以及处理的过程中,由于传感器自身性能、大气气溶胶、云层、卫星观测角度、太阳入射角度等因素的干扰,获取的数据存在一定的噪声。所以为提高数据的准确性,通常会采用最大值合成法等合成方法对植被指数序列进行处理,合成多日数据产品,然而数据的时间分辨率也因此下降。物候期的遥感提取包含植被指数时间序列数据的拟合重建以及对拟合数据提取物候参数2个过程。拟合重建是指对时间序列数据进行平滑拟合,能够进一步降低误差,常用的重建方法有以下几类: 时间插值法、时间滤波器法、时间函数拟合法、时域深度学习模型法、基于频域的方法和时域频域混合方法[3]。常见的时间插值法有最佳坡度系数截取法(best index slope extraction,BISE)[4]、数据同化法(data assimilation,DA)等; 时间滤波器法主要包括Savitzky-Golay(S-G)滤波法[5]、均值迭代滤波器法(mean value iterative,MVI)等; 时间函数拟合法主要包括非对称高斯函数拟合法(asymmetric gaussians,A-G)和双逻辑斯蒂函数拟合法(double logistic,D-L)等; 基于频域的方法主要包括快速傅里叶变化法(fast Fourier transform,FFT)、小波变换法(wavelet transform,WT)和谐波分析法(harmonic analysis of NDVI time-series,HANTS)[6]等; 时域频域混合方法主要有时空滤波器(temporal spatial filter,TSF)、时空张量补全法(spatio-temporal tensor,ST-Tensor)等。李军等[7]以重庆为研究区域,分别使用Whittaker平滑法(Whittaker smoother,WS)、S-G滤波法、A-G法和D-L法4种重建方法对遥感数据进行拟合去噪,结果表明S-G和WS重建后噪声少,S-G的曲线最为平滑,而A-G与WS的保真性较好。物候参数提取是基于上一步重建的时间序列数据,提取出植被生长过程中的几个重要时间节点,如生长季始期和终期等。常用的物候期提取方法有阈值法、导数法、滑动平均法等[8]。阈值法指的是当平滑后的植被指数时间序列达到特定的阈值时,认为该点为物候阶段的发生时间,通常所使用的阈值包含固定阈值和动态阈值2种类型。固定阈值使用的是单一的固定指标值,如植被指数的特定值; 而动态阈值通常使用的是从平滑后的植被指数时间序列中计算的度量,如植被指数序列的斜率、长期平均值或中位数等[9]。导数法,顾名思义是对平滑后的植被指数序列求一阶或二阶导数,将导数的最值或极值视为关键物候节点,所提取出的物候期具有一定的物理意义。滑动平均法则是选取合适的滑动平均窗口大小,将原始植被指数时间序列与平滑后的植被指数曲线的交点视为关键物候节点。
影响植物物候变化的因素有温度、光照、水分和生长调节剂等[10]。对于植物物候的研究主要集中于柴达木盆地、青藏高原、黄土高原、西北干旱区等地区。在不同的研究区域,由于水热条件等其他环境因素的影响,植被物候对于气温和降水的响应也有所不同,可以划分为气温导向型区域和降水导向型区域。许多研究表明,在北半球温带地区,植物普遍存在返青期提前、枯黄期推迟的变化趋势以适应全球变暖的气候变化[11]。Han等[12]发现陕西省北部的植被返青期主要受2月气温影响,枯黄期主要受11月降水影响; 陕西省南部的植被返青期主要受3月降水影响,枯黄期主要受10月气温影响。谭静等[13]分析了武汉大学樱园日本樱花1979—2018年40 a内的始花期和落花期变化及其与各气象要素之间的关系,发现樱花的始花期与落花期在20世纪80—90年代期间有明显的提前,在20世纪90年代末至今无明显变化趋势,与全球变暖停滞期相吻合。Zhang等[14]研究了中国中纬度地区的长期物候趋势,发现季前温度对各种植被类型的物候都存在较强的影响,而季前降水对各种植被类型的物候的影响有所不同。赵心睿等[15]指出北方地区林地的返青期主要受冬末春初的气温和降水影响,呈负相关关系; 草地的返青期主要受春季气温和短波辐射影响,与前者呈负相关关系,与后者呈正相关关系。张港栋等[16]发现蒙古高原的季前昼夜非对称变暖会导致植被春季物候提前,且最低温相较于最高温,对春季物候的影响程度更大、范围更广; 对于不同植被类型的春季物候,白天与夜间变暖的影响程度也有所区别。
植被的春季物候开始时间对生态系统中的碳循环有着重要的影响[17],北京市在积极稳妥地发展城市化的同时也在积极推进城乡绿化,筑牢绿色生态屏障。本研究选取北京市植被春季物候为研究对象,利用2000—2022年MODIS的NDVI时间序列数据对北京市的春季物候进行提取,分析其时空变化格局,并深度探讨其对温度与降水变化的响应机制。
1 研究区概况及数据源
1.1 研究区概况
本研究以同时推进高速城市化进程和园林绿化建设的典型城市北京市为研究区域。北京市地处华北平原北部,其东部与天津市相连,其余均与河北省相连,中心位于39°56'N,116°20'E,其范围在39°27'~41°05'N,115°25'~117°30'E之间。北京全市共有16个区,总面积达到16 410.54 km2,其中山区面积约占3/5,平均海拔为43.5 m。北京的西部、北部、东北部为山区,海拔大致在1 000~1 500 m之间,分别分布着西山、军都山、燕山等山脉,东南部为平原地区,地形平坦,海拔在20~60 m之间。
从纬度来看北京市位于暖温带,从海陆距离来看北京属于内陆城市,气候特征表现为夏季温度高降雨量大,冬季温度低降雨量小,4个季节的区分性较强,存在明显的垂直地带性变化。东南部地势低的区域年平均气温为10~14 ℃,年降水量在500~600 mm之间。西部、北部、东北部的山地处降水量与地形有很大相关性,背风坡的年降水量明显少于迎风坡的年降水量,温度则与海拔相关,海拔800 m以上的地区年均温在5 ℃以下。
北京地区植被种类多样化,暖温带落叶阔叶林是该地区的优势物种。北京山区典型的植物群落有胡桃楸阔叶林、蒙古栎阔叶林、油松针叶林、针阔叶混交林、灌丛和草甸[18],表现出沿海拔垂直分布的特点。
1.2 数据源及其预处理
本文所选择的遥感数据为MODIS的3级数据产品MOD13Q1数据集,数据的空间分辨率为250 m,时间序列数据的时间间隔为16 d。植被指数是通过16 d内选取所有采集的数据中低云、低卫星观测角以及植被指数最大的像素值作为最佳像素值,最终合成NDVI植被指数产品。该产品的时间范围为2000年2月18日至今。
本研究使用的气象数据为中国气象数据网(
本研究中使用的地物分类数据为全国年度地表覆盖数据集CLCD产品[19],该产品的时间分辨率为1 a,空间分辨率为30 m,包含农田、森林、灌木、草地、水体、冰雪、荒漠、不透水面和湿地9种地物的分类结果。CLCD基于Google地球引擎(Google Earth Engine,GEE)平台,以Landsat影像为数据源,提供了1985—2022年中国逐年土地覆盖信息。
2 研究方法
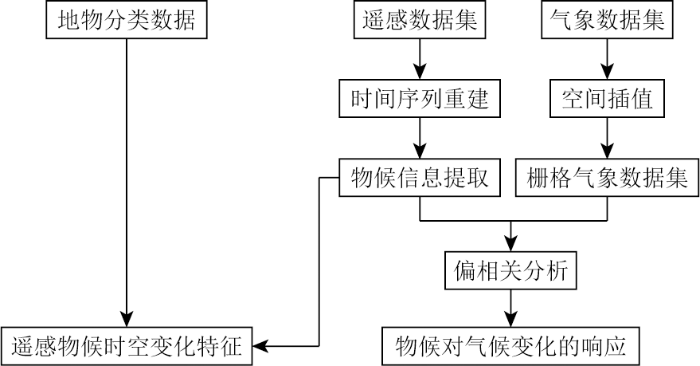
本文主要基于长时间序列遥感数据和气象站观测气象数据,开展物候变化与气候变化在时空上的相关关系研究,主要包括以下2个方面的内容:
1)植被物候时空变化特征分析。以研究区长时间序列的遥感植被指数数据为基础,提取出植被的春季物候,并分析植被物候的时空变化特征。
2)植被物候对气候变化的响应研究。使用偏相关分析、线性回归模型、t检验等分析方法,分析植被的春季物候与气温和降水的相关关系,进行气候变化背景下植被的适应性分析。
本研究技术路线如图1所示。
图1
2.1 植被指数时间序列重建
子区间高斯拟合的公式为:
式中:
全局拟合模型公式为:
式中:
2.2 遥感植被物候趋势检验
式中:
3 结果与分析
3.1 遥感物候时空变化特征
3.1.1 春季物候年变化趋势
计算2000—2022年所提取的遥感春季物候的平均值,分析其年际变化总特征,结果如图2所示。
图2
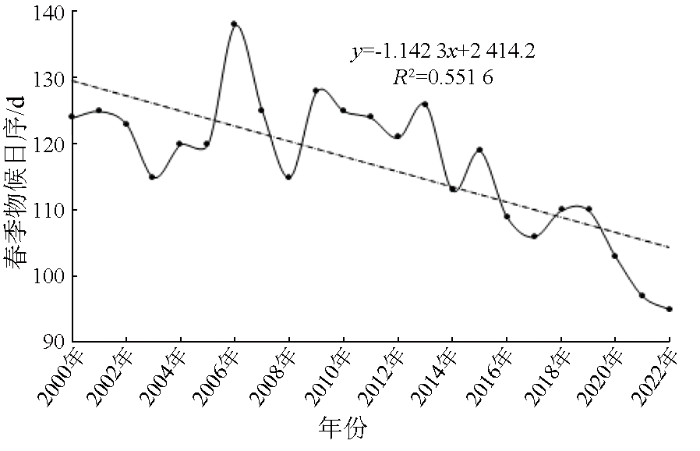
图2
遥感春季物候年际变化图
Fig.2
Interannual variation of spring phenology by remote sensing
从图中可以看出,从2000年至2022年,提取的遥感春季物候有一定的波动,总体呈提前的趋势,提前的幅度为1.14 d/a,R2为0.551 6。其中,2002—2008年春季物候的波动最为剧烈; 2013年之后,春季物候呈现出明显的提前趋势。2006年的遥感春季物候最晚,为第138天(5月18日)。据相关文献记载,2006年1月,北京市遭遇极端强冷、降雪天气,导致北京西站多辆客车延误,北京西站也启动了红色预警方案[26]。冬季极端天气对植被造成了一定的冻害,进而使得植被的春季物候也相应延迟。
从年度地表覆盖CLCD产品中提取出农田、森林、灌木、草地4种植被类型的分布,分别对这4种不同地物类型的春季物候进行统计,得到的结果如图3所示。从图中可以看出,农田的春季物候最晚,均值在第130天; 森林的春季物候最早,均值为第107天; 灌木和草地的春季物候居于中间,均值分别为第117天和119天,二者的时间和走势都十分相似。Xu等[27]对青藏高原的返青期研究发现,在所有植被类型中,森林的返青期发生最早,其次是灌木和草甸,最后是高山草原,与本文的分析结果相类似。除农田外,其他3种地物的春季物候均在2006年存在一个明显的峰值,与图2中总的春季物候均值的情况一致。4种地物的春季物候均呈现出提前的趋势,且2019年之后,4种地物春季物候之间的差距也在缩小。
图3
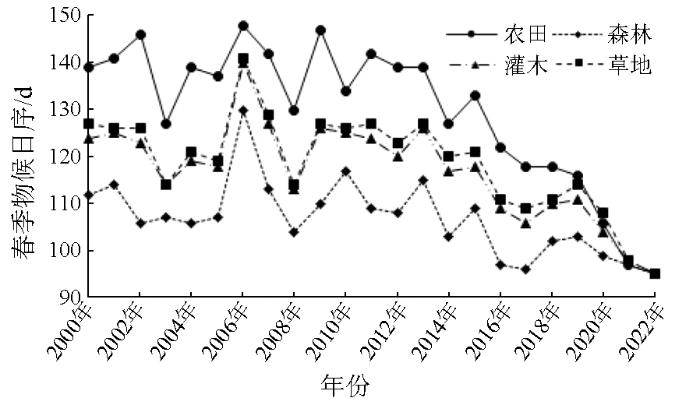
图3
四种地物春季物候的年际变化图
Fig.3
Interannual variation of spring phenology in four vegetation types
逐像素对2000—2022年23 a的遥感春季物候时间序列数据进行趋势分析,以获得遥感春季物候年际变化趋势的空间分布,使用M-K趋势检验法对物候期进行趋势分析,得到的结果如图4(a)所示。北京市2000—2022年的春季物候在绝大部分区域呈现出提前的趋势,占总像元数的96.1%。北部、西南部、东北部地区春季物候的提前普遍在1 d/a以内; 延庆区中部(地势较周围偏低的区域)提前趋势在2~3 d/a左右; 东南部平原地区春季物候推迟和提前区域相间分布,提前区域的提前趋势较大,在3~4 d/a左右,推迟区域的推迟趋势在1~2 d/a左右。对趋势分析的结果进行置信度为95%的显著性检验,结果如图4(b),其中深色的像素代表通过了显著性检验,浅色的像素代表没有通过显著性检验。图中表现出提前趋势的像元中,有69.0%的像元通过了显著性检验; 而表现出推迟趋势的像元中,只有8.1%的像元通过了显著性检验。北京市北部(除怀柔区北部外)绝大多数春季物候推迟1 d/a左右的区域通过了显著性检验,西南部大部分区域没有通过显著性检验。2000—2022年,地物覆盖类型发生变化的像素占总像素的19.0%,部分地区春季物候的变化趋势可能与多年来植被覆盖类型的变化有关。
图4
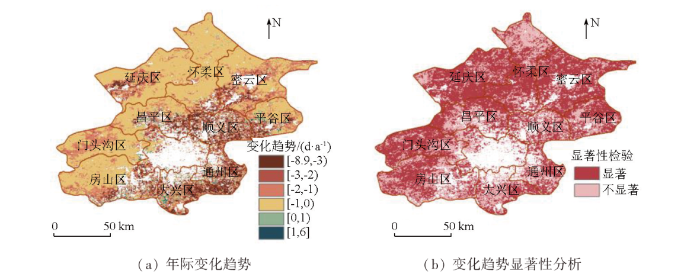
图4
北京市春季物候年际变化趋势分析
Fig.4
Analysis of interannual variation trend of spring phenology in Beijing
3.1.2 春季物候空间变化特征
对2000—2022年的春季物候图像求取平均值,得到的结果如图5所示,从图中可以看出,北京地区的春季物候主要集中在第90~150天(4月初到5月底)之间,大兴区、通州区、延庆区中部、顺义区以及密云区南部的春季物候较迟,大致在第120~150天(5月初到5月底)左右,而西部、北部、东北部地区的春季物候则比较早,大致在第90~120天(4月初到4月底)之间。可以看出,春季物候的空间分布规律与北京市的地形有很大的关联性,西部、北部、东北部地区三面环山,地势较高,这些区域的春季物候普遍比较早,而平原地区的春季物候则普遍比较迟,另外延庆区中部海拔较周边山区低,此处的地物类型以农田为主,因此春季物候也比周边山区更迟。根据图3的统计,森林的春季物候普遍早于农田、灌木和草地。在高海拔的山区,木本类植物更容易密集、成片地分布,此处对应的植被指数值也更大; 而在平原地区,城市化进程快,受人类活动的干扰,植被的覆盖率更低,草本植物占优势。
图5
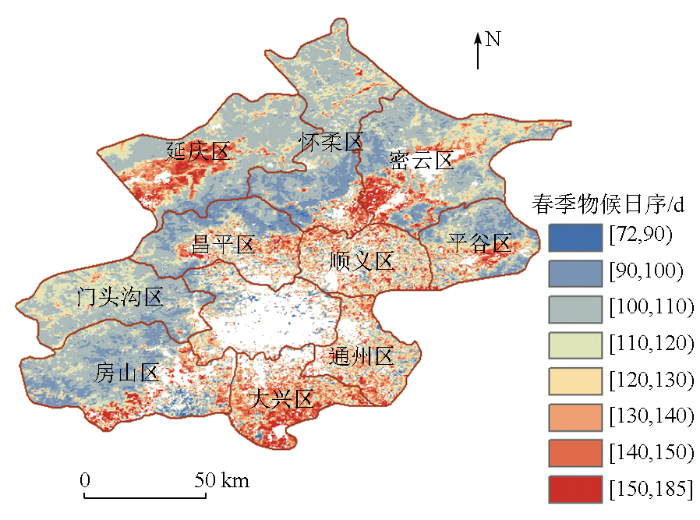
图5
北京市春季物候多年均值空间分布
Fig.5
Spatial distribution of perennial mean value of spring phenology in Beijing
3.2 植被春季物候对气候变化的响应
3.2.1 春季物候与气象因子的年平均相关性
以年为步长,逐像素对春季物候时间序列、气温时间序列和降水时间序列数据进行偏相关系数计算并对其进行T检验,将通过置信度为99%的显著性检验的像素定义为极显著相关,将通过置信度为95%的显著性检验的像素定义为显著相关,将其他像素定义为不显著相关。最终得到春季物候与气象因子的空间相关分布图(图6)。从图6(a)中可以看出,绝大多数像元春季物候与气温之间的相关性没有通过显著性检验,在显著、极显著相关的像元中,正相关的像元比例更大,占总像元的5.56%,主要分布在大兴区南部、门头沟区、延庆区中部、密云区南部以及密云水库四周。少数显著、极显著负相关的像元分布在房山区东部,占总像元的1.47%。总的来说,春季物候与气温之间的相关性不大,但在河流、水库等水域附近,春季物候与气温之间存在着显著的正相关关系。对4种植被类型进行统计,森林的春季物候与年均温呈正相关与负相关的像元数量相当,且绝大多数像元都没有通过显著性检验; 而其他3种植被类型的春季物候与年均温呈正相关的像元占将近七成。根据海拔划分,海拔在1 000 m以上的地区春季物候与年均温呈正相关的像元比例最大,为70%。从图6(b)中可以看出,春季物候与年降水之间的相关关系比其与气温之间的相关关系要更强一些,且普遍表现为负相关,即随着年降水量的增加,春季物候表现出提前的趋势。其中,春季物候与降水显著、极显著负相关的像元占总像元的13.1%,分布在门头沟区、房山区西部、昌平区西部及北部、延庆区南部、怀柔区南部、密云区南部以及通州区东北部,涵盖了年降水量最高(600 mm左右)和最低(300 mm左右)的区域。春季物候与降水呈显著、极显著正相关的像元占总像元的4.05%,分布在北京市南部及中部,这些区域的年降水量大致在400~500 mm之间。对4种植被类型进行统计,森林的春季物候与年降水呈负相关的像元比例最大,为89%; 草地与灌木春季物候与年降水呈负相关的像元比例次之,为80%; 农田的春季物候与年降水呈负相关的像元比例最小,为68%。根据海拔划分,海拔在100 m以下区域的春季物候与年降水呈负相关的像元比例最小,为60%。
图6
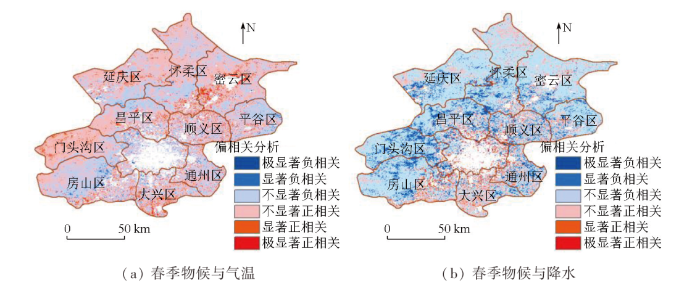
图6
春季物候与气象因子的偏相关分析
Fig.6
Partial correlation analysis between spring phenology and meteorological factors
3.2.2 春季物候与气象因子的月平均相关性
春季物候主要反映了植被对于其生长季开始前6个月内气象条件的响应情况。分别对上一年11—12月及当年1—4月的月平均气温和月降水量与春季物候进行偏相关分析,结果如表1所示。表中,*表示相关性通过了0.05的T检验,**表示相关性通过了0.01的T检验。总体来看,北京市11月—次年4月的气温与春季物候存在着负相关的关系,即随着气温的升高,春季物候表现出提前的趋势。其中12月气温与春季物候的负相关关系通过了0.01的显著性检验。北京市的降水集中在夏季,11月—次年4月降水量都比较少,在2~20 mm左右,降水量对春季物候的影响较为微弱。
表1 春季物候与11—4月气温、降水量的相关性分析
Tab.1
| 月份 | 气温 | 降水 |
|---|---|---|
| 11月 | -0.231 | 0.047* |
| 12月 | -0.664** | -0.033 |
| 1月 | -0.208 | 0.096 |
| 2月 | -0.234 | -0.265 |
| 3月 | -0.248 | -0.039 |
| 4月 | -0.351 | -0.195 |
以月为步长,从4月开始往前依次计算3—4月、2—4月、1—4月、上一年12月—4月、上一年11月—4月的月平均气温和月平均降水,并分别与春季物候进行偏相关分析,得到的结果如表2所示。从表中可以看出,春季物候与气温和降水的月累计平均值普遍呈现出负相关关系,其中与气温的相关性强于与降水的相关性。除4月和3—4月外,其他月份的气温月累积平均值与春季物候的负相关关系通过了置信度95%的显著性检验,月累积气温每升高1℃,春季物候平均提前3.28 d。徐韵佳等[28]对1963—2014年国内10个物候站点的163种植物的展叶始期资料进行分析,发现冬季冷激量降低将导致植物展叶始期温度敏感度降低,而春季气温变率降低将导致植物展叶始期温度敏感度升高。
表2 春季物候与气温和降水的累积月相关性
Tab.2
| 月份 | 气温 | 降水 |
|---|---|---|
| 4月 | -0.351 | -0.195 |
| 3—4月 | -0.374 | -0.135 |
| 2—4月 | -0.498* | -0.226 |
| 1—4月 | -0.606** | -0.140 |
| 上一年12月—4月 | -0.562** | -0.117 |
| 上一年11月—4月 | -0.512* | -0.098 |
4 讨论与结论
4.1 讨论
在时间尺度上,发现北京市春季物候在2000—2022年呈现出明显的提前趋势,与近几十年来全球变暖加剧的趋势吻合,与前人在不同区域的研究结果一致[29-30]。在空间尺度上,发现春季物候的时间与地形、海拔有一定的关联。山区春季物候开始时间范围在第90~120天内(四月初至四月底); 平原地区春季物候较迟,在第120~150天内(五月初至五月底),而这种规律与不同种类植被的垂直地带性分异规律吻合。通过对农田、森林、灌木、草地4种不同植被类型的春季物候进行统计,发现森林的春季物候发生得最早,草地和灌木次之,农田的春季物候发生时间最晚。此外,距离中心城区的远近对春季物候的发生也有一定的影响,在一定范围内,距离中心城区越远,春季物候的发生时间越晚,与卜亚勤等[31]的研究结果类似。而这种规律可能与北京市的热岛效应相关,孟丹等[32]的研究指出,2019年,北京市热岛区的植被春季物候比非热岛区的植被春季物候提前。
北京市春季物候对气象变化的响应分析表明,春季物候与气温和降水的相关性存在较大的地域性差异,且在不同尺度上的表现能力不同。在年尺度上,年均降水对春季物候的贡献大于年均气温。春季物候与年均温的相关性较弱,多数像元呈现出正相关关系,其中在河流、水库等水体附近,春季物候与年均温的正相关关系更强,通过了显著性检验; 绝大多数像元的春季物候与年均降水存在负相关关系,其中通过了显著性检验的区域分布在中心城区的西南部、西部、东部和北部。充足的水分有利于植被的萌芽。在4种植被类型中,森林的春季物候受年均温的影响最弱,受年降水的影响最强; 农田受年降水的影响最弱。从地形上看,海拔100 m以下地区的春季物候与年降水的负相关性最不显著,而海拔1 000 m以上地区的春季物候与年均温的正相关性最强。在100~1 000 m范围内,海拔越高,春季物候与年降水的负相关性越高。春季物候与年均温和年降水的相关性在空间上的异质性与植被类型、海拔高度以及水热条件有一定的关联。Kloos等[33]将NDVI与地表温度(land surface temperature,LST)进行相关性分析以研究植被受水分胁迫的情况,实验表明与农田和草地相比,森林具有更大的蓄水能力和更强的抗旱能力。在月尺度上,月均气温对春季物候的贡献大于月均降水。上一年11月至今年4月的月均温及月累计平均气温与春季物候均呈负相关关系,其中上一年12月的相关关系最强。张港栋等[34]研究发现,蒙古国植被的返青期随着气温的升高呈现出提前的趋势,且在冬季是最高气温和气温日较差的影响更大,而在春季则是最低气温的影响更大。Shen等[35]对青藏高原淡水沼泽的植被物候期研究发现,在海拔4 000 m以下的地区,春季夜间气温的升高更显著地推进了植被生长季开始期的提前。在春季植物的萌芽离不开酶的催化作用,在一定范围内,温度越高,酶的活性越大,导致植物的展叶期、开花期提前。在冬季植物打破休眠状态需要一定的冷却单位累积,所以冬季温度越高,植物的萌芽期可能出现推迟的趋势[36]。
4.2 结论
本文实现了基于A-G滤波法和动态阈值法的2000—2022年北京市遥感春季物候的提取; 利用M-K趋势检验法实现了春季物候的时间变化特征分析; 分析了春季物候空间分布特征; 探究了不同植被种类春季物候的差异; 并引入偏相关分析方法,分别在年尺度和月尺度上实现了春季物候对温度和降水的响应分析。主要结论有: ①2000—2022年北京地区植被的春季物候呈提前趋势,变化速率为1.14 d/a; ②不同植被类型的春季物候呈现层级差异,其中森林的春季物候最早,为第107天; 灌木和草地次之,分别为第117天和第119天; 农田最晚,为第130天; ③年均气温对春季物候的影响存在显著的区域差异,年均降水的增加更显著地推进了春季物候的提前; ④月尺度上,11月、12月、1月、2月气温对春季物候的影响最大,随着冬季气温的上升,植物春季物候表现出提前的趋势。本研究探讨了全球变暖气候变化背景下,植被物候期的变化规律,为指导生产提供了参考。
参考文献
植物物候对气候变化的响应
[J].
Responses of plant phenology to climatic change
[J].
中国植被物候研究进展及展望
[J].
Vegetation phenology response to climate change in China
[J].
High-quality vegetation index product generation:A review of NDVI time series reconstruction techniques
[J].
The best index slope extraction (BISE):A method for reducing noise in NDVI time-series
[J].
A simple method for reconstructing a high-quality NDVI time-series data set based on the Savitzky-Golay filter
[J].
Reconstructing cloudfree NDVI composites using Fourier analysis of time series
[J].
重庆地区MODIS/NDVI时间序列数据重建研究
[J].
DOI:10.13249/j.cnki.sgs.2017.03.014
[本文引用: 1]

基于时间分辨率为逐月、空间分辨率为1 km的MODIS/NDVI数据,利用WS、S-G、A-G和D-L这4种重建方法对重庆市2010~2014年间历年逐月的NDVI时间序列数据进行重建,并采用视觉对比、分地类像元对比、相关系数(R)、均方根误差(RMSE)、赤池信息准则(AIC)和贝叶斯信息准则(BIC)对4种重建结果进行了评价。结果表明:S-G和WS重建后噪声少,S-G的曲线最为平滑,A-G与WS保真性较好。其中,A-G的R>0.8和RMSE
The reconstruction of MODIS/NDVI time series data in Chongqing
[J].
DOI:10.13249/j.cnki.sgs.2017.03.014
[本文引用: 1]
Chongqing is located in mountainous area where the vegetation is rich. It is greatly affected by the fog all year round. As a result, the noise of remote sensing image is serious and the affected area is large which have a great influence on the accuracy of related application.NDVI is one of the most important vegetation index which has an important role in the study of global climate change, vegetation change etc. In this paper, the MODIS/NDVI data are used, the time resolution of the data is monthly and the spatial resolution is 1km. The NDVI data of Chongqing city from 2010 to 2014 are reconstructed by four smoothing techniques: WS, S-G, A-G and D-L. The results are evaluated by visual comparison, pixel contrast of different land use types,correlation coefficient(R),the root mean square error (RMSE), Akaike Information Criteria (AIC) and BayesianInformation Criteria (BIC). In the visual contrast analysis, the results indicate that the noise of S-G technique and WS technique is lower than the others. In the pixel contrast of different land use types, the curve of S-G technique is the smoothest.In the fidelity analysis, R and RMSE are used to evaluate of the original data and data reconstructed by four technique, the result of A-G technique and WS technique is better. It also indicates that the A-G technique have the widest distribution, the value of R larger than 0.8 accounts for 89.41% of the total area and the value of RMSE smaller than 0.05 accounts for 66.40% of the total area. The WS technique is better than the other two techniques, accounting for 72.76% and 59.37% of the total area respectively. In the model effect analysis, the AIC and BIC evaluation results of the A-G technique are the best. The evaluation results of WS techniqueis good in Western Chongqing where the BIC evaluation results of other threetechniques are relatively poor, the result of S-G method is the worst.
植被物候参数遥感提取与验证方法研究进展
[J].
Recent advances in remote sensing of vegetation phenology:Retrieval algorithm and validation strategy
[J].
A review of vegetation phenological metrics extraction using time-series,multispectral satellite data
[J].
植物物候遥感监测精度影响因素研究综述
[J].
DOI:10.18306/dlkxjz.2016.03.005
[本文引用: 1]
基于植物物候的遥感监测对于研究植被对气候变化的响应具有重要的科学价值。本文在阐述植物物候遥感监测原理及其通用技术流程的基础上,分别从植被类型及其所处的地理条件、遥感数据源及其预处理、植物物候遥感识别方法和植物物候遥感监测结果评价4个方面分析了影响植物物候遥感监测精度的因素,并针对当前研究中存在的不足,探讨了提高植物物候遥感监测精度的可行性途径,即建立高分辨率的近地面遥感定点观测及数据共享网络,发展普适性更强的卫星遥感时序数据去噪及植被指数曲线重建方法,寻求稳定性更高的植物物候期遥感识别方法,探索综合运用地面观测、遥感监测与模型模拟实现物候观测空间尺度拓展的可能性。
Review of influencing factors of accuracy of plant phenology monitoring based on remote sensing data
[J].
DOI:10.18306/dlkxjz.2016.03.005
[本文引用: 1]
Monitoring plant phenology with remote sensing data has important scientific value for studying the response of vegetation to climate change. A comprehensive analysis on the influencing factors of accuracy of plant phenology estimation based on principles and general technical processes of remote sensing application in vegetation monitoring was carried out by taking into account the following four aspects: the specific vegetation type and its geographical conditions; remote sensing data and pre-processing; techniques used to identify plant phenometrics; and evaluation of satellite-derived plant phenometrics. Potential methods for improving the accuracy of plant phenology monitoring are thoroughly discussed. These include: building high-resolution near-surface sensor-derived phenology observation and sharing network; developing universally applicable methods for noise removal of satellite remote sensing time-series data and reconstruction of vegetation index curves; searching more stable methods to estimate plant phenology; and exploring the possibility of synthesizing ground-based observation, remote sensing monitoring, and model simulation to achieve the spatial scaling-up of phenometrics.
Remote sensing of temperate and boreal fo-rest phenology:A review of progress,challenges and opportunities in the intercomparison of in-situ and satellite phenological metrics
[J].
Vegetation phenological changes in multiple landforms and responses to climate change
[J].
武汉大学樱花花期长度特征及预报方法
[J].
Characteristics and forecast of flowering duration of cherry blossoms in Wuhan University
[J].
Long-term vegetation phenology changes and responses to preseason temperature and precipitation in northern China
[J].
北方地区典型林草地物候时空变化特征及其对气象因子的响应
[J].
Spatio-temporal variations of typical woodland and grassland phenology and its response to meteorological factors in Northern China
[J].
2001—2020年蒙古高原昼夜非对称变暖对植被返青期的影响
[J].
DOI:10.12118/j.issn.1000-6060.2022.395
[本文引用: 1]
基于2001—2020年归一化植被指数(NDVI)、增强型植被指数(EVI)2种遥感植被指数以及蒙古高原94个气象站点的月最高、最低温和降水量数据,利用累积NDVI的Logistic曲线曲率极值法和动态阈值法2种物候识别方法提取蒙古高原植被返青期,分析蒙古高原昼夜非对称变暖的时空变化及其对植被返青期的影响。结果表明:(1) 2001—2020年蒙古高原生长季开始前6个月(上一年11月—当年4月)平均最高温[0.7 ℃·(10a)<sup>-1</sup>]和最低温[0.3 ℃·(10a)<sup>-1</sup>]均呈上升趋势,最高温的变暖速率是最低温的2.3倍。(2) 季前昼夜非对称变暖对植被返青期均产生提前作用,但与最高温相比,最低温对返青期的影响程度更大,且影响范围更为广泛。(3) 季前昼夜非对称变暖对不同植被类型返青期产生不同影响,白天变暖对灌丛、农田和稀疏植被返青期的影响更明显,夜间变暖对森林和草地返青期的影响更强,特别是森林地区(25.5%)。研究白天和夜间非对称变暖对蒙古高原植被物候的影响,对揭示温度对春季植被物候的影响机制有重要意义。
Effects of asymmetric warming of daytime and nighttime on the start of growing season on the Mongolian Plateau from 2001 to 2020
[J].
DOI:10.12118/j.issn.1000-6060.2022.395
[本文引用: 1]
Two phenological identification methods, namely, the logistic curve curvature extreme value method and the dynamic threshold method of cumulative NDVI, were used to extract the data based on the normalized difference vegetation index (NDVI) and enhanced vegetation index remote sensing vegetation indices from 2001 to 2020, as well as the highest temperature, the lowest temperature, and precipitation data of 94 meteorological stations in the Mongolian Plateau. The temporal and spatial changes of the Mongolian Plateau’s asymmetric circadian warming and its impact on the start of growing season were analyzed. The research shows the following: (1) The average maximum temperature [0.7 ℃·(10a)-1] and the minimum temperature [0.3 ℃·(10a)-1] in the preseason 6 months (November of the previous year to April of the current year) in the Mongolian Plateau from 2001 to 2020 both showed an upward trend, and the warming rate of the highest temperature was 2.3 times that of the lowest temperature. (2) The asymmetric warming of the preseason day and night has an early effect on the start of growing season; however, compared with the highest temperature, the lowest temperature has a greater impact on the start of growing season, and the impact range is wider. (3) The preseason asymmetrical warming of day and night has different effects on the start of growing season of different vegetation types. The effect of daytime warming on the start of the growing season of shrubs, farmland, and sparse vegetation is more obvious, and the effect of nighttime warming on the start of the growing season of forest and grassland is more obvious, especially in forest areas (25.5%). Studying the effects of daytime and nighttime asymmetric warming on vegetation phenology on the Mongolian Plateau is of great significance to reveal the mechanism of temperature effects on vegetation phenology in spring.
Plant phenology and global climate change:Current progresses and challenges
[J].
北京松山国家级自然保护区典型植被类型表层土壤碳密度及周转速率特征
[J].
Surface soil carbon density and turnover rate of typical vegetation types in Beijing Songshan national nature reserve
[J].
The 30 m annual land cover dataset and its dynamics in China from 1990 to 2019
[J].
DOI:10.5194/essd-13-3907-2021
[本文引用: 1]
Land cover (LC) determines the energy exchange, water and carbon cycle between Earth's spheres. Accurate LC information is a fundamental parameter for the environment and climate studies. Considering that the LC in China has been altered dramatically with the economic development in the past few decades, sequential and fine-scale LC monitoring is in urgent need. However, currently, fine-resolution annual LC dataset produced by the observational images is generally unavailable for China due to the lack of sufficient training samples and computational capabilities. To deal with this issue, we produced the first Landsat-derived annual China land cover dataset (CLCD) on the Google Earth Engine (GEE) platform, which contains 30m annual LC and its dynamics in China from 1990 to 2019. We first collected the training samples by combining stable samples extracted from China's land-use/cover datasets (CLUDs) and visually interpreted samples from satellite time-series data, Google Earth and Google Maps. Using 335 709 Landsat images on the GEE, several temporal metrics were constructed and fed to the random forest classifier to obtain classification results. We then proposed a post-processing method incorporating spatial-temporal filtering and logical reasoning to further improve the spatial-temporal consistency of CLCD. Finally, the overall accuracy of CLCD reached 79.31% based on 5463 visually interpreted samples. A further assessment based on 5131 third-party test samples showed that the overall accuracy of CLCD outperforms that of MCD12Q1, ESACCI_LC, FROM_GLC and GlobeLand30. Besides, we intercompared the CLCD with several Landsat-derived thematic products, which exhibited good consistencies with the Global Forest Change, the Global Surface Water, and three impervious surface products. Based on the CLCD, the trends and patterns of China's LC changes during 1985 and 2019 were revealed, such as expansion of impervious surface (+148.71 %) and water (+18.39 %), decrease in cropland (-4.85 %) and grassland (-3.29 %), and increase in forest (+4.34 %). In general, CLCD reflected the rapid urbanization and a series of ecological projects (e.g. Gain for Green) in China and revealed the anthropogenic implications on LC under the condition of climate change, signifying its potential application in the global change research.
Curve fitting of MODIS NDVI time series in the task of early crops identification by satellite images
[J].
Seasonality extraction by function fitting to time-series of satellite sensor data
[J].
遥感时间序列数据滤波重建算法发展综述
[J].
Review on methods of remote sensing time-series data reconstruction
[J].
近52年来滦河流域气候变化趋势分析
[J].
Climatic change characteristics in the latest 52 years in Luan River Basin
[J].
中国不同农业区气温和降水时空演变格局分析
[J].
Temporal and spatial variation of temperature and precipitation in each agricultural sub-region of China
[J].
1951—2016年中国沿海地区气温与降水量的时空特征
[J].
Temporal and spatial characteristics of temperature and precipitation in China’s coastal areas from 1951 to 2016
[J].
2006年极端天气和气候事件及其他相关事件的概要回顾
[J].
Some extreme events of weather,climate and related phenomena in 2006
[J].
Evaluation of vegetation indexes and green-up date extraction methods on the Tibetan Plateau
[J].
近50年中国典型木本植物展叶始期温度敏感度变化及原因
[J].
Variations in temperature sensitivity of leaf unfolding date and their influencing factors for typical woody plants in China over the past 50 years
[J].
Vegetation green up under the influence of daily minimum temperature and urbanization in the Yellow River Basin,China
[J].
Continuous advance in the onset of vegetation green-up in the Northern Hemisphere,during hiatuses in spring warming
[J].
北京植被物候时空变化及其对城市化的响应
[J].
Spatiotemporal variation of vegetation phenology and its response to urbanization in Beijing
[J].
北京市植物物候对热岛效应的响应
[J].
Responses of plant phenology to urban heat island effects in Beijing
[J].
DOI:10.13292/j.1000-4890.202103.029
[本文引用: 1]
The rapid development of cities increases urban heat island (UHI) effect. Urban greening can alleviate the heat island effect, but plant phenology could be affected by the heat island effect. Using remote sensing images, we compared the plant phenology between UHI areas and non-UHI areas as well as the different levels of UHI intensity in Beijing. Landsat-8 images for Beijing were used to invert the land surface temperature (LST). Spatial analysis methods were used to identify UHI zones and the UHI intensity classification. With data of normalized differential vegetation index (NDVI) of MOD13A1, three phenological parameters (start of growth season (SOG), end of growth season (EOG), and length of growth season (LOG)) were extracted by the Dallimer mean value method and dynamic threshold method. The three parameters were used to examine the differences in plant phenology between the UHI areas and the non-UHI areas and between different UHI intensity levels. The UHI effect of Beijing in summer was more obvious than that in winter. The SOG in the UHI areas extracted by Dallimer mean value method was four days earlier, the EOG was nine days later, and the LOG was 13 days longer than that in non-UHI areas. The SOG in UHI areas extracted by dynamic threshold method was 10 days earlier, the EOG was four days later, and the LOG was 14 days longer than that in nonUHI areas. Compared with the Dallimer mean value method, the phenology calculated by the dynamic threshold method was closer to the observation data. Under higher UHI intensity, the SOG would be earlier, the EOG would be later, and the LOG would be longer. This study enriches the response mechanism of plant phenology to the UHI effect in North China, which helps us to understand the effects of global warming on ecosystems.
Agricultural drought detection with MODIS based vegetation health indices in southeast Germany
[J].
蒙古国冬春季气候非对称变暖及其对植被返青期和春季NDVI的影响
[J].
DOI:10.12118/j.issn.1000-6060.2022.686
[本文引用: 1]
基于2001—2020年NDVI和EVI两种遥感植被指数及蒙古国60个气象站点的气温和降水数据,利用累积植被指数的Logistic曲线曲率极值法和动态阈值法提取蒙古国植被返青期,并结合偏相关分析方法探讨二者与冬春季昼夜气温非对称变化之间的关系。结果表明:(1)近20 a来,最高气温在冬春季的变暖速率分别为0.07 ℃·a<sup>-1</sup>、0.15 ℃·a<sup>-1</sup>(PR<sup>2</sup>=0.33),最低气温在冬春季的变化速率分别为-0.01 ℃·a<sup>-1</sup>、0.04 ℃·a<sup>-1</sup>,冬春季气温日较差的变化速率分别为0.08 ℃·a<sup>-1</sup>、0.11 ℃·a<sup>-1</sup>(PR<sup>2</sup>=0.52),存在明显的季节性差异。(2)蒙古国植被返青期对冬春季气候变暖的季节性响应是非对称的,冬季最高气温和气温日较差的影响大,而春季则是最低气温影响大,且均表现为负相关。(3)蒙古国气候变暖对植被NDVI产生的非对称影响主要表现在春季,即春季最高气温和气温日较差对植被NDVI主要表现为负相关,而春季最低气温对植被NDVI主要表现为正相关。研究结果可为进一步了解全球气候变暖背景下植被春季物候及植被后期生长的季节性影响提供重要参考价值。
Asymmetrical warming in winter and spring and its effect on start of growing season and spring NDVI in Mongolia
[J].
DOI:10.12118/j.issn.1000-6060.2022.686
[本文引用: 1]
<p id="p00010">Based on the normalized difference vegetation index (NDVI) and enhanced vegetation index obtained from remote sensing and on temperature and precipitation data from 60 meteorological stations in Mongolia from 2001 to 2020, the logistic curve method and dynamic threshold method of the cumulative vegetation index were used to extract the vegetation green-up period in Mongolia. Partial correlation analysis was used to explore the relationship between the vegetation green-up period and the asymmetric changes in diurnal temperature in winter and spring. The results were as follows: (1) In the past 20 years, the warming rates for highest winter and spring temperatures were 0.07 ℃·a<sup>−1</sup> and 0.15 ℃·a<sup>−1</sup> (<i>P</i><0.05, <i>R</i><sup>2</sup>=0.33) respectively, while the change rates of the lowest winter and spring temperatures were −0.01 ℃·a<sup>−1</sup> and 0.04 ℃·a<sup>−1</sup> respectively. The change rate of the winter and spring diurnal temperature ranges were 0.08 ℃·a<sup>−1</sup> and 0.11 ℃·a<sup>−1</sup> (<i>P</i><0.05, <i>R</i><sup>2</sup>=0.52) respectively, showing clear seasonal differences. (2) The seasonal response of the start of the growing season to winter and spring climate warming is asymmetric, with the highest temperature and diurnal temperature range having a greater impact in winter, while the lowest temperature has a greater impact in spring; both show negative correlations. (3) The asymmetric impact of climate warming on NDVI in Mongolia is mainly manifested in spring. The highest spring temperature and spring diurnal temperature range have a mainly negative correlation with NDVI, while the lowest spring temperature has a mainly positive correlation with NDVI. This study provides an important reference in the study of the seasonal effects of climate warming on vegetation phenology and late-stage growth.</p>
Diverse impacts of day and night temperature on spring phenology in freshwater marshes of the Tibetan Pla-teau
[J].
Overestimation of the effect of climatic warming on spring phenology due to misrepresentation of chilling
[J].
DOI:10.1038/s41467-020-18743-8
PMID:33009378
[本文引用: 1]
Spring warming substantially advances leaf unfolding and flowering time for perennials. Winter warming, however, decreases chilling accumulation (CA), which increases the heat requirement (HR) and acts to delay spring phenology. Whether or not this negative CA-HR relationship is correctly interpreted in ecosystem models remains unknown. Using leaf unfolding and flowering data for 30 perennials in Europe, here we show that more than half (7 of 12) of current chilling models are invalid since they show a positive CA-HR relationship. The possible reason is that they overlook the effect of freezing temperature on dormancy release. Overestimation of the advance in spring phenology by the end of this century by these invalid chilling models could be as large as 7.6 and 20.0 days under RCPs 4.5 and 8.5, respectively. Our results highlight the need for a better representation of chilling for the correct understanding of spring phenological responses to future climate change.
