

0 引言
遥感技术具有观测尺度大、成本低、周期短和覆盖广等优点,已广泛应用于红树林分类和监测 [12
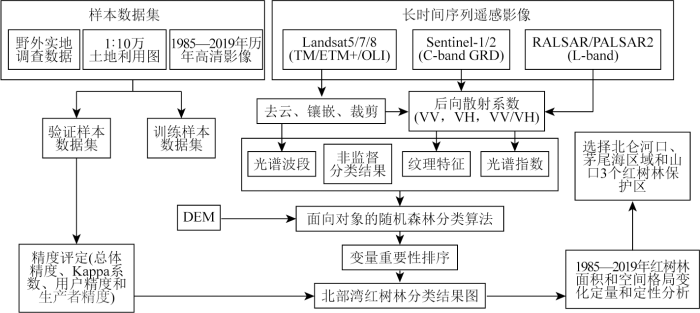
因此,本文以广西北部湾近海红树林为研究对象,利用GEE云平台,整合Landsat和 Sentinel系列的主被动遥感影像和随机森林算法构建了1985—2019年红树林遥感分类模型,实现了北部湾红树林分类制图并进行精度验证; 构建了14种主被动影像特征组合方案,定量评估了不同影像特征的重要性及其对红树林分类精度的影响; 进一步探究35 a来广西北部湾区域红树林面积和空间分布格局的动态变化。
1 研究区概况及其数据源
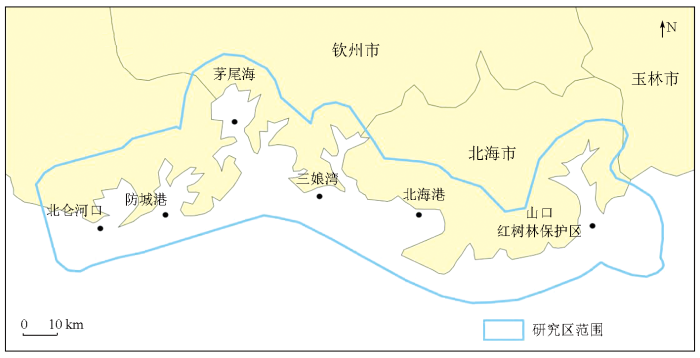
1.1 研究区概况
图1
1.2 数据源及预处理
为探明1985—2019年北部湾红树林时空变化态势,本文以每10 a为1期进行红树林分类提取,多源遥感数据具体选择如表1所示。
表1 多源遥感数据集
Tab.1
| 年份 | 传感器 | 影像数 | 影像分辨率/m | 影像筛选日期 | |
|---|---|---|---|---|---|
| 1985年 | Landsat5 TM | 68 | 30 | 1984年5月30日—1989年10月30日 | |
| 1995年 | Landsat5 TM | 46 | 30 | 1994年1月1日—1995年12月31日 | |
| 2005年 | Landsat7 ETM+ | 108 | 15/30 | 2000年1月1日—2003年12月31日 | |
| L-band PALSAR/PALSAR-2 | 1 | 25 | 2007年1月1日—2007年12月31日 | ||
| 2015年 | Landsat8 OLI | 31 | 30 | 2015年1月1日—2015年12月31日 | |
| C-band Sentinel-1 GRD | 16 | 20 | 2015年1月1日—2015年12月1日 | ||
| 2019年 | Sentinel-2 MSI | 720 | 10/20 | 2019年1月1日—2019年12月1日 | |
| C-band Sentinel-1 GRD | 106 | 20 | 2019年1月1日—2019年12月1日 |
本文所采用的Landsat 和Sentinel-2多光谱影像都经过了辐射定标和大气纠正,因此预处理仅需利用GEE平台进行去云、裁剪和镶嵌等操作。本文所选用的影像除了考虑卫星重访周期、研究时间跨度和研究区范围等因素,还参考了国家海洋信息中心提供的国家潮汐表(
1.3 样本数据
本文综合考虑了2019年11—12月野外实地调查、1985—2019年历年高清影像图和中国科学院地理科学与资源研究所编制1∶10万土地利用数据,确定分为建筑用地、红树林、水体、海产养殖、耕地、林地和滩涂7种地物类型。借助Google Earth Pro软件调用1985—2019历年高清影像结合1∶10万土地利用数据建立解译标志,如表2所示。
表2 研究区地物解译标志及其描述
Tab.2
| 地物类型 | 解译标志 | 描述 | ||
|---|---|---|---|---|
| Landsat影像 | Sentinel影像 | 雷达影像 | ||
| 建筑用地 |  |  |  | 道路、城镇、沙地等,在标准假彩色中显示为灰白色、青绿色及亮白色,轮廓清晰且与周围地物分界明显 |
| 红树林 | 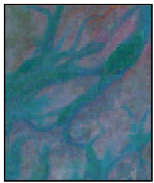 | 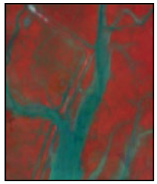 | 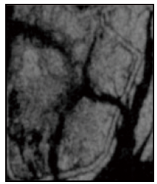 | 由密集分布的红树林群落组成,沿海岸带分布。在标准假彩色显示方案中,1985年、1995年Landsat5影像中的红树林主要表现为淡棕红色,2005—2019年影像中则主要表现为暗红色 |
| 水体 | 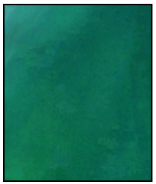 |  |  | 在标准假彩色中显示方案中,1985年、1995年海水为蓝绿色,2005—2019年海水为蓝色 |
| 海产养殖 |  |  | 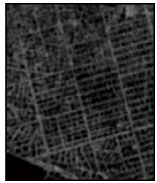 | 包括虾塘等养殖塘,有明显的轮廓边界,形状较规则 |
| 耕地 | 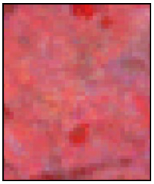 | 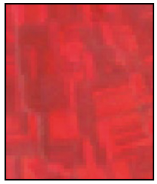 | 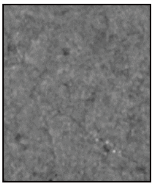 | 在标准假彩色中表现为淡红色,且主要分布于内陆,形状较规则 |
| 林地 | 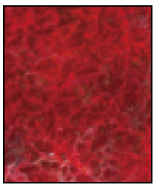 | 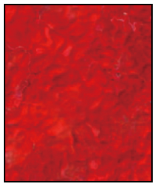 | 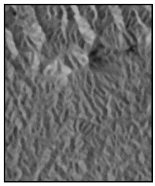 | 在标准假彩色中表现为比耕地更深的红色,且主要分布于内陆,时常与耕地相邻 |
| 滩涂 | 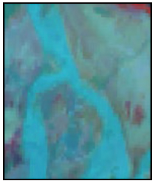 | 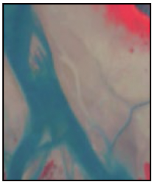 |  | 出现在沿岸海陆交汇区域,是红树林生长的沃土,在标准假彩色中表现为桃皮色 |
2 研究方法
2.1 多源数据集构建
2.1.1 各类遥感指数计算
红树林处于海陆交界位置,间歇性会被海水侵入或淹没,进而增大各类型遥感指数的光谱差异性,提升对植被、海水和海产养殖的区分能力。本文基于GEE云平台计算了植被指数、水体指数、建筑指数等16种主被动遥感指数,具体计算公式见表3。
表3 各类型遥感指数计算公式
Tab.3
| 序号 | 指数类型 | 计算公式① |
|---|---|---|
| 1 | 归一化植被指数 (normalized difference vegetation index, NDVI) | |
| 2 | 比值植被指数(ratio vegetation index, RVI) | |
| 3 | 差值植被指数(difference vegetation index, DVI) | |
| 4 | 增强植被指数(enhanced vegetation index, EVI) | |
| 5 | 校正植被指数(corrected transformed vegetation index, CTVI) | |
| 6 | 非线性指数(non-linear vegetation index, NLI) | |
| 7 | 改进简单比值指数(modified simple ratio, MSRNIR) | |
| 8 | 归一化水体指数(normalized difference water index, NDWI) | |
| 9 | 改进的归一化水体指数(modified normalized difference water index, MNDWI) | SWIR1(1.55~1.75 μm) SWIR2(2.08~2.35 μm) |
| 10 | 自动提取水体指数(automated water extraction index, AWEI) | |
| 11 | 归一化建筑指数(normalized difference built-up index, NDBI) | SWIR1(1.55~1.75 μm) SWIR2(2.08~2.35 μm) |
| 12 | 基于红边波段的改进简单比值指数(modified simple ratio, MSRRE1,MSRRE2) | RE1(703.9 nm) RE2(740.2 nm) |
| 13 | 基于红边波段的非线性指数(non-linear index, NLIRE1,NLIRE2) | RE1(703.9 nm) RE2(740.2 nm) |
| 14 | 基于红边波段的增强植被指数(enhanced vegetation index, EVIRE1,EVIRE2) | RE1(703.9 nm) RE2(740.2 nm) |
| 15 | 微波遥感指数HH/HV | PALSAR HH/HV |
| 16 | 微波遥感指数VV/VH | Sentinel-1 VV/VH |
①: 公式中NIR代表近红外波段,RED代表红光波段,BLUE代表蓝光波段,GREEN代表绿光波段,SWIR1代表1.55~1.75 μm波长范围的短波红外波段,SWIR2代表2.08~2.35 μm波长范围的短波红外波段,RE1代表703.9 nm波长的红边波段,RE2代表740.2 nm波长的红边波段。
2.1.2 纹理特征提取
本文按照随机森林算法对波段进行重要性排序,基于重要性挑选波段并计算灰度共生矩阵(gray-level co-occurrence matrix,GLCM),基于GLCM提取了17个多光谱影像的纹理特征参数,包括方差(variance,VAR)、总和方差(sum variance,SVAR)、角二阶矩(angular second moment,ASM)和集群突出(cluster prominence,PROM)等。1985年选取B1(蓝光)波段和重要性靠前且对于植被区分度较好的B5短波红外(1.55~1.75 μm)波段; 1995年选取B5(1.55~1.75 μm)短波红外波段; 2005年选取B4(近红外)波段; 2015年选取B7(2.08~2.35 μm)波段; 2019年选取的是B12(2 202.4 nm)波段,另外选取了对于植被敏感的B5红边波段(703.9 nm)及B8(近红外)波段。
2.1.3 分类方案设计
本文采用HSV波段融合算法并结合Landsat7 ETM+和Landsat8 OLI高分辨率全色波段进行图像增强,得到影像分辨率为15 m。而对于Landsat5 TM,Sentinel-2 MSI,L-band PALSAR/PALSAR-2和C-band Sentinel-1 SAR采用双线性插值法将影像重采样为15 m空间分辨率。
通过GEE采样函数采集研究区范围内大约3 000个像元数量作为训练数据,调用聚类器函数进行非监督分类。本文中采用K-Means聚类算法进行聚类处理(聚类数为50),利用训练数据训练设置好的聚类器,最后将经过训练的聚类器应用于研究区影像数据中实现非监督分类,并将非监督分类结果作为输入特征。
为了定量评估不同输入影像特征对红树林分类精度的贡献率,本文将多光谱波段、光谱指数、纹理特征和不同频率SAR数据等进行波段组合,构建了14种分类方案,具体见表4。
表4 分类方案及多源遥感数据集
Tab.4
| 年份 | 传感器 | 方案 | 变量数 | 多源数据集 |
|---|---|---|---|---|
| 1985年 | Landsat5 TM | 方案1 | 21 | 多光谱波段(6个波段)、各类遥感指数(植被指数、水体指数、建筑指数)、数字高程模型(digital elevation model,DEM)、非监督分类结果 |
| 方案2 | 55 | 多光谱波段(6个波段)、各类遥感指数(植被指数、水体指数、建筑指数)、DEM、非监督分类结果、B1(BLUE)波段纹理特征、B5(1.55~1.75 μm)波段纹理特征 | ||
| 1995年 | Landsat5 TM | 方案1 | 21 | 多光谱波段(6个波段)、各类遥感指数(植被指数、水体指数、建筑指数)、DEM、非监督分类结果 |
| 方案2 | 38 | 多光谱波段(6个波段)、各类遥感指数(植被指数、水体指数、建筑指数)、DEM、非监督分类结果、B5(1.55~1.75 μm)波段纹理特征 | ||
| 2005年 | Landsat7 ETM+ | 方案1 | 22 | 多光谱波段(7个波段)、各类遥感指数(13个)、DEM、非监督分类结果 |
| 方案2 | 25 | 多光谱波段(7个波段)、各类遥感指数(13个)、DEM、非监督分类结果、PALSAR/PALSAR-2 HH,HV,HH/HV | ||
| 方案3 | 42 | 多光谱波段(7个波段)、各类指数(13个)、DEM、非监督分类结果、HSV波段融合、B4(NIR)波段纹理特征 | ||
| 2015年 | Landsat8 OLI | 方案1 | 55 | 多光谱波段(7个波段)、各类遥感指数(13个)、DEM、非监督分类结果 |
| 方案2 | 25 | 多光谱波段(7个波段)、各类遥感指数(13个)、DEM、非监督分类结果、C-band Sentinel-1 GRD VV,VH,VV/VH | ||
| 方案3 | 42 | 多光谱波段(7个波段)、各类遥感指数(13个)、DEM、非监督分类结果、HSV波段融合、B7(2.11~2.29 μm)波段纹理特征 | ||
| 2019年 | Sentinel-2 MSI | 方案1 | 31 | 多光谱波段(10个波段)、各类遥感指数(16个)、DEM、非监督分类结果 |
| 方案2 | 34 | 多光谱波段(10个波段)、各类遥感指数(16个)、DEM、非监督分类结果、C-band Sentinel-1 GRD VV,VH,VV/VH | ||
| 方案3 | 50 | 多光谱波段(10个波段)、各类遥感指数(16个)、DEM、非监督分类结果、B5(703.9 nm)波段纹理特征(9个)、B8(NIR)波段纹理特征(10个) | ||
| 方案4 | 48 | 多光谱波段(10个波段)、各类遥感指数(16个)、DEM、非监督分类结果、B12(2 202.4 nm)波段纹理特征 |
2.2 构建红树林植被识别模型及精度验证
图2
3 结果与分析
3.1 变量重要性评价
本文利用递归特征消除法(recursive feature elimination,RFE)定量评估所构建的14种分类方案中分类结果较好的4种影像特征组合方案的变量重要性(图3)。2005年前15个输入变量中,纹理特征占47%、光谱指数占33%、多光谱波段占13%,最重要的3个变量均为纹理特征,分别是VAR,SVAR和PROM。2015年的数据集中,多光谱波段的重要性进一步增加,前15个变量中纹理特征占13%、光谱指数占40%、多光谱波段占40%,前3个变量为VH后向散射系数、DEM和SVAR。光谱指数在2019年的数据集中展现出更高的重要性,前15个变量中光谱指数占73%、多光谱波段占20%,前3个变量为DEM,VH后向散射系数和MSRRE1指数。对14个分类方案的变量重要性进行对比分析发现,纹理特征对于红树林分类更加重要,其次为光谱指数,综合重要性前10的变量分别为DEM,VH,VAR,MNDWISWIR2,VV,B4(RED),AWEI,NDBISWIR2、GREEN和SWIR2(2.08~2.35 μm)。
图3
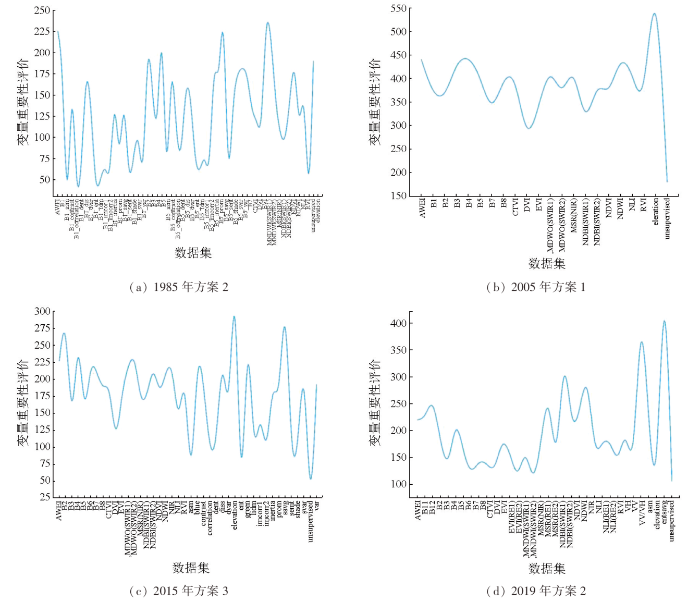
图3
1985—2015年不同遥感数据集重要性定量评价
Fig.3
Quantitative evaluation of the importance of different remote sensing data sets from 1985 to 2015
3.2 1985—2019年北部湾红树林分类结果与精度验证
本文选择了北部湾红树林集中分布区进行分类结果的对比分析(图4)。①1985年茅尾海湾海岸带区,方案2对红树林和海产养殖、耕地、林地及滩涂的分类效果均优于方案1,Kappa系数为0.884,总体分类精度为90.1%(见图4(b)); ②1995年山口红树林保护区,方案2对红树林、建设用地、耕地和林地的分类效果更好,Kappa系数为0.853,总体分类精度为87.7%(见图4(d)),方案1对于海产养殖和滩涂的识别效果更好(见图4(e)); ③2005年山口红树林保护区,方案1和方案3对于红树林的识别效果较好,但方案3对于海产养殖和滩涂的识别效果优于方案1,且对耕地和林地的区分效果最佳,Kappa系数为0.908,总体分类精度为92.3%(图4(g)和4(h)); ④2015年茅尾海湾海岸带区,方案1和3对于建设用地、红树林、耕地和林地识别效果较好,但方案1对海产养殖和滩涂识别精度优于方案3,Kappa系数为0.907,总体分类精度为92.1%(图4(j)和4(k)); ⑤2019年茅尾海海岸带区,方案1和3对建筑用地、耕地和林地的识别效果较好,但是方案3对于红树林的识别效果优于方案2,方案1对于海产养殖分类效果优于方案3,这是因为部分淹没滩涂被错分为海产养殖区,Kappa系数为0.956,总体分类精度为96.3%(图5(a)和5(b))。
图4
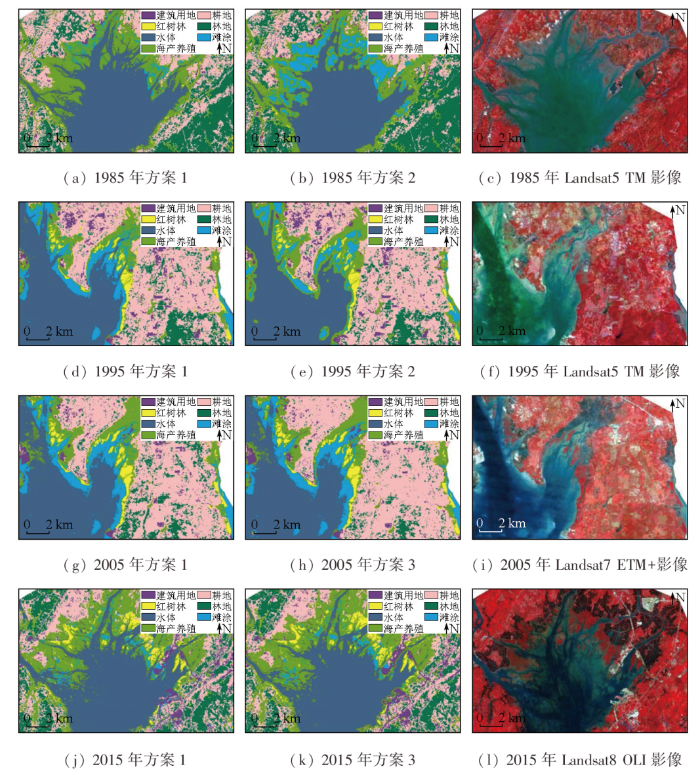
图4
1985—2015年不同遥感数据集的分类结果
Fig.4
Classification results based on different remote sensing images from 1985 to 2015
图5
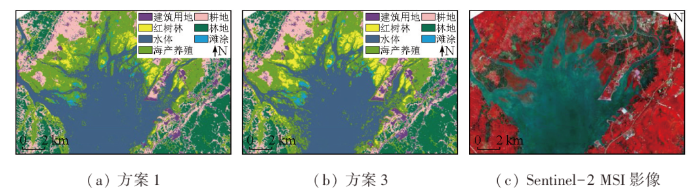
图5
2019年Sentinel-2 MSI影像的分类结果
Fig.5
Classification results derived from Sentinel 2 MSI image in 2019
表5 1985—2019年各分类方案总体分类精度及Kappa系数
Tab.5
| 年份 | 方案 | Kappa系数 | 总体分类精度/% |
|---|---|---|---|
| 1985年 | 方案1 | 0.869 | 88.8 |
| 方案2 | 0.884 | 90.1 | |
| 1995年 | 方案1 | 0.761 | 80.0 |
| 方案2 | 0.853 | 87.7 | |
| 2005年 | 方案1 | 0.881 | 90.1 |
| 方案2 | 0.901 | 91.8 | |
| 方案3 | 0.908 | 92.3 | |
| 2015年 | 方案1 | 0.874 | 89.3 |
| 方案2 | 0.900 | 91.6 | |
| 方案3 | 0.907 | 92.1 | |
| 2019年 | 方案1 | 0.881 | 90.1 |
| 方案2 | 0.900 | 91.6 | |
| 方案3 | 0.956 | 96.3 | |
| 方案4 | 0.943 | 95.3 |
1985—2019年14个分类方案中,2019年基于Sentinel-2 MSI 影像的4个分类方案的总体分类精度整体高于1985—2015年基于Landsat系列影像,可能是由于分辨率高的卫星影像可以更加精细地提取细小斑块的红树林。
2005年、2015年和2019年方案2加入不同SAR极化后向散射特征,与仅使用多光谱影像及其衍生信息相比,总体分类精度均得到了提升: ①2005年方案2相对于方案1增加了PALSAR/PALSAR-2 HH,HV,HH/HV的后向散射数据,获取的总体分类精度高于方案1,为91.8%; ②2015年和2019年方案2相比于方案1,均增加了C-band Sentinel-1 GRD VV,VH,VV/VH后向散射数据,总体分类精度分别提升了2.3%和1.5%。
3.3 1985—2019年北部湾红树林面积变化分析
图6
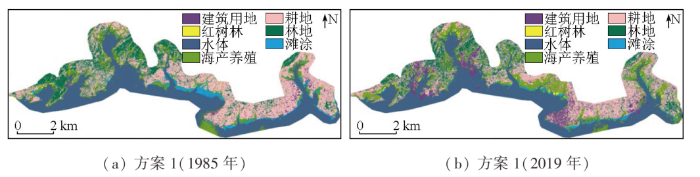
图6
1985年和2019年同一遥感数据集分类结果图
Fig.6
Classification results of the same remote sensing data set in 1985 and 2019
本文选取各年份最优方案(1985年方案2、1995年方案2、2005年方案3、2015年方案3和2019年方案3)分类结果,进行北部湾红树林面积变化分析(见表6与表7): 1985—2019年北部湾红树林面积呈现明显的递增趋势,年变化率为6.36%。其中1985—1995年红树林增速最快,面积增加了20.33 km2,年增长率为8.90%。随后,红树林增长速率逐渐减缓,2005—2015年红树林增长率为1.99%,2015—2019年红树林增长率为1.11%。2019年北部湾红树林面积为73.72 km2,相较于1985年红树林面积增加了55.88 km2,说明北部湾海岸带红树林保护和种植受到了重视,红树林生态逐渐复苏。35 a间北部湾海岸带建筑用地、红树林及林地的年变化率呈现正增长。
表6 1985—2019年研究区各类地物面积
Tab.6
| 地类 | 1985年/km2 | 占比/% | 1995年/km2 | 占比/% | 2005年/km2 | 占比/% | 2015年/km2 | 占比/% |
|---|---|---|---|---|---|---|---|---|
| 建筑用地 | 142.79 | 3.12 | 184.49 | 4.03 | 203.19 | 4.44 | 483.43 | 10.55 |
| 红树林 | 22.84 | 0.50 | 43.17 | 0.94 | 55.33 | 1.21 | 66.36 | 1.45 |
| 水体 | 1 613.01 | 35.21 | 1 579.58 | 34.48 | 1 501.06 | 32.77 | 1 561.20 | 34.08 |
| 海产养殖 | 546.25 | 11.92 | 565.92 | 12.35 | 628.85 | 13.73 | 608.80 | 13.29 |
| 耕地 | 1 201.92 | 26.24 | 1 505.52 | 32.86 | 1 326.87 | 28.96 | 1 090.14 | 23.80 |
| 林地 | 886.90 | 19.36 | 531.07 | 11.59 | 587.27 | 12.82 | 569.34 | 12.43 |
| 滩涂 | 167.38 | 3.65 | 171.34 | 3.74 | 278.52 | 6.08 | 201.82 | 4.41 |
| 总计 | 4 581.09 | 100.00 | 4 581.09 | 100.00 | 4 581.09 | 100.00 | 4 581.09 | 100.00 |
表7 1985—2019年各土地利用类型年变化率
Tab.7
| 地类 | 1985— 1995 | 1995— 2005 | 2005— 2015 | 2015— 2019 | 1985— 2019 |
|---|---|---|---|---|---|
| 建筑用地 | 2.92 | 1.01 | 13.79 | -0.33 | 6.50 |
| 红树林 | 8.90 | 2.82 | 1.99 | 1.11 | 6.36 |
| 水体 | -0.21 | -0.50 | -0.40 | 0.12 | -0.06 |
| 海产养殖 | 0.36 | 1.11 | -0.32 | 1.29 | 0.74 |
| 耕地 | 2.53 | -1.19 | -1.78 | -0.67 | -0.44 |
| 林地 | -4.01 | 1.06 | -0.31 | 1.33 | -0.78 |
| 滩涂 | 0.24 | 6.26 | -2.75 | -4.53 | -0.97 |
3.4 1985—2019年北部湾红树林空间位置变化分析
本文分别选取北仑河口、茅尾海和山口红树林保护区3个红树林集中分布区分析1985—2019年35 a间红树林空间位置的变化。从图7可以看出,1985—2019年北仑河口红树林面积向东南方向逐渐递增,茅尾海红树林呈向南递增,2005—2019年增加最明显,沿岸大量的滩涂区域已被红树林覆盖。山口红树林保护区内丹兜海沿岸红树林向东北方向递增,防城港1985—2019年沿海区域建筑用地面积由沿岸向北递增,但整体红树林呈现由内陆向沿岸增加的趋势。
图7
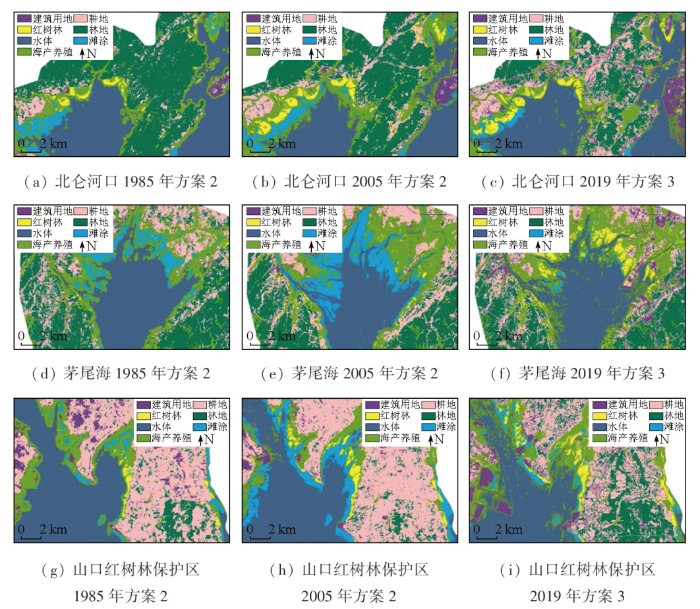
图7
1985年、2005年和2019年北部湾典型区域红树林空间位置变化
Fig.7
Comparison of mangrove distribution in typical area of Beibu Gulf in 1985, 2005 and 2019
4 结论
1)本文综合利用多光谱和多极化SAR影像构建的多维影像特征数据集提升了红树林的分类精度,总体分类精度达到了96.3%。变量重要性评价揭示VH后向散射系数和多光谱纹理可以增强红树林植被与其他地物的差异性。
2)本文利用面向对象的随机森林算法构建的北部湾海岸带地物分类模型,在14种特征方案中均实现了7种地物的高精度识别,总体分类精度超过了88.8%,红树林的生产者精度和用户精度均高于其他地物类型,超过了92.0%。
3)1985—2019年北部湾红树林整体呈增加态势,2019年北部湾红树林面积相较1985年增加了50.88 km2,年变化率为6.36%,其中1995年增加面积最多达到了20.33 km2。北部湾沿岸红树林总体呈现出由内陆向沿岸递增的趋势。
参考文献
中国红树林生态系统保护空缺分析
[J].
Gap analysis of mangrove ecosystem conservation in China
[J].
基于资源三号影像的红树林物种分类研究
[J].
DOI:10.11873/j.issn.1004-0323.2018.2.0360

选取北部湾的东部地区(广东省和广西壮族自治区交界处)为研究区,探索利用资源三号卫星影像,建立大范围红树林遥感信息提取和精细分类模式。首先根据地物波谱特征提取水陆边线,并建立缓冲区生成红树林生长适宜区;再通过基于面向对象的阈值分类方法提取红树林植被信息;最后采用基于像元的最近邻、贝叶斯和随机森林方法对红树林进行树种级分类。结果表明:采用结合阈值法的面向对象遥感分类可以对整景资源三号卫星影像准确提取水陆边线并有效提取红树林分布区,采用基于像元的随机森林法对红树林树种级分类可以得到较好的分类效果(总体分类精度82.84%),优于最近邻法和贝叶斯法。基于混合方法的红树林提取与树种分类模式适用于大范围的红树林分类与制图,同时也证实了资源三号卫星数据应用于海岸带红树林研究的有效性。
Study on mangrove species classification based on ZY-3 image
[J].
A review of remote sensing for mangrove forests:1956—2018
[J].
红树林生态系统遥感监测研究进展
[J].
A review on the application of remote sensing in mangrove ecosystem monitoring
[J].
Distribution and dynamics of mangrove forests of South Asia
[J].
DOI:10.1016/j.jenvman.2014.01.020
PMID:24735705
Mangrove forests in South Asia occur along the tidal sea edge of Bangladesh, India, Pakistan, and Sri Lanka. These forests provide important ecosystem goods and services to the region's dense coastal populations and support important functions of the biosphere. Mangroves are under threat from both natural and anthropogenic stressors; however the current status and dynamics of the region's mangroves are poorly understood. We mapped the current extent of mangrove forests in South Asia and identified mangrove forest cover change (gain and loss) from 2000 to 2012 using Landsat satellite data. We also conducted three case studies in Indus Delta (Pakistan), Goa (India), and Sundarbans (Bangladesh and India) to identify rates, patterns, and causes of change in greater spatial and thematic details compared to regional assessment of mangrove forests. Our findings revealed that the areal extent of mangrove forests in South Asia is approximately 1,187,476 ha representing ∼7% of the global total. Our results showed that from 2000 to 2012, 92,135 ha of mangroves were deforested and 80,461 ha were reforested with a net loss of 11,673 ha. In all three case studies, mangrove areas have remained the same or increased slightly, however, the turnover was greater than the net change. Both, natural and anthropogenic factors are responsible for the change and turnover. The major causes of forest cover change are similar throughout the region; however, specific factors may be dominant in specific areas. Major causes of deforestation in South Asia include (i) conversion to other land use (e.g. conversion to agriculture, shrimp farms, development, and human settlement), (ii) over-harvesting (e.g. grazing, browsing and lopping, and fishing), (iii) pollution, (iv) decline in freshwater availability, (v) floodings, (vi) reduction of silt deposition, (vii) coastal erosion, and (viii) disturbances from tropical cyclones and tsunamis. Our analysis in the region's diverse socio-economic and environmental conditions highlights complex patterns of mangrove distribution and change. Results from this study provide important insight to the conservation and management of the important and threatened South Asian mangrove ecosystem. Published by Elsevier Ltd.
中国红树林湿地物种多样性及其形成
[J].
Species diversity in mangrove wetlands of China and its causation analyses
[J].
Mangrove mapping and change detection in Ca mau peninsula,Vietnam,using landsat data and object-based image analysis
[J].
A world without mangroves?
[J].DOI:10.1126/science.317.5834.41b PMID:17615322 [本文引用: 1]
Can strict protection stop the decline of mangrove ecosystems in China? from rapid destruction to rampant degradation
[J].
The World’s Mangroves 1980-2005
[Z].
Rates and drivers of mangrove deforestation in Southeast Asia,2000-2012
[J].
DOI:10.1073/pnas.1510272113
PMID:26712025
[本文引用: 1]
The mangrove forests of Southeast Asia are highly biodiverse and provide multiple ecosystem services upon which millions of people depend. Mangroves enhance fisheries and coastal protection, and store among the highest densities of carbon of any ecosystem globally. Mangrove forests have experienced extensive deforestation owing to global demand for commodities, and previous studies have identified the expansion of aquaculture as largely responsible. The proportional conversion of mangroves to different land use types has not been systematically quantified across Southeast Asia, however, particularly in recent years. In this study we apply a combined geographic information system and remote sensing method to quantify the key proximate drivers (i.e., replacement land uses) of mangrove deforestation in Southeast Asia between 2000 and 2012. Mangrove forests were lost at an average rate of 0.18% per year, which is lower than previously published estimates. In total, more than 100,000 ha of mangroves were removed during the study period, with aquaculture accounting for 30% of this total forest change. The rapid expansion of rice agriculture in Myanmar, and the sustained conversion of mangroves to oil palm plantations in Malaysia and Indonesia, are identified as additional increasing and under-recognized threats to mangrove ecosystems. Our study highlights frontiers of mangrove deforestation in the border states of Myanmar, on Borneo, and in Indonesian Papua. To implement policies that conserve mangrove forests across Southeast Asia, it is essential to consider the national and subnational variation in the land uses that follow deforestation.
Advancing the mapping of mangrove forests at national-scale using sentinel-1 and sentinel-2 time-series data with google earth engine:A case study in China
[J].
Individual mangrove tree measurement using UAV-based LiDAR data:Possibilities and challenges
[J].
基于Sentinel遥感数据的红树林信息提取研究——以广西茅尾海为例
[J].
Mangrove information extraction based on the sentinel remote sensing data:A case study of Maoweihai Bay of Guangxi
[J].
红树林遥感动态监测研究进展
[J].
DOI:10.12082/dqxxkx.2018.180247
红树林动态是地理学、生态学和湿地学等学科关注的热点之一。遥感技术具有宏观性、高效性和经济性等特点,在红树林动态监测中发挥日益重要的作用。本文通过关键词对Web of Science和中国知网2个数据库自2000年以来发表的文章进行梳理和归纳,从研究区域分布、文献数量、遥感监测数据源与方法、全球红树林动态以及全国红树林动态变化分析5个方面总结了近20年来国内外对于红树林遥感动态监测研究进展。研究结果表明,多传感器高时空分辨率数据将成为红树林遥感动态监测的重要数据源。将雷达数据和光学遥感数据进行融合,有助于进一步提升红树林卫星遥感监测能力。无人机平台搭载多种类型的传感器(如多光谱、高光谱或激光雷达传感器),可以从不同方面获取红树林生态系统参数,结合遥感智能分析算法,有助于推动红树林遥感研究向纵深方向发展。红树林遥感动态监测相关研究表明,全球红树林总面积范围大致在1.1×10<sup>8 </sup>~2.4×10<sup>8 </sup> hm<sup>2</sup>,总体仍呈减少趋势,而在区域上中国红树林面积则有所恢复。本文最后对红树林遥感动态监测的发展趋势进行了展望。
Review on dynamic monitoring of mangrove forestry using remote sensing
[J].
Costs and carbon benefits of mangrove conservation and restoration:A global analysis
[J].
无人机遥感与XGBoost的红树林物种分类
[J].
Mangrove species classification with UAV-based remote sensing data and XGBoost
[J].
1987以来海南省清澜港红树林变化的遥感监测与分析
[J].
Remote sensing monitoring and analysis on the dynamics of mangrove forests in Qinglan habor of Hainan Province since 1987
[J].
红树林空间分布信息遥感提取方法
[J].
Extraction of mangroves spatial distribution using remotely sensed data
[J].
Google Earth Engine:Planetary-scale geospatial analysis for everyone
[J].
Google earth engine applications since inception:Usage,trends,and potential
[J].
Assessing cyclone disturbances (1988-2016) in the Sundarbans mangrove forests using Landsat and Google Earth Engine
[J].
红树林生态开发现状与对策研究
[J].
Study on the current situation and countermeasures of mangrove ecological exploitation
[J].
Understanding dynamics of mangrove forest on protected areas of Hainan island,China:30 years of evidence from remote sensing
[J].
Monitoring loss and recovery of mangrove forests during 42 years:The achievements of mangrove conservation in China
[J].
