

0 引言
生态脆弱性研究始于Clements将生态过渡带的概念引入生态学研究领域[7],主要包括气候变化影响下的脆弱性分析和基于指标体系的气候变化脆弱性评价等[8-9]。目前我国已在评价模型构建和方法选取等方面形成了诸多成果,包括生态敏感性-生态恢复力-生态压力度(ecological sensitivity-ecological recovery-ecological pressure,SRP)概念模型[10]、暴露-敏感-适应性(vulnerability-scoping-diagram,VSD)[11]等评价模型以及层次分析法[12]、主成分分析法[13]和景观格局[14]等多种评价方法。其中SRP模型综合考虑生态系统稳定性的内涵[15],能较全面地体现生态环境脆弱性的综合性特征,并取得较广泛的应用[16-17]。
1 研究区概况及数据源
1.1 研究区概况
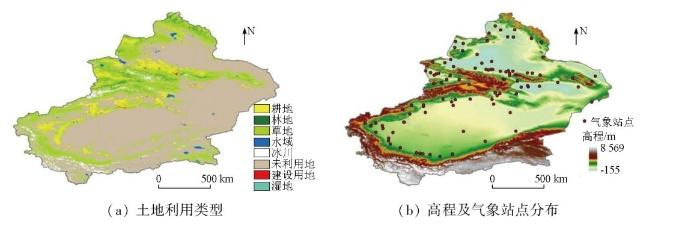
新疆维吾尔自治区(以下简称新疆)地处亚欧大陆腹地(73°29'54″~96°23'3″E,34°20'11″~49°10'55″N),全疆总面积为166×104 km2。该地区日照时间充足,由于距海远、居内陆的地域特征,年均降水量低于全国其他内陆地区。新疆北部阿尔泰山系、中部天山山脉、南部昆仑山与塔里木盆地、准噶尔盆地相间分布,地貌类型复杂多样,南北疆气候差异显著,属于典型的干旱半干旱气候区,土地利用类型以草地和未利用地为主,如图1所示,本文中地图均使用UTM投影。
图1
1.2 数据源及其预处理
1.2.1 地形数据
地形因子主要包括高程、坡度和地形起伏度; 高程数据来自地理空间数据云(https://www.gscloud.cn/),空间分辨率为250 m,利用ArcGIS 10.8软件对高程影像计算坡度和起伏度。
1.2.2 气象数据
从中国气象数据网(http: //data.cma.cn/)获取新疆地区102个气象站点的逐日降水量、最高温、最低温、平均温和相对湿度等数据,时间序列为2000—2020年共21 a,由于部分站点存在数据缺失,为进行有效的质量控制,对缺测数据采用均值替换法进行插补,采用样条函数法插值得到逐年气象因子栅格数据。
1.2.3 遥感数据
式中: Ei为景观i的景观干扰度; Ci为破碎度指数; Fi为分维度指数; Di优势度指数; a,b,c为权重,反映各指数对景观所代表生态环境的影响程度。将2000—2020年新疆土地利用类型数据的Tiff文件导入Fragstats4.2软件,以此完成景观破碎度和景观干扰指数的计算。
植被覆盖度数据来自青藏高原科学数据中心(https://data.tpdc.ac.cn/)的2000—2020年月度植被覆盖度产品,运用最大值合成法得到年尺度的植被覆盖度(fractional vegetation cover,FVC)数据集,空间分辨率250 m; 净初级生产力(net primary productivity,NPP)数据来自美国地质调查局(https://lpdaac.usgs.gov/),时间尺度为2000—2020年,空间分辨率500 m。
1.2.4 社会经济数据
为保证指标具有良好的空间重合性,在评价分析之前须对数据进行几何配准和重采样,将所有空间数据分辨率统一重采样为1 km。
2 研究方法
2.1 干旱指数计算
2.2 构建指标评价体系
2.2.1 选取评价指标
为减少评价指标信息中的重叠和共线性,对标准化后的数据采用ArcGIS空间主成分分析方法计算各指标层权重(表1); 并根据指标对生态环境脆弱性的影响,将指标属性分为正向和负向,构建适宜当地的评价模型。
表1 生态脆弱性评价指标体系
Tab.1
| 要素层 | 指标层 | 指标性质 | 权重 |
|---|---|---|---|
| 生态敏感性 | 高程 坡度 地形起伏度 | 正 正 正 | 0.062 0.043 0.027 |
| 景观破碎度 土壤侵蚀程度 年均降水量 | 正 正 负 | 0.085 0.092 0.055 | |
| 年均气温 | 负 | 0.036 | |
| 生态恢复力 | FVC 景观干扰度指数 NPP | 负 正 负 | 0.125 0.145 0.130 |
| 生态压力度 | 人均GDP 人口密度 人类足迹数据 | 正 正 正 | 0.044 0.074 0.082 |
2.2.2 评价指标数据标准化
各类评价指标差异较大,具有不同的单位量纲且数据源均不一致,为确保评价指标具有合理性和可比性,需要对原始数据进行标准化处理。正向和负向标准化计算公式分别为:
式中:
2.2.3 生态脆弱性评价模型
式中: Ai为第i个主成分贡献率;
EVI计算公式为:
式中 Pi为第i个主成分标准化值。
生态恢复力计算公式为:
式中: R为生态恢复力; Wi为生态恢复力指标权重; Ri为第i个生态恢复力指标。
2.2.4 生态脆弱性分级
表2 新疆地区SRP模型生态脆弱性分级标准
Tab.2
| 等级 | 取值范围 | 脆弱性 分类 | 恢复力 等级 | 生态特征 |
|---|---|---|---|---|
| Ⅰ | (0,0.2] | 微度脆弱 | 5级 | 生态功能完整,抗外界干扰和自我恢复能力强 |
| Ⅱ | (0.2,0.4] | 轻度脆弱 | 4级 | 生态功能较为完善,抗外界干扰和自我恢复能力较强 |
| Ⅲ | (0.4,0.6] | 中度脆弱 | 3级 | 生态功能一般,抗外界干扰和自我恢复能力较弱 |
| Ⅳ | (0.6,0.8] | 重度脆弱 | 2级 | 生态功能部分退化,抗外界干扰和自我恢复能力弱 |
| Ⅴ | (0.8,1] | 极度脆弱 | 1级 | 生态功能严重退化,抗外界干扰和自我恢复能力差 |
2.3 统计分析方法
局部空间自相关能有效表征一个区域及其邻域属性值的相关程度,利用GeoDA1.20[17]软件分析各网格单元间EVI指数的空间相关程度得到指标聚类图,包括高-高聚集区、低-低聚集区、高-低聚集区、低-高聚集区和不显著聚集区5种聚集模式。
变异系数(coefficient of variation,CV)是衡量序列观测值离散程度的一个计量,在地理数据的空间差异研究中已得到广泛应用[40]。一般通过CV分析法来测度EVI的空间差异程度,CV越小,表明区域内生态脆弱性空间格局越均衡。研究将CV分为4个等级: 非常稳定(CV≤0.1)、稳定(0.1<CV≤0.2)、不稳定(0.2<CV≤0.3)和很不稳定(CV>0.3)。
表3 未来变化趋势分级
Tab.3
| 取值范围 | 变化趋势 |
|---|---|
| θslope<0,0.5<H<1 | 持续改善 |
| θslope<0,0<H<0.5 | 反持续性改善 |
| θslope>0,0.5<H<1 | 持续恶化 |
| θslope>0,0<H<0.5 | 反持续性恶化 |
| H=0.5 | 无法预测 |
相关性分析主要用来反映各个因子之间的相关程度和相关方向,本研究采用皮尔森相关系数法探讨新疆生态脆弱性与干旱之间的响应关系; 采用F显著性检验,将相关性研究结果分为5类: 显著正相关、显著负相关、不显著正相关、不显著负相关、不相关。
3 结果与分析
3.1 2000—2020年新疆干旱时空演变特征
3.1.1 干旱年际变化特征
由图2可知,新疆地区2000—2020年SPEI以年均0.093 9的速率呈下降趋势,其范围在-2.42~1.15之间,全区21 a间整体上呈现干旱加重趋势。具体而言,2000—2006年SPEI相对较高,是较为湿润的时期; 由M-K检验可知,在显著水平0.05界限内,UF和UB曲线相交于2010年前后,表明新疆地区的干旱发生突变,由湿润转为干旱; 自2012年以后SPEI以负值为主,区域干旱程度明显加重,尤其在2020年发生异常干旱。根据《2020年度新疆维吾尔自治区气候公报》记录(http: //xj.cma.gov.cn/),2020年新疆大部分地区气温偏高、降水偏少,尤其春季北疆东疆异常偏高,为有记录以来最暖年份,导致区域重旱、极端干旱事件频发。
图2
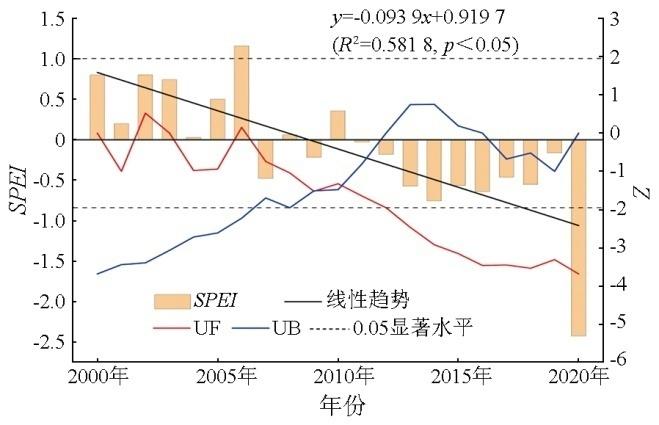
图2
新疆SPEI年际变化及M-K突变检验
Fig.2
Interannual variation of SPEI and M-K mutation test in Xinjiang
3.1.2 干旱空间变化特征
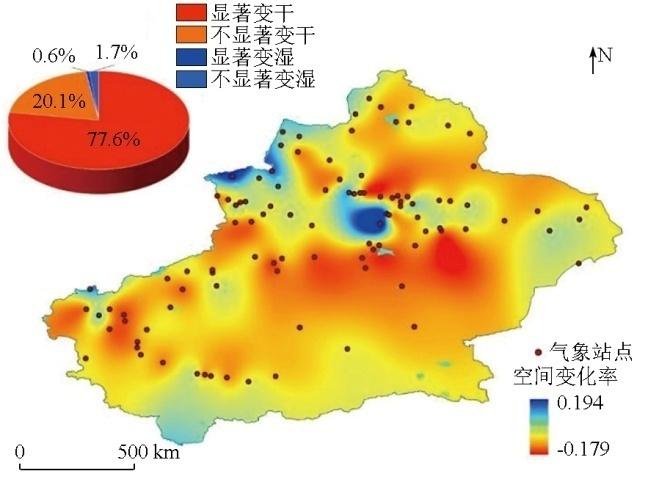
图3为新疆地区年际SPEI空间变化率分布示意图,饼状图表示干旱状况的面积占比。新疆地区特殊的地理生态环境引起气温、降水等气象要素在空间上分布不均匀,导致干旱的空间分布也较为复杂,年尺度的SPEI空间变化率存在一定的空间异质性。南疆地区干旱变化趋势较大,变干区域面积占比可达97.7%,其中显著变干区域占比20.1%; 天山山脉和昆仑山区域SPEI变化率相对较小,除天山大西沟、温泉和阿拉山口等天山山脉的少量站点为显著变湿趋势外(面积占比较小),其余站点的干旱呈现缓和的状态; 总体而言,随着全球气候变暖加剧,新疆区域干旱化程度加重的趋势非常明显。
图3
3.2 2000—2020年新疆生态脆弱性时空演变特征
3.2.1 新疆生态脆弱性时间变化规律
2000—2020年新疆生态系统平均EVI为0.68,最小值为2012年的0.41,最大值为2018年的0.89,近21 a来EVI波动较大,整体以年均0.009 3的速率呈上升趋势,如图4(a)。为了进一步量化生态系统脆弱性的变化特征,对生态脆弱性分类结果进行了区域统计,见图4(b),2000年极度脆弱区所占比例最高,为35.57%,重度脆弱区次之; 到2010年时,极度脆弱区面积进一步扩大为39.66%,中度脆弱区次之,中度脆弱区面积减小,同时,微度和轻度脆弱区面积扩大; 到2020年,极度脆弱区面积比2010年增加了2.8%,以极度、重度和中度脆弱区为主,说明随着区域干旱状况的加重,新疆生态系统更加脆弱,易受到外界因素的干扰而导致生态系统破坏。
图4
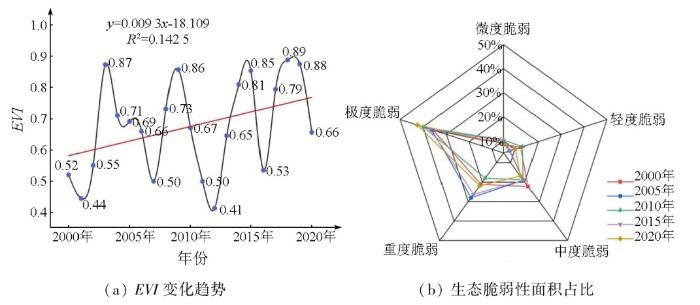
图4
2000—2020年EVI年际变化趋势及脆弱性面积占比示意图
Fig.4
Interannual change trend of EVI and the proportion of vulnerability area during 2000 to 2020
面积转移矩阵通常用于描绘随时间变化而改变的脆弱性空间模式,可定量描述系统状态间的转移,包含某个时期内区域生态脆弱性的静态数据和各类型间相互转化的动态数据[43]。如图5所示,不同脆弱性等级之间的面积转化较为显著,尤其是相邻等级。2000—2005年,重度脆弱区面积显著扩大,主要由中度脆弱区转化而来,面积占比62.24%,微度和极度脆弱区的转移面积变化不大; 2005—2010年,重度脆弱区转出面积最大(48.42×10⁴ km2),其中45.8%和38.12%分别转为了中度和极度脆弱区,轻度脆弱区转入面积明显扩大; 2010—2015年轻度脆弱区转出面积最大(23.92×10⁴ km2),绝大部分(72.38%)转为中度脆弱区,重度脆弱区转入面积最大(29.54×10⁴ km2),其中57.72%和39.15%分别转自于中度和极度脆弱区; 2015—2020年重度脆弱区转出面积最大(26.68×10⁴ km2),中度脆弱区次之,极度脆弱区转入面积最大(16.95×10⁴ km2),绝大部分(92.95%)来自重度脆弱区,微度脆弱区的转入面积最小,仅为2.37×10⁴ km2。
图5
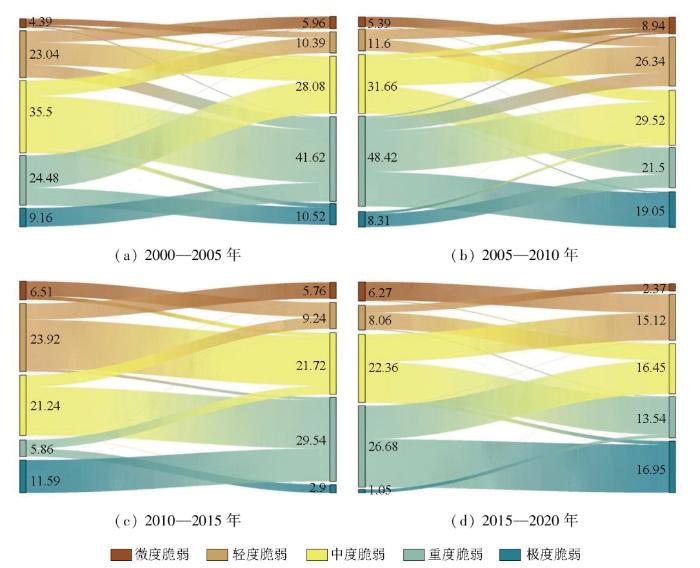
图5
2000—2020年新疆生态脆弱性转移矩阵桑基图(单位: 104 km2)
Fig.5
Sanji diagram of ecological vulnerability transfer matrix in Xinjiang from 2000 to 2020 (unit: 104 km2)
3.2.2 新疆生态脆弱性空间分布规律
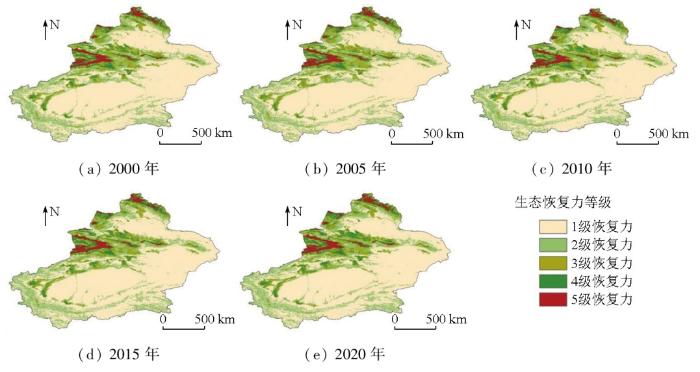
1)生态恢复力空间分布。如图6所示,2000—2020年生态恢复力空间变化趋势并不明显,总体上看,生态恢复力低(1级)的区域面积占比均可达60%以上,广泛分布在东南部戈壁、荒漠等植被覆盖度低的区域,当受到外界干扰时,生态系统状态易被破坏,生态恢复力差; 2级生态恢复力占比较高,以昆仑山脉和天山南部为主,这些地区植被覆盖以高寒草原草甸为主,生态恢复力相对较差; 新疆西北部包括阿尔泰山、塔城地区和天山山脉中部以及南疆环塔克拉玛干沙漠绿洲区,生态恢复力较高,区域可持续发展基础良好。
图6
2)生态脆弱性空间分布。2000—2020年新疆生态脆弱性整体处于中度脆弱及以上(图7),面积占比可达75%。总体而言,西北、中部山区、环塔克拉玛干沙漠的绿洲区及昆仑山脉脆弱性低,东南部沙漠区域脆弱性高。微度和轻度脆弱区集中在伊犁自治州、阿勒泰北部山区、塔城地区西部等,天山山脉中部高海拔林草生物资源丰富、生态系统相对稳定。伊犁地区独特的地形地貌特征,使其常年受到大西洋水汽的滋养,气候温和湿润,植被覆盖度高,人类活动干扰少,生境质量较高[44],生态脆弱性相对较低; 阿勒泰山区林地面积占比较大,人口密度相对较小,区域生态环境良好; 塔城地区草业资源丰富,通过有效的草地生态环境保护能有效提高区域应对外界干扰的能力,降低生态脆弱性。中度脆弱区面积占比相对较小(约20%),分布区域较为零散,以沙漠周边的绿洲生态区为主,受人为活动的干扰强,生态压力较大,使得中度脆弱区易向重度或极度脆弱区转化,所以降低不合理人为活动对当地生态环境的干扰至关重要。重度和极度脆弱区面积分布较广,以东南部和北部沙漠区为主,其中东南部极度脆弱区面积占比35%以上; 研究表明,水资源的分布情况与生态脆弱性的空间分布密切相关[45],东南部荒漠区为全疆典型的干旱少雨区,区域内沙漠、戈壁广布,植被分布稀疏,受风力侵蚀作用的强烈影响,生态脆弱性极高。
图7
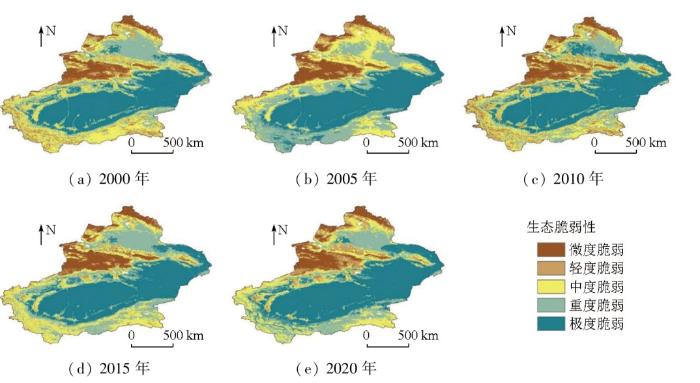
图7
生态系统脆弱性空间格局分布
Fig.7
Spatial pattern distribution of ecosystem vulnerability
3)生态脆弱性空间自相关分析。新疆地区生态脆弱性空间聚集格局整体变化不大,如图8所示,东南部和北部少数区域为高-高聚集区,约占总面积的31.8%; 西北部和中部天山山脉以及南部昆仑山小部分区域为低-低聚集区,面积约占18.6%。具体来说,2000—2010年,高-高聚集区范围扩展至准噶尔盆地区域,低-低聚集区范围在南疆地区先减少后增加; 2010—2015年高-高和低-低聚集区的面积明显缩减,南疆地区低-低聚集区基本上全转为不显著聚集区; 2015—2020年聚集区的分布没有明显变化,基本一致。
图8
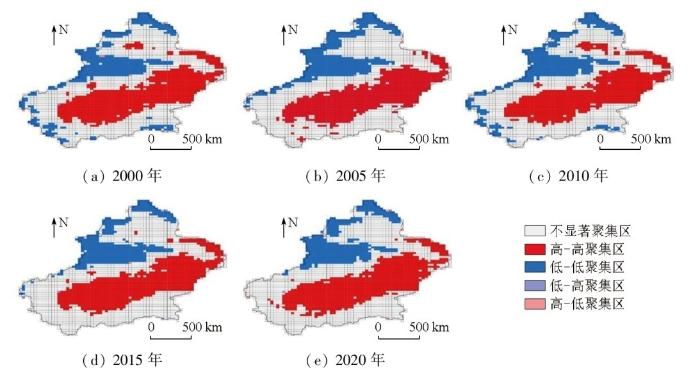
图8
2000—2020年新疆地区脆弱性指数空间集聚图
Fig.8
Spatial clustering map of vulnerability index in Xinjiang from 2000 to 2020
4)生态脆弱性空间稳定性分析。通过空间统计分析与制图,得到新疆生态稳定性空间格局示意图(图9),EVI的变异系数CV集中于0~0.37,平均值为0.15,表明生态脆弱性在空间分布上存在明显差异。非常稳定区域(CV≤0.1)面积占比39.9%,主要分布于东南部荒漠地区,植被覆盖度低,以极度脆弱区为主,整体变化幅度较小; 稳定区(0.1<CV≤0.2)面积占比37.9%,相对较高,以北疆准噶尔盆地周边和昆仑山脉东侧为主; 不稳定区(0.2<CV≤0.3)和很不稳定区(CV>0.3)广泛分布于中度脆弱区及以下,以新疆西北部、天山山脉和南疆环塔克拉玛干沙漠等绿洲区为主,区域生态环境相对良好,但受自然和人为活动干扰强烈,整体波动较大,需要重点加强生态环境保护。
图9
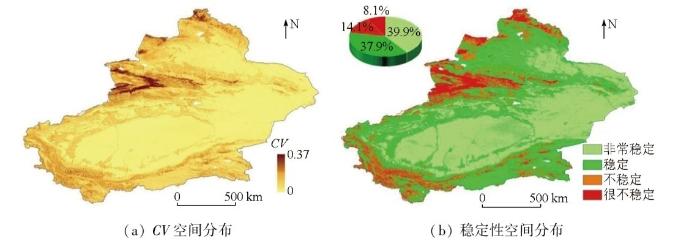
图9
EVI变异系数及其空间稳定性示意图
Fig.9
EVI coefficient of variation and its spatial stability diagram
3.3 干旱与生态脆弱性的相关性分析
通过逐像元皮尔森相关分析分别研究年尺度干旱指数SPEI与生态恢复力和脆弱性的相关性。由图10可知干旱与生态恢复力呈正相关的面积占比56%,相关系数大于0.3的面积占比34%,其中通过呈显著正相关的面积占比6.5%,说明当干旱状况加重时(即年平均SPEI较低),大部分地区生态恢复力较低,植被覆盖度下降,无法有效抵御外界因素的干扰,区域生态的自我修复能力减弱,主要在昆仑山脉、塔里木盆地南部、北疆阿尔泰山、塔城地区和天山山脉中段。干旱与生态恢复力呈负相关的区域占比约为40%,相关系数小于-0.3的面积占比约为23.04%,主要分布于塔里木盆地北部、西南部、环塔绿洲区以及吐哈盆地,说明当区域水分状况改善时,自然植被覆盖度提高,生态恢复力反而降低,表明当地恢复力受到人为活动的强烈影响。
图10
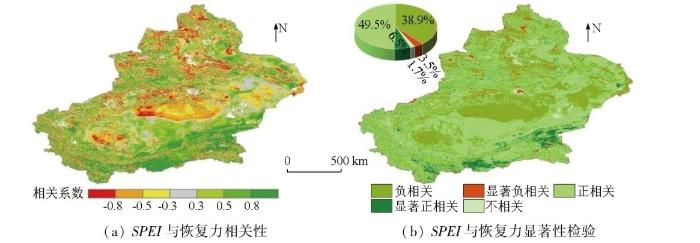
图10
SPEI与恢复力相关系数及显著性分类结果
Fig.10
Correlation coefficient and classification results of significance between SPEI and resilience
干旱与EVI的相关系数及相关性的显著分类如图11所示,两者呈负相关的面积占比达到54.1%,其中显著负相关占比6.5%。SPEI与EVI相关系数小于-0.3的面积约27.17%,主要分布于塔里木盆地西部、东南部以及吐哈盆地南部区域,说明当地生态脆弱性受区域干旱状况的影响强烈,即随着干旱指数SPEI增加,水分条件改善,EVI减小,区域生态脆弱性降低。干旱与EVI呈正相关面积占比44.3%,通过显著性检验面积仅占2%,广泛分布于北疆阿尔泰山、伊犁地区、准噶尔盆地南部和吐哈盆地。随着区域干旱状况缓解,EVI反而呈增加趋势,说明干旱并非导致区域生态环境脆弱的主要因素,可能由于不合理的放牧、开垦等人为因素干扰,亦会导致区域生态脆弱状况加重,制约区域生态可持续发展。
图11
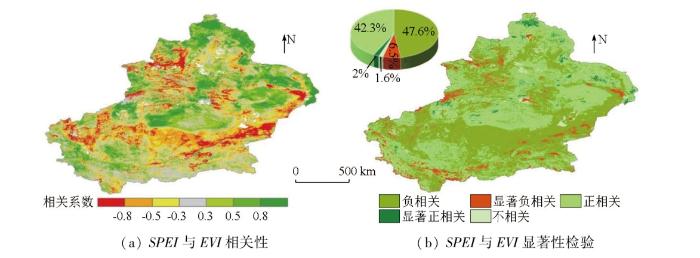
图11
SPEI与EVI相关系数及显著性分类结果
Fig.11
Correlation coefficient and classification results of significance between SPEI and EVI
3.4 新疆生态环境未来变化趋势预测
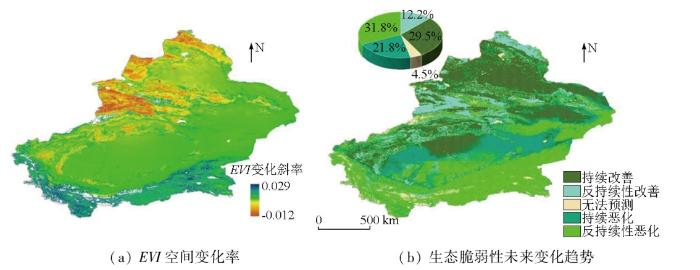
如图12所示,θslope较高的区域主要位于昆仑山区,而阿尔泰山、塔城地区和天山山脉变化率为负值。生态环境呈恶化趋势的面积占比34%,位于塔里木盆地西部、吐哈盆地南部、天山山脉和阿尔泰山地区,可能由于未来自然和人为活动的干扰,进而导致区域生态脆弱状况加重。生态环境持续改善(θslope<0,0.5<H<1)的区域面积占比29.5%,以塔里木盆地、吐哈盆地北部和北疆大部分地区为主,反持续性恶化(θslope>0,0<H<0.5)面积占比31.8%,广泛分布于塔克拉玛干沙漠南部和昆仑山区。总的来说,未来新疆大部分地区(61.3%)生态脆弱性降低,生态环境呈现改善趋势,主要是由于新疆近年来牢固树立和践行“绿水青山就是金山银山”理念,同时颁布各种生态环境保护政策法规,如《新疆维吾尔自治区环境保护条例》《新疆生态环境保护“十四五”规划》等,使得全区生态环境质量能够得到持续改善。
图12
4 讨论与结论
4.1 讨论
本研究表明,新疆生态脆弱性的空间分布存在明显的地域差异性且空间聚集性特征明显,这与Cai等[46]、孙桂丽等[16]和岳笑等[47]的研究结果相一致,原因可能是新疆区域属于典型温带大陆性气候,大部分地区气候干燥且降水偏少,土质层浅薄,植被条件相对较差,因此对气候变化具有较强的敏感性[48]。干旱和生态脆弱性之间存在着相互作用关系,脆弱的生态系统对干旱更为敏感,而干旱又会加剧生态系统的脆弱性,形成恶性循环。生态脆弱性的稳定分布区域面积占比较高,以重度和极度脆弱区为主,这主要是由于塔克拉玛干沙漠和吐哈盆地等地区独特的自然地理条件,常年气候干燥且降水偏少、蒸发量大,使得该区域为重度脆弱区且长时间未发生明显变化。本研究仍存在一些局限性,首先,生态脆弱性评价是个复杂的机理过程,外部压力如何影响生态系统及其发展过程以及生态脆弱性实地验证的问题仍难以解决,后续研究应进一步夯实生态脆弱性的理论基础,完善实地验证方法; 其次,本文重点讨论了气候变化条件下干旱对脆弱性的影响,而生态脆弱性问题主要涉及气候变化、水资源、生态系统多样性、人类活动和土地利用变化等多个方面,如何综合定量评估各因子对生态脆弱性的影响,并针对性提出具体的生态保护措施,对于维持区域可持续发展战略至关重要。
4.2 结论
本研究基于SRP模型,在充分考虑新疆地区生态环境特点及脆弱性主要成因的基础上,明晰2000—2020年新疆生态系统恢复力和脆弱性的时空演变特征,探究脆弱性状态的稳定性及预测未来变化趋势,进一步阐释干旱对生态恢复力和脆弱性的影响。研究结论如下:
1)2000—2020年新疆地区EVI以年均0.009 3的速率呈上升趋势,整体生态脆弱性较高,大部分地区(60%)生态恢复力较低,新疆北部和东南部荒漠、戈壁等植被覆盖度低的区域生态脆弱等级较高,中部天山山脉高海拔林草丰富地区脆弱性等级相对较低; 相邻脆弱性等级之间的面积转化较为显著,脆弱性空间分布存在明显的地域差异性且呈现空间聚集性特征; 干旱指数SPEI以年均0.093 9的速率呈下降趋势,区域整体干旱化程度加重的趋势较为明显。
2)干旱与生态恢复力呈正相关的面积占比56%,说明当干旱状况加重时,大部分地区生态恢复力较低,区域生态系统的自我修复能力减弱; 干旱与EVI呈负相关面积占比达到54.1%,说明随着干旱指数SPEI增加,区域水分条件改善,生态脆弱性降低。
3)新疆地区EVI的变异系数集中于0~0.37,平均值为0.15,生态脆弱性的稳定分布区域面积占比77.8%,以重度和极度脆弱区为主,趋势的预测结果表明,未来新疆大部分地区(61.3%)生态脆弱性呈降低趋势,生态环境质量得到进一步改善。
志谢
感谢自治区级产学研联合培养研究生基地——新疆草原总站提供的资料与实验平台支持。
参考文献
A framework for vulnerability analysis in sustainability science
[J].
DOI:10.1073/pnas.1231335100
PMID:12792023
[本文引用: 1]

Global environmental change and sustainability science increasingly recognize the need to address the consequences of changes taking place in the structure and function of the biosphere. These changes raise questions such as: Who and what are vulnerable to the multiple environmental changes underway, and where? Research demonstrates that vulnerability is registered not by exposure to hazards (perturbations and stresses) alone but also resides in the sensitivity and resilience of the system experiencing such hazards. This recognition requires revisions and enlargements in the basic design of vulnerability assessments, including the capacity to treat coupled human-environment systems and those linkages within and without the systems that affect their vulnerability. A vulnerability framework for the assessment of coupled human-environment systems is presented.
全球气候变暖:浅谈从AR5到AR6的认知进展
[J].
Global warming:Scientific progress from AR5 to AR6
[J].
Drought under global warming and climate change:An empirical study of the Loess Plateau
[J].
Excess forest mortality is consis-tently linked to drought across Europe
[J].
Future rice farming threatened by drought in the Lower Mekong Basin
[J].
DOI:10.1038/s41598-021-88405-2
PMID:33931657
The Lower Mekong River basin (LMB) has experienced droughts in recent decades, causing detrimental economic losses and food security conundrums. This study quantified the impact of climate change on drought, and rainfed rice production in the LMB. The Soil and Water Assessment Tool (SWAT) and AquaCrop models were used to evaluate long-term drought indices and rainfed rice yields under historical and future climate conditions (1954-2099) with four climate models and two emission scenarios (RCP 4.5 and RCP8.5) from the Coupled Model Intercomparison Project Phase 5 (CMIP5). We found that rice yield might increase (24-43%) due to the elevated levels of atmospheric CO concentration (+ 34.3 to + 121.9%) and increases in precipitation. Contrastingly, considerable decreases in rice yield up to 1.5 ton/ha in the Vietnam Central High Plain (VCHP) region could be expected resulting from reduced precipitation by about 34% during drought years. To avert any major food crisis, an expansion of irrigation areas could be required to compensate for the expected reduction in rice yields. We conclude that a framework combining hydrology and crop models to assess climate change impacts on food production is key to develop adaptation strategies in the future.
Plant functional traits and climate influence drought intensification and land-atmosphere feedbacks
[J].
DOI:10.1073/pnas.1904747116
PMID:31235581
[本文引用: 1]
The fluxes of energy, water, and carbon from terrestrial ecosystems influence the atmosphere. Land-atmosphere feedbacks can intensify extreme climate events like severe droughts and heatwaves because low soil moisture decreases both evaporation and plant transpiration and increases local temperature. Here, we combine data from a network of temperate and boreal eddy covariance towers, satellite data, plant trait datasets, and a mechanistic vegetation model to diagnose the controls of soil moisture feedbacks to drought. We find that climate and plant functional traits, particularly those related to maximum leaf gas exchange rate and water transport through the plant hydraulic continuum, jointly affect drought intensification. Our results reveal that plant physiological traits directly affect drought intensification and indicate that inclusion of plant hydraulic transport mechanisms in models may be critical for accurately simulating land-atmosphere feedbacks and climate extremes under climate change.Copyright © 2019 the Author(s). Published by PNAS.
生态脆弱性综合评价方法与应用
[J].
Method and application of ecolo-gical frangibility assessment
[J].
The impact of climate change on runoff in the southeastern Tibetan Plateau
[J].
Vulnerability to climate warming and acclimation capacity of tropical and temperate coastal organisms
[J].
基于SRP模型的石羊河流域生态脆弱性评价
[J].
Ecological vulnerability assessment of Shiyang River Basin based on SRP model
[J].
2000—2015年内蒙古地区土地沙漠化脆弱性评估
[J].
Assessment of the land desertification vulnerability in Inner Mongolia during the period 2000—2015
[J].
基于GIS的浙江海宁尖山新区景观规划用地适宜性评价
[J].
Land suitability evaluation for landscape planning in Jianshan new district based on GIS
[J].
西北干旱区生态脆弱性时空演变分析
[J].
Analysis on spatio-temporal evolution of ecological vulnerability in arid areas of Northwest China
[J].
长江经济带景观格局对生态系统服务价值影响的概率评估
[J].
Probability evaluation of the impact of landscape pattern on ecosystem service value in the Yangtze River Economic Belt
[J].
基于SRP模型的内蒙古鄂伦春地区生态脆弱性评价
[J].
Ecological vulnerability assessment of Oroqen Region in the Inner Mongolia based on SRP model
[J].
新疆生态脆弱性时空演变及驱动力分析
[J].
DOI:10.13866/j.azr.2022.01.25
[本文引用: 3]
生态脆弱性评价是了解区域生态状况的重要途径,科学评估生态脆弱性等级及变化对区域生态保护与建设,实现区域可持续发展具有重要意义。研究利用SRP模型构建新疆生态脆弱性评价指标体系,结合空间主成分分析方法构建生态脆弱性指数评价模型,分析新疆生态脆弱性时空演变特征。结果表明:(1) 2000—2018年,新疆生态敏感性整体为中度敏感,呈现东南高西北低,主要受景观破碎度和土壤侵蚀程度影响;生态恢复力受植被覆盖度影响较大,整体呈西北高、东南低,变化幅度小,恢复力较弱;生态压力大致呈南、北部的山区和中部绿洲区、山区高、东南低,主要影响因子是人均GDP、农业依赖度和人口密度。(2) 2000—2018年新疆生态脆弱性整体处于中度脆弱到重度脆弱。南、北部植被覆盖度低的地区生态脆弱等级较高,中部高海拔林草丰富地区生态脆弱性等级相对较低;2000—2018年新疆生态脆弱性综合指数呈现先增长后降低趋势。(3) 生态脆弱性主要驱动力方面,人为活动因子的农业依赖度、人口密度、土地垦殖率,自然环境因子的生境质量指数、景观破碎度、景观恢复力指数和年均降水量7个指标是新疆2000—2018年生态脆弱性变化的主要单因子;生境质量指数、景观恢复力指数、景观破碎度指数、植被覆盖率的变化与区域人类活动的相互作用是促使新疆生态脆弱性的主要驱动力。
Spatio-temporal variation of ecological vulnerability in Xinjiang and driving force analysis
[J].
DOI:10.13866/j.azr.2022.01.25
[本文引用: 3]
Ecological vulnerability assessment is an important way to understand regional ecological conditions. There are great significance for regional ecological protection and construction. This study establishes ecological vulnerability evaluation index system based on the SRP model, analyze the spatial and temporal distribution characteristics and driving forces of ecological vulnerability in Xinjiang from 2000 to 2018. The main conclusions are as follows: (1) From 2000 to 2018, the ecological sensitivity index was generally at moderate sensitivity, showing high in the southeast and low in the northwest, and it was greatly affected by landscape fragmentation and soil erosion. The ecological resilience index was mainly affected by vegetation coverage, high in northwest and low in southeast, and it was relatively stable, mainly low-recovery states. The ecological stress index was mainly influenced by per capita GDP, agricultural dependence, and population density. It was high in the northern, southern mountainous areas and central Oasis and mountainous, and low in the southeast. (2) Ecological vulnerability was overall moderate to severely fragile level from 2000 to 2018 in Xinjiang. In north and south of Xinjiang, there are low vegetation coverage, low rainfall, and high aridity, so higher ecological fragility was observed. In contrast, the high-altitude areas dominated by woodlands and grasslands in central area are rich in biodiversity, and so ecological vulnerability was relatively low. Overall, the comprehensive index of ecological vulnerability showed an initial increasing trend, followed by a decrease. (3) Drivers of ecological vulnerability in Xinjiang, agricultural dependence, population density, and land reclamation rate of anthropogenic factors and habitat quality index, landscape fragmentation, landscape resilience index, and annual average precipitation of natural environmental factors are mainly single factors. The interaction of these factors, including habitat quality index, landscape resilience index, landscape fragmentation index, vegetation coverage, and regional human activities are the main driving forces.
基于SRP模型的多尺度生态脆弱性动态评价——以江西省鄱阳县为例
[J].
Dynamic assessment of multi-scale Eco-environmental vulnerability based on SRP model in Poyang County
[J].
A multiscalar drought index sensitive to global warming:The standardized precipi-tation evapotranspiration index
[J].
Characteristics and trends in various forms of the Palmer drought severity index during 1900—2008
[J].
The relationship of drought frequency and duration to time scales
[J].
Ecosystems threatened by intensified drought with divergent vulnerability
[J].
干旱对生态系统脆弱性的影响研究——以长江中下游地区为例
[J].
Assessment on ecosystem vulnerability to drought:The case study of the middle and lower reaches of the Yangtze River
[J].
Spatiotemporal evolution of ecological vulnerability in the Yellow River Basin under ecological restoration initiatives
[J].
Hyposensitive canopy conductance renders ecosystems vulnerable to meteorological droughts
[J].
气候干旱化背景下云南地区生态系统脆弱性的变化特征
[J].
Variation of ecosystem vulnerability under the background of climate aridity change in Yunnan Variation
[J].
基于LUCC的新疆沙尘源空间格局及转化机理分析
[J].
Transformation and spatio-temporal distribution of sand-dust sources in Xinjiang based on LUCC
[J].
Recent climate and hydrological changes in a mountain-basin system in Xinjiang,China
[J].
安徽安庆菜子湖国家湿地公园景观格局变化对鸟类多样性的影响
[J].
Effects of landscape pattern change on bird diversity in Anhui Anqing Caizi Lake National Wetland Park
[J].
DOI:DOI: 10.13292/j.1000-4890.202107.004
[本文引用: 1]
Wetland landscape patterns of shallow riverconnected lakes exhibit distinct seasonal dynamics under natural hydrological regime. To elucidate the impacts of landscape pattern changes on bird diversity, we investigated the distribution of bird species and abundance in Anhui Anqing Caizi Lake National Wetland Park during the high (August-October 2019) and low (November 2019-January 2020) water seasons. The characteristics of landscape elements were analyzed using the landscape pattern index method based on remote sensing image data, and the relationship between bird diversity and landscape elements was studied. The results showed that there were 11 orders, 31 families, and 61 species of birds in the park. Among all the recorded species, three species were under the national Class Ⅰ key protection, six species were under the national Class Ⅱ key protection, and 15 species were under the key protection of Anhui Province. During the highwater season, birds were mainly distributed in the rational utilization zone and were predominantly forest birds. During the lowwater season, birds were concentrated in an ecological conservation zone and were primarily Anseriformes, with a maximum number of 10974 individuals. Species richness and bird diversity index were higher in the highwater season than in the low-water season, whereas the abundance of water birds was higher in the low-water season than in the highwater season. Bird diversity index was significantly higher in rational utilization zone than that in other functional zones, with a decreased diversity index monthly. The results of canonical correspondence analysis showed that landscape diversity index, uniformity index, fragmentation, mudflat area, and grassland area were the main factors influencing bird diversity in the wetland park.
基于景观结构的吉林西部生态安全动态分析
[J].
Analysis on the dynamic trend of ecological security in the west part of Jilin Province,China based on the landscape structure
[J].
新疆玛纳斯河流域绿洲景观生态脆弱性时空分异
[J].
Spatiotemporal variation of landscape ecological vulnerability in oasis in the Manas River Basin,Xinjiang
[J].
Global acceleration in rates of vegetation change over the past 18,000 years
[J].
DOI:10.1126/science.abg1685
PMID:34016781
[本文引用: 1]
Global vegetation over the past 18,000 years has been transformed first by the climate changes that accompanied the last deglaciation and again by increasing human pressures; however, the magnitude and patterns of rates of vegetation change are poorly understood globally. Using a compilation of 1181 fossil pollen sequences and newly developed statistical methods, we detect a worldwide acceleration in the rates of vegetation compositional change beginning between 4.6 and 2.9 thousand years ago that is globally unprecedented over the past 18,000 years in both magnitude and extent. Late Holocene rates of change equal or exceed the deglacial rates for all continents, which suggests that the scale of human effects on terrestrial ecosystems exceeds even the climate-driven transformations of the last deglaciation. The acceleration of biodiversity change demonstrated in ecological datasets from the past century began millennia ago.Copyright © 2021 The Authors, some rights reserved; exclusive licensee American Association for the Advancement of Science. No claim to original U.S. Government Works.
A global record of annual terrestrial human footprint dataset from 2000 to 2018
[J].
DOI:10.1038/s41597-022-01284-8
PMID:35440581
[本文引用: 1]
Human Footprint, the pressure imposed on the eco-environment by changing ecological processes and natural landscapes, is raising worldwide concerns on biodiversity and ecological conservation. Due to the lack of spatiotemporally consistent datasets of Human Footprint over a long temporal span, many relevant studies on this topic have been limited. Here, we mapped the annual dynamics of the global Human Footprint from 2000 to 2018 using eight variables that reflect different aspects of human pressures. The accuracy assessment revealed a good agreement between our mapped results and the previously developed datasets in different years. We found more than two million km of wilderness (i.e., regions with Human Footprint values below one) were lost over the past two decades. The biome dominated by mangroves experienced the most significant loss (i.e., above 5%) of wilderness, likely attributed to intensified human activities in coastal areas. The derived annual and spatiotemporally consistent global Human Footprint can be a fundamental dataset for many relevant studies about human activities and natural resources.© 2022. The Author(s).
1990—2020年黑龙江省植被覆盖度的时空变化趋势及驱动力
[J].
DOI:10.13287/j.1001-9332.202305.021
[本文引用: 1]
植被覆盖度(FVC)作为表征植被生长状况与生态系统变化的定量指标,其时空变化趋势及驱动力是全球及区域生态环境的重要研究内容。本研究基于GEE云计算平台,应用像元二分模型对黑龙江省1990—2020年FVC进行估测,并通过Mann-Kendall突变检验、Sen趋势分析、Mann-Kendall显著性检验、相关性分析及结构方程模型,分析FVC的时空变化趋势及驱动力。结果表明: 基于像元二分模型法计算研究区FVC具有较高精度(R<sup>2</sup>>0.7、均方根误差<0.1、相对均方根误差<14%)。1990—2020年,黑龙江省年均FVC为0.79,呈波动上升趋势(0.72~0.85),年均增长0.4%,市级行政区年均FVC也呈不同程度的增长。黑龙江省以极高FVC类型为主,其面积占比逐渐增加。FVC呈增加趋势的面积占比为67.4%,呈减小趋势的面积占比为26.2%,其余保持不变。人为活动因子对年均FVC的相关性高于生长季月平均气象因子对年均FVC的相关性。人为活动因子是黑龙江省FVC变化的主要驱动因子,其次为土地利用类型,而生长季月平均气象因子对FVC变化的总影响为负。本研究结果可为黑龙江省长时间植被覆盖监测与驱动力分析提供技术支撑,也为生态环境的恢复与保护、相关土地利用政策的制定提供了依据。
Spatial and temporal trends and drivers of fractional vegetation cover in Heilongjiang Province,China during 1990—2020
[J].
喀斯特山区生态脆弱性与经济贫困的耦合关系——以贵州省荔波县为例
[J].
Coupling relation between ecological vulnerability and economic poverty in Karst Mountain Area:A case study at Libo County of Guizhou Province
[J].
五台山地区生态脆弱性评价及其时空变化
[J].
Ecological vulnerability assessment and its temporal and spatial changes in Wutai Mountain Area
[J].
陕北黄土高原生态脆弱性时空变异及驱动因素分析
[J].
DOI:10.12118/j.issn.1000-6060.2023.027
[本文引用: 1]
在多源数据的支撑下,基于敏感性-恢复力-压力模型构建评估指标体系,分析生态恢复工程实施前后(1997年和2021年)陕北黄土高原不同行政区、不同生态功能区和不同坡度的生态脆弱性时空分异规律及驱动机制。结果表明:(1) 陕北黄土高原生态脆弱性明显改善,生态脆弱性指数均值从41.74下降至32.96,减幅21.0%;生态脆弱性等级也整体下降,已由中脆弱和低脆弱性占主导转化为低脆弱性占主导的格局。生态脆弱性存在明显地带性分布特征,从南到北生态脆弱性等级逐步提高。(2) 1997—2021年,51.2%的区域生态脆弱性有所改善,以中脆弱改善到低脆弱为主;4.6%的区域生态脆弱性有所增加,以一般脆弱增加至低脆弱、低脆弱增加至中脆弱为主。铜川市、延安市和榆林市辖区内生态脆弱性指数和等级均在下降,其中铜川市生态脆弱性最低,榆林市最高。3个生态功能区生态脆弱性指数和等级均在显著下降,降幅表现为:退耕还林区>风沙区>黄桥林区。(3) 符合退耕条件的区域,高等级脆弱性大幅转化为低等级脆弱性,生态脆弱性得到明显改善,工程取得了较为显著的成效。(4) 剖析驱动机制可以发现,人为因素和自然因素的驱动力各占83.1%和16.9%,说明生态恢复工程是区域生态脆弱性显著改善的主要驱动力。研究结果可为该区域生态恢复工程成效评估和生态可持续性修复提供科学的参考数据。
Spatiotemporal variation and driving factors of ecological vulnerability in the Loess Plateau of northern Shaanxi
[J].
DOI:10.12118/j.issn.1000-6060.2023.027
[本文引用: 1]
Studying spatiotemporal changes in ecological vulnerability in the Loess Plateau region of northern Shaanxi before and after the implementation of an ecological restoration project helps to understand the impact of the project implementation on regional ecological vulnerability and provides a scientific reference for the sustainable restoration of regional ecology. This study aims to provide a scientific foundation for the sustainable restoration of the ecology in this region by leveraging multisource data and an evaluation index system built around the sensitivity-resilience-stress model. The analysis encompasses the spatiotemporal variation of ecological vulnerability in different administrative regions, diverse ecological function areas, and varying slopes in the region before and after the implementation of the project (1997 and 2021) is analyzed with the driving mechanism. The results show the following key insights: (1) The ecological vulnerability in the Loess Plateau, China, was improved substantially. The mean regional ecological vulnerability index decreases from 41.74 to 32.96, a decrease of 21.0%. This shift transforms from medium and low vulnerability to a predominantly low vulnerability pattern. (2) Ecological vulnerability in the study area exhibits a zonal distribution, and the ecological vulnerability in the south is better than that in the north. From 1997 to 2021, 51.2% of the regional ecological vulnerability in the study area was improved, mainly from medium to low vulnerability, accounting for 75.3% of the total area improved, predominantly concentrated in farmland to forest and sandstorm areas. The second notable improvement involves the shift from low to general vulnerability, accounting for 16.9% of the improved areas, mainly within the Huangqiao forest area. Conversely, 4.6% of the regional ecological vulnerability increases in the study area, with general vulnerability rising to low and low vulnerability rising to medium, accounting for 52.9% and 45.6% of the increased area of ecological vulnerability, respectively. These increases are scattered in the sandstorm areas and Huangqiao forest areas. Among the administrative units, Tongchuan City is the lowest ecologically fragile, while Yulin City is the highest, with the most vulnerable areas concentrated in Yulin City. However, the ecological vulnerability index and grade declined in the three municipal districts. Similarly, the ecological vulnerability index and grade of the three ecofunctional areas considerably decreased, with the largest decrease in the area of returning farmland to forest, followed by the wind-sand areas, and finally, the Huangqiao forest area. (3) In designated cropland-to-forest conversion zones, high-grade vulnerability largely transforms into low-grade vulnerability, leading to noticeable regional ecological improvement. (4) Analysis of the driving mechanism reveals that the driving forces of human and natural factors account for 83.1% and 16.9%, respectively. This result shows that ecological restoration projects are the main driving force for the profound improvement of regional ecological vulnerability.
河湟地区生态脆弱性时空演变及影响因素研究
[J].
DOI:10.13866/j.azr.2023.06.15
[本文引用: 1]
基于暴露度-敏感性-适应力生态脆弱性概念模型构建评价指标体系,利用投影寻踪模型和遗传算法确定指标权重,计算了河湟地区生态脆弱性指数,采用时空扫描探究生态脆弱性空间聚集特征及时空变化规律,借助地理探测器研究生态脆弱性的影响因素。结果表明:2000—2020年河湟地区生态脆弱性以轻度脆弱与中度脆弱为主,空间分布存在明显的地域差异。生态脆弱性存在明显的时间聚集性与局部的空间聚集特征,高值集聚与低值集聚共存,空间集聚主要分布于甘肃省境内。2000—2020年生态脆弱度整体呈降低趋势,53.36%的土地生态脆弱性有所降低。对生态脆弱性影响最大的因子是植被覆盖度,其次是沙漠化指数、植被净初级生产力、干旱指数、生境质量指数、海拔等。
Spatial and temporal evolution of ecological vulnerability and its influencing factors in the Hehuang Area
[J].
DOI:10.13866/j.azr.2023.06.15
[本文引用: 1]
An evaluation index system was constructed based on a concept model for exposure sensitivity adaptation ecological vulnerability. A projection pursuit model and genetic algorithm were used to determine the index weight, and the ecological vulnerability index was calculated for the Hehuang region. Spatio-temporal scanning was used to explore the spatial aggregation characteristics and spatio-temporal change laws for ecological vulnerability. The factors influencing ecological vulnerability were explored with the aid of geographical detectors. From 2000 to 2020, the ecological vulnerability of the Hehuang region was found to predominately be light and medium, with obvious regional differences in the spatial distribution. Ecological vulnerability has obvious characteristics for time and local spatial aggregation. High value aggregation and low value aggregation can coexist, and spatial aggregation is mainly distributed in Gansu Province. From 2000 to 2020, the ecological vulnerability of 53.36% of the land decreased. The most influential factor on ecological vulnerability is vegetation coverage, followed by desertification index, net primary productivity of vegetation, drought index, habitat quality index, and altitude.
基于遥感的北方农牧交错带生态脆弱性评价
[J].
Eco-vulnerability assessment based on remote sensing in the Argo-pastoral ecotone of North China
[J].
Social vulnerability indicators in disasters:Findings from a systematic review
[J].
2000—2020年石羊河流域草地净初级生产力时空动态及其对气候的响应
[J].
Spatio-temporal dynamics and climate response of grassland net primary productivity in Shiyang River Basin from 2000 to 2020
[J].
2008—2018年伊犁河流域植被净初级生产力时空分异特征
[J].
Spatio-temporal characteristics of vegetation net primary productivity in the Ili River Basin from 2008 to 2018
[J].
A comparison of SSEBop-model-based evapotranspiration with eight evapotranspiration products in the Yellow River Basin,China
[J].
A study on the value of carbon compensation in the Huai River Basin based on land use from 2000 to 2020
[J].
人类活动及气候变化影响下伊犁河谷生境质量预测研究
[J].
DOI:10.12118/j.issn.1000-6060.2023.275
[本文引用: 1]
生境质量是衡量生态系统服务功能及其健康程度的重要指标,准确预测生境质量的演变对于推动区域生态环境的高质量发展至关重要。耦合系统动力学-斑块生成土地利用模拟(SD-PLUS)模型与生态系统服务和权衡的综合评估(InVEST)模型,预测了2035年不同气候情景下(SSP1-2.6、SSP2-4.5、SSP3-7.0、SSP5-8.5)伊犁河谷土地利用/覆被格局变化,并评估了其生境质量时空演变特征。结果表明:(1) 1980—2020年,伊犁河谷土地利用类型呈现“4增2减”的变化趋势。2035年4种气候情景下,伊犁河谷林草地面积降幅较大,建设用地扩张趋势较为明显,挤占了城郊优质耕地资源。(2) 伊犁河谷生境质量等级与土地利用/覆被类型密切相关。生境高值及较高值区主要分布在地形崎岖的林草地覆被区,低值及较低值区主要分布在人类活动集聚区及南北天山未利用地覆被区。(3) 1980—2020年,伊犁河谷生境质量呈现下降趋势。生境质量退化区主要分布在伊犁河-巩乃斯河流域以及特克斯河流域附近。(4) 2035年4种气候情景下,伊犁河谷生境指数持续走低。生境指数均值排序为:SSP1-2.6>SSP2-4.5>SSP3-7.0>SSP5-8.5。伊宁市、边境口岸、农牧业基地等区域生境质量存在退化风险。研究结果可为伊犁河谷地区生态修复政策的制定提供参考依据,为干旱区半干旱区生境质量预测提供新思路。
Prediction of habitat quality in the Ili River Valley under the influence of human activities and climate change
[J].
DOI:10.12118/j.issn.1000-6060.2023.275
[本文引用: 1]
Habitat quality is critical for ecosystem service function and overall health. Accurate prediction of its evolution is essential for fostering high-quality regional ecosystem development. This study employed the system dynamic patch-generating land use simulation (SD-PLUS) model and the integrated valuation of ecosystem services and trade-offs (InVEST) model to forecast land pattern changes, and evaluate the spatial-temporal evolution of habitat quality in the Ili River Valley under diverse 2035 climate scenarios (SSP1-2.6, SSP2-4.5, SSP3-7.0, SSP5-8.5). The findings are as follows: (1) From 1980 to 2020, Ili River Valley land use exhibited a “four increase and two decrease” trend. In 2035, under the four climate scenarios, forest and grassland areas in the Ili River Valley will decrease, with a noticeable trend of construction land expansion, leading to the displacement of high-quality arable land in the suburbs. (2) Habitat quality in the Ili River Valley correlates closely with land use/cover type. High- and higher-value habitat areas are primarily scattered in rugged forest and grassland cover areas. Low- and lower-value areas are mainly concentrated in areas with concentrated human activities and unused land cover areas in the north and south Tianshan Mountains. (3) From 1980 to 2020, the habitat quality in the Ili River Valley exhibited a declining trend, particularly in areas near the Ili-Kunes River and Tekes River Basins. (4) The habitat index of the Ili River Valley is projected to decrease under the four climate scenarios in 2035, with the mean value following the order: SSP1-2.6>SSP2-4.5>SSP3-7.0>SSP5-8.5. Notably, habitat quality in Yining City, border ports, and agricultural and livestock bases is at risk of degradation. In conclusion, the results of this study provide valuable insights for developing ecological restoration policies in the Ili River Valley region and offer innovative ideas for predicting habitat quality in arid and semi-arid areas.
南方水土流失严重区的生态脆弱性时空演变
[J].
Spatial and temporal changes of the ecological vulnerability in a serious soil erosion area,Southern China
[J].
Tempo-spatial changes of ecological vulnerability in the arid area based on ordered weighted average model
[J].
干旱—半干旱典型生态脆弱区生态脆弱性时空演变及驱动因子分析
[J].
Spatial-temporal variations and driving forces of the ecological vulnerability in the typical arid/semi-arid ecologically vulnerable areas
[J].
