0 引言
长江经济带覆盖中国11个省(市)[18],矿产资源丰富,有色金属、黑色金属、锂等战略新兴矿产以及磷矿、页岩气等在中国具有重要战略地位[19]。长期粗犷的矿山开采方式导致长江流域生态环境急剧退化,成为目前长江经济带发展面临的诸多问题之一[20-21]。近些年,国家出台了一系列政策,要求大力保护和修复长江生态环境。从生态文明建设在党的十八大被纳入“五位一体”总体布局和“四个全面”战略布局的重要内容后,党的十九大指出“建设生态文明是中华民族永续发展的千年大计”。修复长江经济带环境议题多次在推动长江经济带发展座谈会中被提出,并强调要“共抓大保护、不搞大开发”,逐步解决长江生态环境透支问题。2019年4月和5月,国家相关部委相继发布《长江经济带废弃露天矿山生态修复工作方案》《关于加快推进露天矿山综合整治工作实施意见的函》,要求对长江及其支流沿岸矿山企业开展生态修复工作,指出要加强露天矿山生态修复。根据解译结果,长江干流及主要支流两岸各10 km范围内废弃露天矿山图斑面积共1.74万hm2,图斑4 694处[22-23]。实施废弃矿山生态修复工程是适应社会主义生态文明建设的必然要求。2022年,生态环境部等17个部委联合印发《深入打好长江保护修复攻坚战行动方案》,要求持续推进相关重点区域生态保护和修复工程。
对废弃露天矿山生态修复进展监测也是一件重要的事情。传统的监测方式以人工实地查勘为主,耗时耗力,工作效率低。遥感技术具有全天候、宽覆盖、时效性强等特点,国内外已有众多学者成功将遥感技术应用于矿山开发监测[24-
截至目前,少有学者对长江经济带湖北段的废弃露天矿山生态修复工程动态变化情况进行系统的监测和分析。为了弥补这一不足,本文基于全覆盖、多期次的国产高空间分辨率遥感数据,实现对长江经济带湖北段2017—2022年废弃露天矿山生态修复工程进展的动态监测,在提高监督监管力度的同时节省了大量的财力、人力、物力;基于RSEI,评价了研究区废弃露天矿山生态修复效果。所得结果可在一定程度上为国家的生态修复工程监管提供数据支撑,同时为湖北省其他区域乃至全中国的废弃露天矿山生态修复提供借鉴,具有一定的研究意义。
1 研究区概况及数据源
1.1 研究区概况
湖北省位于长江中游,是重要的水源涵养地和生态屏障,矿产资源丰富,优势矿种明显,已探明储量的矿种中,磷矿位居全国前列。研究区为湖北省长江干流及其主要支流(汉江、青江)两岸各10 km范围所在区域,涉及武汉市、黄石市、宜昌市、十堰市、鄂州市、襄阳市、咸宁市、孝感市、荆门市、黄冈市、恩施土家族苗族自治州、荆州市、仙桃市、潜江市和天门市等15个市(州),39个县(市、区),面积约3.56万km2(图1)。研究区为中、低海拔地区,坡度从平坡地至极陡坡地均有涉及,涵盖平原、台地、丘陵、山地地貌;地跨秦岭褶皱系和扬子准地台构造系,发育元古宙—新生代各时代地层,岩浆活动频繁,铁、铜、金、银、磷、石膏、盐及建材类非金属等矿产资源丰富[23]。长期的矿产资源开发严重破坏了湖北省生态环境,造成土壤、大气、固体废弃物等环境污染,崩塌、滑坡、泥石流和采空塌陷等地质灾害频发,人们的生命财产安全受到威胁。近些年,湖北省生态环境问题得到高度重视,长江经济带废弃露天矿山生态修复工作取得了可观的成效。
图1
1.2 数据源及其预处理
本文所用数据以国产高分辨率遥感影像为主,如高分一号(GF-1)、高分二号(GF-2)、高分六号(GF-6)、高分七号(GF-7)、北京二号(BJ-2)、资源一号(ZY-1)、资源三号(ZY-3)等,所用数据均经过辐射定标、大气校正、几何校正、正射校正等预处理和图像融合增强处理。数据类型及时相如表1所示,其中8—10月影像较多。RSEI的计算以2017—2022年同时段Landsat8 OLI数据为主,时相以8月份为主,若某处8月影像多云或质量不佳,则用相近月份影像替代,尽可能减少不同月份对计算结果产生的影响。
表1 各年度国产高分辨率遥感影像统计表
Tab.1
| 时相 | 影像类型 | 空间分 辨率/m | 用途 |
|---|---|---|---|
| 2017年7—11月 | GF-1/GF-2/ZY-3 | 0.8~2.0 | 本底调查 |
| 2018年7—11月 | GF-1/GF-2/GF-6/ZY-3 | 0.8~2.0 | 变化调查 |
| 2019年7—11月 | GF-1/GF-2/GF-6/ZY-3 | 0.8~2.0 | 变化调查 |
| 2020年7—11月 | GF-1/GF-2/ZY-3/BJ-2 | 0.8~2.0 | 变化调查 |
| 2021年7—11月 | GF-1/GF-2/ZY-1/ GF-7/BJ-2 | 0.65~2.0 | 变化调查 |
| 2022年7—11月 | GF-1/GF-2/GF-6/BJ-2 | 0.8~2.0 | 变化调查 |
2 研究方法
2.1 技术方法路线
按照《矿山环境遥感监测技术规范》要求,本文以室内人机交互解译、野外实地查证和野外后补充完善室内解译结果相结合的方式进行信息提取(图2)。首先,在搜集研究区自然地理、地质矿产、遥感影像等基本资料后,根据以往经验,建立采场、中转场地、固体废弃物、矿山建筑等矿山开发占地生态修复解译标志,进行相关信息提取;其次,根据研究需求合理规划野外点和野外路线,在重点关注地区和影像质量较差、解译难度较高的地区适当布置更多的野外点;最后,根据野外查证结果,补充、修改和完善室内解译结果,形成最终的目标成果。在生态修复效果评价方面,为了防止人为因素影响,采用完全依赖影像的RSEI来进行。
图2
2.2 建立遥感解译标志
图3
图3
研究区废弃露天矿山治理前后遥感影像图示例
Fig.3
Examples of remote sensing images before and after treatment of abandoned open-pit mines in the study area
生态修复治理前,露天矿山的采场因矿山开采活动,在影像上以亮色调为主,形状不规则,图面结构粗糙,部分阶梯状开采区域呈相对平行分布的线环结构,新鲜开采面上一般无植被覆盖。中转场地因有矿山分选活动,在影像上色调也相对较亮,形状不规则,图面结构较粗糙,以不规则纹理为主,常见分选设备,一般紧邻采场存在。固体废弃物一般位于采场或中转场地附近,有矿山道路可到达,因固体废弃物堆积总体呈正地形,圆形、椭圆形或不规则状,在影像上色调相对较亮,图面结构较粗糙,纹理不规则(图3(a)、图3(c))。矿山建筑在影像上多呈规则的长方形,蓝色调为主。当矿山被废弃生长植被后图像整体会呈浅绿色调,但图面结构依旧较粗糙(图3(e))。
生态修复治理后,采场经过危岩清理、削坡、覆土平整、种植植被等措施,边界明显,图像整体呈较暗的浅绿色调,图面相对较平滑,采坑陡立面因削坡降级为阶梯状而在影像上呈平行状影纹结构(图3(b))。当采坑内积水,修复治理时常因地制宜将坑底治理为坑塘水面用于渔业或附近用水补给(图3(d))。中转场地在治理时一般会进行设备拆除、平整土地、种植植被等措施,治理后在影像上一般呈浅绿色调,图像结构细腻平滑,形状不规则但边界相对明显。固体废弃物在治理后一般呈浅绿色调,若进行工程治理,图像较平滑,边界相对规则,影纹结构规则;若自然恢复,图像依旧相对粗糙。矿山建筑在治理时一般会根据其建筑状况、地理位置等选择拆除或者保留,拆除后一般会进行土地平整和种植植被,图面呈规则的浅绿色调;当矿山建筑保留时,其治理前后影像上没太大差别(图3(f))。需要注意的是,当图斑仅进行覆土平整,并未进行植被恢复时,认定该图斑暂未达到治理效果;当待治理图斑在治理后植被生长良好,则认为其达到治理效果,计为已治理图斑。
2.3 遥感生态指数(RSEI)
本文使用RSEI对废弃露天矿山生态修复效果进行评价。该指数选用湿度、绿度、干度和热度4个指标,在对其进行主成分分析后,选取第一主成分(PC1)来构建RSEI。RSEI计算公式为:
式中:VI为植被指数,代表绿度;Wet为湿度分量,代表湿度;LST为地表温度,代表热度;NDBSI为建筑和裸土指数,代表干度。
对上述4个指标归一化处理后进行主成分分析。绿度(VI)和湿度(Wet)指标对生态起正向影响,当绿度和湿度指标在PC1的载荷为正值时,取PC1为初始遥感生态指数(RSEI0),计算公式为:
当为负值时[38],计算公式为:
为了便于比较,可同样对
式中RSEI即为最终的遥感生态指数,其数值越高,生态越好,反之生态越差。本文选用2017—2022年Landsat8 OLI来计算RSEI。
3 结果与分析
3.1 废弃露天矿山生态修复遥感变化监测
3.1.1 废弃露天矿山数量分布
图4
图4
研究区废弃露天矿山分布图
Fig.4
Distribution map of abandoned open-pit mine in the study area
表2 研究区废弃露天矿山分布情况统计表
Tab.2
| 市级行政区 | 矿山数量/座 | 图斑数量/处 | 图斑面积/hm2 |
|---|---|---|---|
| 武汉市 | 10 | 17 | 100.76 |
| 黄石市 | 59 | 159 | 838.17 |
| 十堰市 | 2 | 2 | 3.78 |
| 宜昌市 | 34 | 55 | 175.26 |
| 襄阳市 | 10 | 30 | 95.96 |
| 鄂州市 | 9 | 21 | 43.52 |
| 荆门市 | 23 | 44 | 122.82 |
| 孝感市 | 18 | 41 | 154.10 |
| 荆州市 | 9 | 15 | 38.23 |
| 黄冈市 | 21 | 41 | 241.47 |
| 咸宁市 | 5 | 16 | 64.75 |
| 恩施土家族 苗族自治州 | 71 | 78 | 265.88 |
| 仙桃市 | 4 | 5 | 12.08 |
| 潜江市 | 4 | 7 | 33.15 |
| 天门市 | 4 | 6 | 35.26 |
| 总计 | 283 | 537 | 2 225.19 |
3.1.2 废弃露天矿山开发占地类型分布
长江经济带湖北段废弃露天矿山图斑涉及的开发占地类型主要有采场、中转场地、固体废弃物和矿山建筑4类(表3)。其中,采场面积最大,开采损毁面积为1 504.03 hm2,占所有废弃露天矿山总面积的67.59%,主要分布在黄石市、恩施土家族苗族自治州、黄冈市和宜昌市;其次为中转场地,占地面积584.38 hm2,占比26.26%,主要分布于黄石市;固体废弃物居第三位,为113.74 hm2,占比5.11%,主要分布在黄石市;矿山建筑最少,为23.04 hm2,占比仅为1.04%,分布于黄石市、荆门市和咸宁市。
表3 研究区废弃露天矿山开发占地面积统计
Tab.3
| 地级市 | 采场 | 中转 场地 | 固体 废弃物 | 矿山 建筑 | 小计 |
|---|---|---|---|---|---|
| 武汉市 | 71.28 | 22.78 | 6.70 | — | 100.76 |
| 黄石市 | 441.72 | 284.13 | 91.14 | 21.18 | 838.17 |
| 十堰市 | 3.78 | — | — | — | 3.78 |
| 宜昌市 | 130.55 | 44.18 | 0.53 | — | 175.26 |
| 襄阳市 | 88.66 | 7.30 | — | — | 95.96 |
| 鄂州市 | 29.70 | 11.59 | 2.23 | — | 43.52 |
| 荆门市 | 92.09 | 26.67 | 2.98 | 1.08 | 122.82 |
| 孝感市 | 104.61 | 44.38 | 5.11 | — | 154.10 |
| 荆州市 | 21.25 | 16.98 | — | — | 38.23 |
| 黄冈市 | 207.45 | 33.17 | 0.85 | — | 241.47 |
| 咸宁市 | 45.25 | 14.52 | 4.20 | 0.78 | 64.75 |
| 恩施土家族 苗族自治州 | 248.07 | 17.81 | — | — | 265.88 |
| 仙桃市 | 1.37 | 10.71 | — | — | 12.08 |
| 潜江市 | 7.98 | 25.17 | — | — | 33.15 |
| 天门市 | 10.27 | 24.99 | — | — | 35.26 |
| 总计 | 1 504.03 | 584.38 | 113.74 | 23.04 | 2 225.19 |
3.1.3 废弃露天矿山生态修复遥感变化监测
基于2018—2022年国产高空间分辨率遥感影像,对长江经济带湖北段废弃露天矿山的生态修复情况进行年度持续监测,结果见图5。2018年和2019年长江经济带湖北段废弃露天矿山的生态修复治理力度较低,总体修复治理率分别仅为13.08%和17.15%,增长缓慢,治理主要集中在研究区中部和北部地区; 2020年开始加大治理力度,修复治理率达50.62%,治理向东部和西部发展; 2021年和2022年修复治理率持续增长,修复治理率分别增长至68.34%和78.25%(图6),未治理区域仅存在于西部、中部和北部部分地区。治理增长速率体现出先快后慢的特点,2020年时治理增长面积最多,为744.73 hm2,治理率增长最大,为33.47%,此后废弃矿山生态修复治理面积增长相对缓慢(图7)。总之,长江经济带湖北段废弃露天矿山的生态修复治理面积逐年增加,由2018年的291.01 hm2增长至2022年的1 741.19 hm2,治理率持续上升,生态修复治理情况总体呈向好方向发展。
图5
图5
研究区2018—2022年废弃露天矿山生态修复治理情况遥感监测图
Fig.5
Remote sensing monitoring map of ecological restoration and treatment of abandoned open-pit mines in the study area, 2018—2022
图6
图6
研究区2018—2022年废弃露天矿山生态修复治理面积和治理率统计
Fig.6
Area and rate of ecological restoration and treatment of abandoned open-pit mines in the study area, 2018—2022
图7
图7
研究区2018—2022年废弃露天矿山生态修复治理增长面积和治理率增长情况统计
Fig.7
Statistics on growth area and growth rate of ecological restoration and treatment of abandoned open-pit mines in the study area, 2018—2022
按修复治理前矿山开发占地类型统计,修复治理涉及采场、中转场地、固体废弃物、矿山建筑4类,修复治理面积和治理率均逐年上升(图8、图9)。其中,采场的修复治理面积最多,从2018年的209.07 hm2递增至2022年的1 294.56 hm2,治理率最高,由13.90%增长至86.07%。其次为中转场地,治理面积由81.94 hm2递增至394.51 hm2,治理率由14.02%增长至67.51%。固体废弃物的修复治理从2020年开始,治理面积由41.28 hm2增长至51.16 hm2,治理率由36.29%增长至44.98%。矿山建筑的治理从2021年才开始涉及,治理面积由0.19 hm2增长至0.96 hm2,治理率由0.82%增长至4.17%。总之,采场和中转场地的修复治理率较高,固体废弃物和矿山建筑的修复治理力度有待提高。
图8
图8
研究区2018—2022年废弃露天矿山开发占地类型生态修复治理面积统计图
Fig.8
Area statistical of land occupation types of ecological restoration and treatment of abandoned open-pit mine in the study area, 2018—2022
图9
图9
研究区2018—2022年废弃露天矿山开发占地类型生态修复治理率统计图
Fig.9
Statistical map of ecological restoration treatment rate of land occupation types of abandoned open-pit mine in the study area, 2018—2022
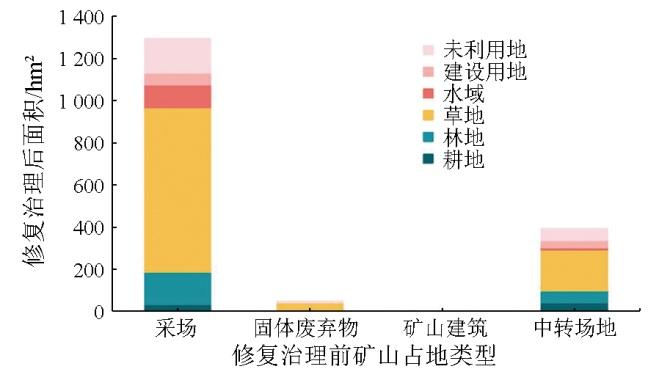
按修复治理后地类统计(图10),截至2022年底,修复治理为草地的面积最多,达1 008.68 hm2,占所有治理面积总和的57.93%;其次为未利用地,为229.96 hm2,面积占比13.21%;治理为林地的面积位居第三,为217.34 hm2,占治理总面积的12.48%;治理为水域、建设用地和耕地的面积相对较少,分别为121.03 hm2,88.62 hm2和75.55 hm2,治理率分别为6.95%,5.09%和4.34%。经过持续监测发现,除治理为草地的面积是持续增长外,其他地类的面积均先增长后下降,这是因为部分前期治理为耕地和林地的地区因植被生长效果不佳,后期将其重新治理为草地;部分水域在后期进行回填平整、播撒草籽等治理草地;部分建设用地在前期遥感影像上显示为建设用地占用,后期进行拆除治理为草地;正在治理图斑前期覆土平整措施阶段在影像上体现为未利用地,而后期影像上植被已生长,故出现未利用地先增长后减少现象。
图10
图10
研究区2018—2022年废弃露天矿山生态修复治理后地类面积统计图
Fig.10
Area statistical map of land types after ecological restoration and treatment of abandoned open-pit mines in the study area, 2018—2022
图11
图11
研究区各地级市(州)2018—2022年废弃露天矿山生态修复治理面积统计
Fig.11
Area statistics of ecological restoration and treatment of abandoned open-pit mines in each prefecture-level city (state) in the study area, 2018—2022
图12
图12
研究区各地级市(州)2018—2022年废弃露天矿山生态修复治理率统计
Fig.12
Ecological restoration and treatment rate of abandoned open-pit mines in each prefecture-level city (state) in the study area, 2018—2022
按废弃露天矿山生态修复治理前后地类变化情况来看(图13),2018—2022年,采场修复治理为草地的面积最大,达778.15 hm2,占生态修复治理总面积的44.69%。第二为中转场地治理为草地,面积194.83 hm2,占比为11.19%。第三位为采场治理为未利用地,面积163.88 hm2,占比9.41%。第四为采场治理为林地,面积154.32 hm2,占比8.86%。其余地类变化面积均较少。
图13
图13
研究区2022年废弃露天矿山生态修复治理前后地类面积统计
Fig.13
Area of land types before and after ecological restoration and teatment of abandoned open-pit mines in the study area in 2022
3.2 废弃露天矿山生态修复效果评价
图14
图14
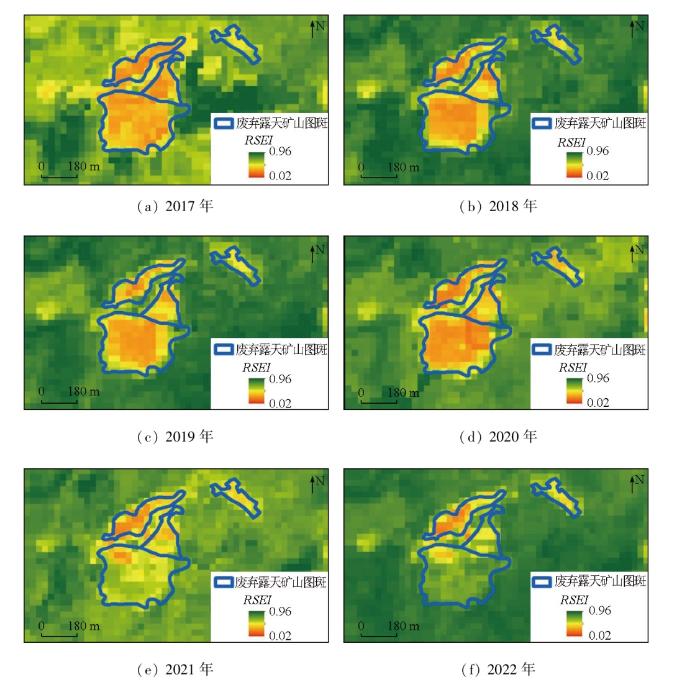
研究区2017—2022年RSEI分布图
Fig.14
Distribution map of RSEI in the study area, 2017—2022
图15
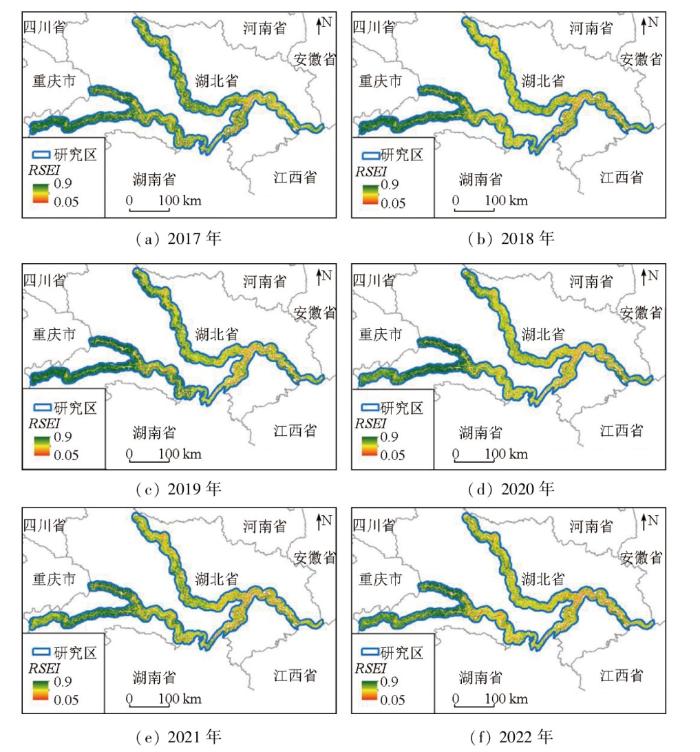
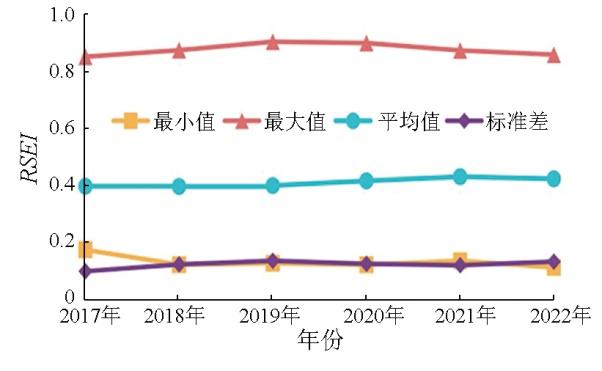
从2017—2022 年研究区废弃矿山图斑范围内RSEI统计结果(图16)可见,图斑范围的生态状况总体向好发展,RSEI的平均值由0.397 7增长为0.423 9,增长率6.59%,生态修复效果有所提升。其中,2017—2020年增长较缓慢,从2021年开始增长变化明显,原因是研究区内废弃露天矿山图斑在2017—2019年生态修复力度较低,2020年开始加大了生态修复治理力度,但因为生态修复时进行削坡、土地平整等措施造成岩土裸露,植被减少,故在RSEI图像上会以低值出现。完成修复后,植被覆盖度上升,RSEI则升高。图17为某废弃露天矿山图斑2017—2022年RSEI分布图,从图中可见,废弃露天矿山图斑RSEI总体向高值发展,生态状况向好,但2020年图斑RSEI略有下降,生态状况略微变差,从2021年开始RSEI则明显增大,生态情况向好发展。这是因为该废弃露天矿山在2017—2019年处于废弃状态,自然恢复使地表生长了部分植被,提高了RSEI; 2020年开始对该矿山进行生态修复,削坡、平整、覆土等措施使地表裸露,引起RSEI下降;修复完成后,从2021年开始植被逐渐茂密,生态状况变好,RSEI升高。
图16
图16
废弃矿山图斑范围2017—2022年RSEI统计
Fig.16
RSEIfor the abandoned mine patches, 2017—2022
图17
图17
某废弃矿山图斑范围2017—2022年RSEI分布图
Fig.17
Distribution map of RSEI for the abandoned mine patches, 2017—2022
图18
图18
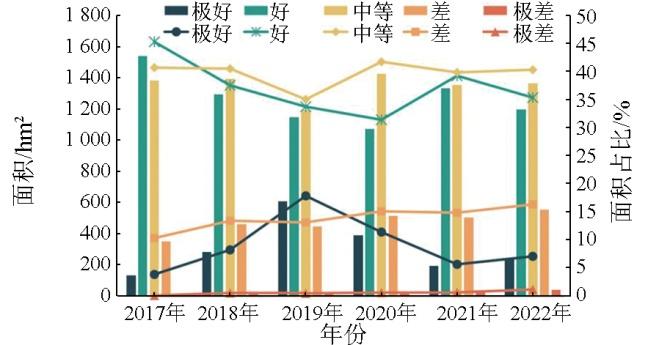
研究区2017—2022年各等级RSEI面积统计
Fig.18
RSEIarea statistics of each grade in the study area, 2017-2022
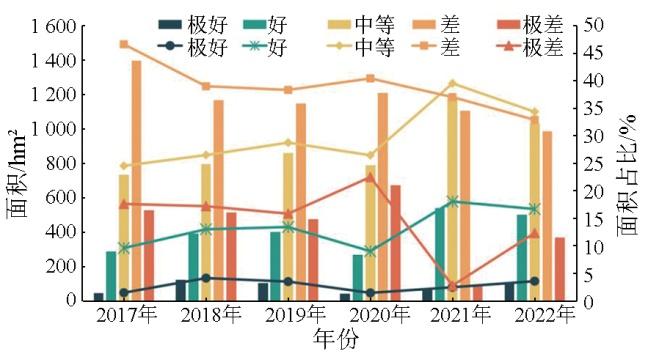
图19为废弃露天矿山图斑范围2017—2022各等级RSEI面积统计,从图19可见,废弃露天矿山的生态等级以中等和差为主,极差等级的面积也较多,极好等级的面积较少。2017—2022年,在经过生态修复后,极好、好和中等等级的面积和百分比总体有所提升,差和极差等级的面积总体降低。其中,2017—2019年生态修复力度相对较低,各数值变化相对较小; 2020—2022年生态修复力度提高,各数值变化相对明显,尤其好和中等等级的面积增加较多,极差等级的面积减少明显。可见,研究区废弃露天矿山生态修复提高了矿区生态质量。值得注意的是,因对废弃露天矿山进行生态修复时需进行覆土、平整等措施,此阶段在RSEI中体现为低值,故RSEI面积统计曲线出现上下波动的情况。
图19
图19
废弃露天矿山图斑范围2017—2022年各等级RSEI面积统计
Fig.19
RSEIarea statistics of each grade of abandoned open-pit mine quarries, 2017—2022
4 讨论与结论
本文基于2017—2022年国产高分辨率遥感数据,对长江经济带湖北段废弃露天矿山进行了连续监测,掌握了研究区废弃露天矿山的分布情况,查明了废弃露天矿山生态修复的动态变化情况,基于2017—2022年Landsat8 OLI数据,采用RSEI指数对研究区废弃露天矿山生态修复效果进行了评价,得到以下结论:
1)基于2017年国产高分辨率遥感数据,获取了长江经济带湖北段废弃露天矿山地分布情况。截至2017年底,长江经济带湖北段干流及主要支流(汉江、清江)两岸各10 km范围内共有废弃露天矿山图斑共537处,涉及矿山283座,面积共2 225.19 hm2。
2)基于2018—2022年国产高分辨率遥感数据,对长江经济带湖北段废弃露天矿山生态修复治理情况进行连续监测,结果发现长江经济带湖北段废弃露天矿山的生态修复治理面积逐年增加,由2018年的291.01 hm2增长至2022年的1 741.19 hm2,治理率持续上升,治理增长率先增后减,生态修复治理情况总体呈向好方向发展。监测结果弥补了长江经济带湖北段废弃露天矿山生态修复遥感监测的空白,可为湖北省其他区域乃至全中国的废弃露天矿山生态修复提供数据支撑。
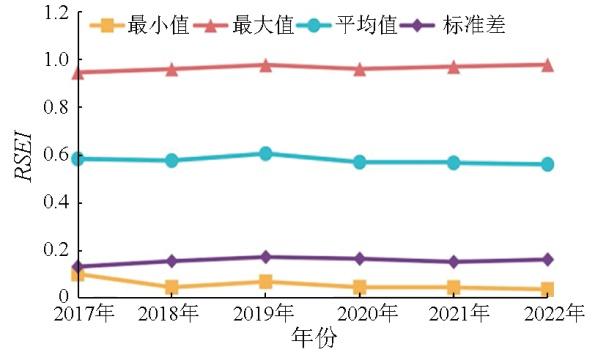
3)基于2017—2022年RSEI指数对研究区和图斑范围的生态修复效果进行评价,发现研究区2017—2022生态情况整体变化不大,均值略有降低,从0.585 6减少为0.562 6,减少率3.93%。废弃露天矿山图斑范围的生态状况总体向好发展,RSEI均值由0.397 7增长为0.423 9,增长率为6.59%,生态修复效果有所提升。采用RSEI指数对废弃露天矿山生态修复效果进行评价,所得结果与植被覆盖、人类活动、矿山开采和修复行为相适应,可在完全基于遥感影像的基础上快速、高效地获得研究区的生态修复效果。实际应用时,出现RSEI先下降再上升的情况,这是因为在进行遥感解译时,覆土、平整、削坡等行为会去除地表自然生长零星植被,在RSEI结果上因地表裸露而表现为低数值,当后期种植植被后,RSEI升高,表现出向好的生态。
4)湖北省铁铜等金属矿产、磷矿资源丰富,其在开采和生产过程中产生的废渣、废水等会污染环境,废弃露天矿山的生态修复除了表面植被恢复外,还要注重土壤、水体等污染的治理;实施生态修复后,要加大对生态修复区的监督监管,持续监测生态修复效果,及时对坏死植被进行补种,保证生态修复质量。
本文仍有诸多不足,一是本文以国产高分辨率遥感数据和Landsat8 OLI数据为主,前者空间分辨率高但光谱波段太少,后者光谱波段较多但空间分辨率低,空间分辨率的差异会在一定程度上对计算和统计结果产生影响,基于以上局限,后续考虑引入无人机高光谱数据进行废弃露天矿山生态修复遥感变化监测和生态修复效果评价;二是文中对废弃露天矿山生态修复效果的评价采用全依靠影像获取的RSEI指数,该指数仅由4个指标组成,参考因素相对较单一,后续将引入气象、地质、矿产、水文、土壤等影响因素,对修复效果进行综合评价研究。
参考文献
我国废弃矿山生态修复研究
[J].
Study on ecological restoration of abandoned mines in China
[J].
近30年中国矿业废弃地生态修复及再利用研究热点及趋势分析
[J].
Analysis of research hotspots and trends in ecological restoration and reuse of China’s mining wastelands in the past 30 years
[J].
Characterization of black sand mining activities and their environmental impacts in the Philippines using remote sensing
[J].
Quantitative assessment of landscape transformation due to coal mining activity using earth observation satellite data in Jharsuguda coal mining region,Odisha,India
[J].
Vegetation health conditions assessment and mapping using AVIRIS-NG hyperspectral and field spectroscopy data for-environmental impact assessment in coal mining sites
[J].
The synergistic effect of topographic factors and vegetation indices on the underground coal mine utilizing unmanned aerial vehicle remote sensing
[J].
Automatically identifying the vegetation destruction and restoration of various open-pit mines utilizing remotely sensed images:Auto-VDR
[J].
Remote sensing monitoring of land damage and restoration in rare earth mining areas in 6 counties in southern Jiangxi based on multisource sequential images
[J].
Changes detected in the extent of surface mining and reclamation using multitemporal Landsat imagery:A case study of Jiu Valley,Romania
[J].
DOI:10.1007/s10661-020-08834-w
PMID:33398530

Surface mining represents the dominant driver of land coverage changes in the Jiu Valley mining area in Romania. Detecting and quantifying active mines and reclaimed areas are very important tasks given the effects of surface mining on the environment. In this paper, Landsat imagery for the years 1988, 1998, 2008, and 2017 was used to map the extent of surface mining and reclamation in the Jiu Valley mining area. The satellite images were classified using the Support Vector Machine (SVM) algorithm to map land cover classes, including mined areas, and post-classification comparison (PCC) technique to track changes through time. In order to identify and quantify active mines and reclaimed areas of mined areas, we used indices such as Normalized Difference Vegetation Index (NDVI), Soil-Adjusted Vegetation Index (SAVI), and Modified Soil-Adjusted Vegetation Index-2 (MSAVI-2). For the entire area studied, during the period 1988-2017, the extent of surface mining was 6.5%, with peaks in the periods 1988-1998 and 1998-2008, namely, 205.2% and 4.0%, respectively, as a result of the extension of surface exploitation as distinct from that underground. Land cover conversion to mined areas was almost exclusively from agricultural, forest, and pasture. The results show that NDVI estimated the largest surfaces with active mines, reclaimed grassland, and reclaimed woodland, within the mined areas. SAVI and MSAVI-2 estimated larger surfaces classified as reclaimed forest. As a result of the expansion of surface mining areas, the landscape was considerably degraded through mining scars, landscape fragmentation, degradation, and pollution. However, during the past few years, reclamation activity has intensified in the affected areas through the occurrence of spontaneous vegetation, but also through forestation.
Coupling and coordination of coal mining intensity and social-ecological resilience in China
[J].
Assessment of the ecological impacts of coal mining and restoration in alpine areas:A case study of the Muli Coalfield on the Qinghai-Tibet Plateau
[J].
Assessment of the sustainability of landcovers due to artisanal mining in Jos Area,Nigeria
[J].
Determination of the impacts of mining activities on land cover and soil organic carbon:Altintepe gold mine case,Turkey
[J].
Optical remote sen-sing of large-scale water pollution in Angola and DR Congo caused by the Catoca Mine tailings spill
[J].
长江经济带矿山土壤重金属污染及健康风险评价
[J].
Heavy metal pollution and health risk assessment of mine soil in Yangtze River economic belt
[J].
Application of remote sen-sing,GIS and machine learning with geographically weighted regression in assessing the impact of hard coal mining on the natural environment
[J].
Ecological environment changes of mining areas around Nansi Lake with remote sensing monitoring
[J].
Evaluation analysis of forest ecological security in 11 provinces (cities) of the Yangtze River economic belt
[J].
生态保护红线区废弃矿山生态修复监管
[J].
Supervisory countermeasures of ecolo-gical restoration of abandoned mine areas in the ecological conservation redline area
[J].
长江经济带矿山生态治理的实施成效、问题与对策
[J].
Achievements,problems and suggestions of mine ecological governance in the Yangtze River Economic Belt
[J].
长江经济带废弃矿山占损土地遥感调查与生态修复对策
[J].
Remote sensing survey of land occupied and damaged by abandoned mines along the Yangtze River Economic Belt and researchron ecological remediation countermeasures
[J].
长江经济带废弃露天矿山生态修复典型模式遥感监测:以湖北省为例
[J].
Remote sensing monitoring of typical ecological restoration models of abandoned open-pit mines in the Yangtze River Economic Belt:A case study of Hubei Province
[J].
Open-pit mine change detection from high resolution remote sensing images using DA-UNet++ and object-based approach
[J].
基于高分遥感的洞庭湖区河湖采砂监管及典型案例分析
[J].
River and lake sand mining in the Dongting Lake area:Supervision based on high-resolution remote sensing images and typical case analysis
[J].
油气矿山越界开采遥感监测方法探索
[J].
A remote sensing method for judging the cross-border mining of oil and gas mines
[J].
基于遥感动态监测的吉林省矿山地质环境及生态修复变化特征分析
[J].
Analysis on characteristics of mine geological environment and ecologicarestoration changes in Jilin Province based on dynamic remote sensing monitoring
[J].
Monitoring and evaluating restoration vegetation status in mine region using remote sensing data:Case study in Inner Mongolia,China
[J].
Quantifying the coal mining impact on the ecological environment of Gobi open-pit mines
[J].
Construction of an environmental quality index for public health research
[J].
Application of GIS based ecological vulnerability evaluation in environmental impact assessment of master plan of coal mining area
[J].
城市遥感生态指数的创建及其应用
[J].
A remote sensing urban ecological index and its application
[J].
Effects of mining on urban environmental change:A case study of Panzhihua
[J].
Impact of land cover change on a typical mining region and its ecological environment quality evaluation using remote sensing based ecological index (RSEI)
[J].
Detecting spatial-temporal changes of urban environment quality by remote sensing-based ecological indices:A case study in Panzhihua City,Sichuan Province,China
[J].
Dynamic monitoring of ecological environment quality in Lijiang River Basin based on RSEI
[J].
MRSEI指数的合理性分析及其与RSEI指数的区别
[J].
DOI:10.11873/j.issn.1004-0323.2022.1.0001
[本文引用: 1]

遥感生态指数(RSEI)自提出以来,已得到广泛的应用。近年来,也有学者对其进行了修改。研究基于主成分变换的机理和应用实例,分析了修改的遥感生态指数(MRSEI)的合理性及其与RSEI的区别。结果表明:MRSEI指数将不具生态含义的第二主成分和第三主成分加入具有明确生态含义的第一主成分进行加权求和计算,其结果不仅降低了第一主成分的占比,无法增加原RSEI的信息量,而且还导致各主成分分量互相干扰,造成MRSEI结果的低估或高估。因此,这一修改缺乏合理性。研究同时还对用户在计算RSEI指数中碰到的一些问题进行分析。RSEI在使用中应注意采用植物生长季节的地表反射率数据;当研究区有大面积水体时,必须对水体进行掩膜;而只有当对生态起正面影响的绿度(NDVI)和湿度(Wet)指标在PC1的载荷为负值时,才必须进行“1 – PC1”的还原运算。
Rationality analysis of MRSEI and its difference with RSEI
[J].


