Please wait a minute...
 
国土资源遥感  2020, Vol. 32 Issue (2): 226-232    DOI: 10.6046/gtzyyg.2020.02.29
  技术应用 本期目录 | 过刊浏览 | 高级检索 |
基于卫星遥感技术的区域经济发展模型构建
古海玲1, 陈超1(), 芦莹1, 褚衍丽2
1.浙江海洋大学海洋科学与技术学院,舟山 316022
2.浙江海洋大学经济与管理学院,舟山 316022
Construction of regional economic development model based on satellite remote sensing technology
Hailing GU1, Chao CHEN1(), Ying LU1, Yanli CHU2
1. College of Marine Science and Technology, Zhejiang Ocean University, Zhoushan 316022, China
2. School of Economics and Management, Zhejiang Ocean University, Zhoushan 316022, China
全文: PDF(1902 KB)   HTML  
输出: BibTeX | EndNote (RIS)      
摘要 

针对区域经济发展调查中传统方法费时费力、数据缺乏客观性的问题,从区域经济发展引起地球表面形态变化的角度出发,借助卫星遥感技术优势,构建模型,以便更加客观、真实地了解区域经济发展形势。首先,基于卫星遥感数据,获取不同时相地球表面形态变化和土地利用信息; 其次,分析各土地利用类型与各区域经济指标之间的相关性,优选敏感因子; 然后,结合社会调查数据,构建区域经济发展模型; 最后,进行精度评价,以验证模型的有效性和适用性。以舟山群岛为例的研究结果表明,建设用地面积是与各经济指标相关性最强的敏感因子,与国内生产总值(gross domestic product,GDP)、第一产业总值(primary industry product,PIP)、第二产业总值(secondary industry product,SIP)和第三产业总值(tertiary industry product,TIP)的相关系数分别为0.959 1,0.939 0,0.954 6和0.957 3; 遥感数据与社会调查数据相结合的区域经济发展模型简单清晰,精度较高,平均决定系数R2为0.979 5。本研究为区域经济发展预测和经济数据纠偏提供了一种新思路,为观测区域经济活动及其影响提供了一种新途径,对于了解区域经济发展,调整和修正统计数据具有实用意义。

服务
把本文推荐给朋友
加入引用管理器
E-mail Alert
RSS
作者相关文章
古海玲
陈超
芦莹
褚衍丽
关键词 土地利用与覆被变化卫星遥感技术区域经济发展模型构建舟山群岛    
Abstract

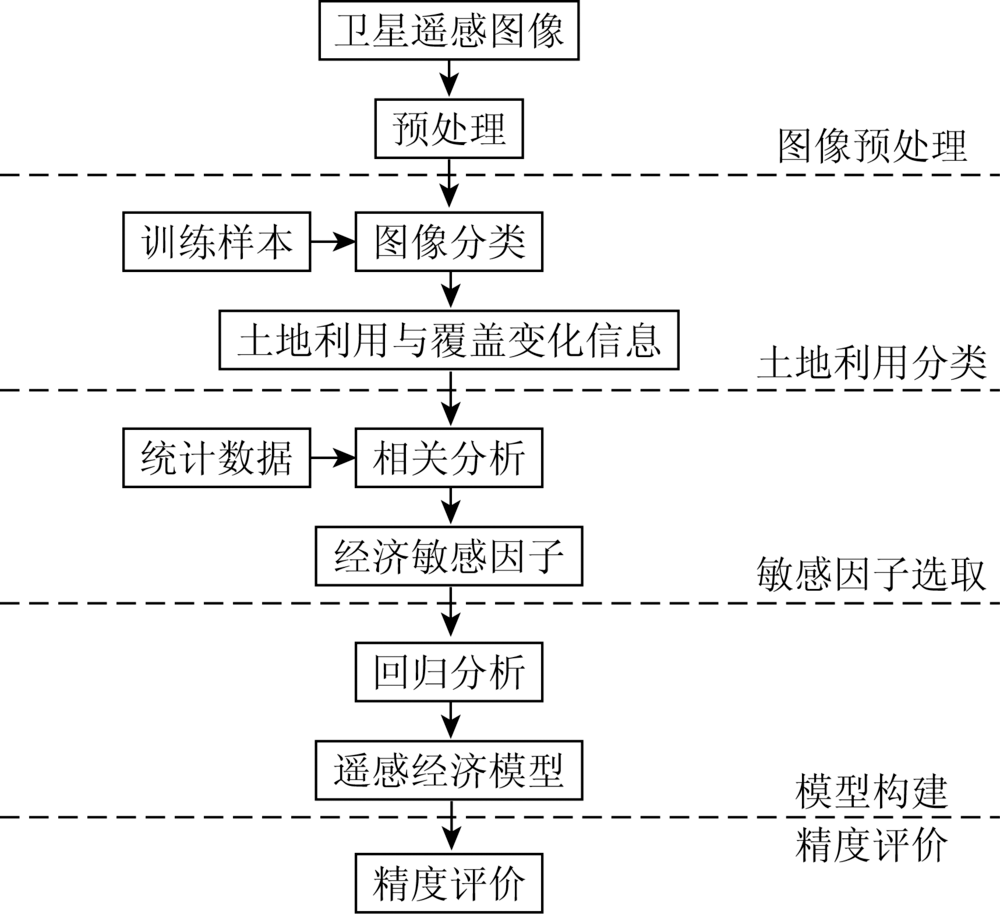
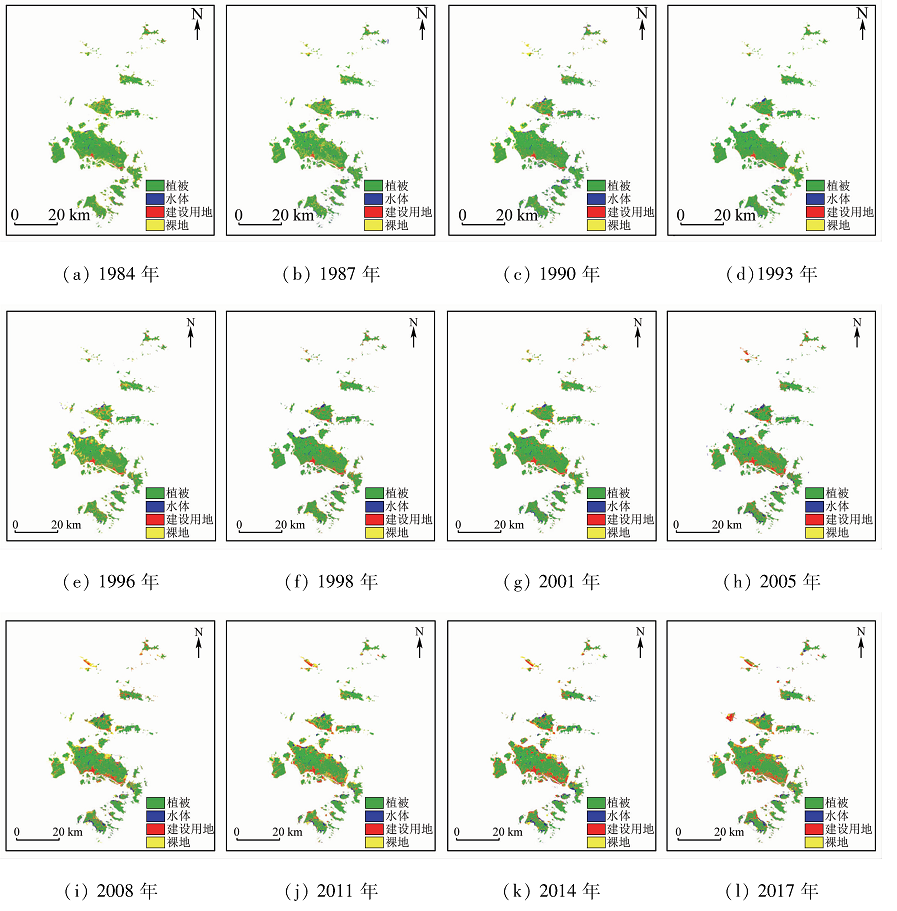
In order to break through the time-consuming and laborious limitations of traditional regional economic development surveys, the authors built some regional economic development models by virtue of the advantages of remote sensing technology. First, based on multi-source and multi-temporal satellite remote sensing data, the authors obtained surface morphological changes and land use information, analyzed the correlation between land use types and regional economic indicators, optimized sensitive factors, then combined the social survey data to build a regional economic development model and finally performed an accuracy evaluation to verify the validity and applicability of the model. Zhoushan Islands were selected as the research area to carry out verification experiments. The experimental results show that the construction land area is the most sensitive factor related to various economic indicators, and the correlation coefficients with GDP, PIP, SIP and TIP are respectively 0.959 1, 0.939 0, 0.954 6 and 0.957 3. The average determination coefficient R2 of the regional economic development model built with the survey data is 0.979 5. The results obtained by the authors provide a new way of thinking for regional economic development prediction and economic data correction and also provide a possibility for humans to observe economic activities and their impact. The model built in this study is simple and clear yet with high precision, and thus is of great significance for understanding regional economic development as well as adjusting and correcting statistical data.

Key wordsland use and cover change    satellite remote sensing technology    regional economic development    model construction    Zhoushan Islands
收稿日期: 2019-06-06      出版日期: 2020-06-18
:  TP79  
基金资助:浙江省省属高校科研院所基本科研业务费专项(2019J00003);国家自然科学基金项目“基于空间数据挖掘的高分辨率遥感图像水上桥梁目标识别与损毁评估”(41701447)
通讯作者: 陈超
作者简介: 古海玲(1997-),女,本科生,主要从事遥感技术应用研究。Email: guhailing_zj@163.com。
引用本文:   
古海玲, 陈超, 芦莹, 褚衍丽. 基于卫星遥感技术的区域经济发展模型构建[J]. 国土资源遥感, 2020, 32(2): 226-232.
Hailing GU, Chao CHEN, Ying LU, Yanli CHU. Construction of regional economic development model based on satellite remote sensing technology. Remote Sensing for Land & Resources, 2020, 32(2): 226-232.
链接本文:  
https://www.gtzyyg.com/CN/10.6046/gtzyyg.2020.02.29      或      https://www.gtzyyg.com/CN/Y2020/V32/I2/226
卫星遥感数据 经济与人口统计数据
时间 传感器 时间 经济指标 人口
1984年、1987—1988年、1990—1993年、1996—2001年、2003—2011年 Landsat5 TM 1990年、2000年、2005—2011年、2013—2017年 GDP,PIP,SIP,
TIP和人均 GDP值
常住人口
2013—2017年 Landsat8 OLI 1984年、1987—1988年、1991—1993年、1996—1999年、2001年、2003—2004年 插值之后的
常住人口
Tab.1  研究区数据获取情况
Fig.1  本文技术路线
土地利用类型 1984年 1987年 1988年 1990年 1991年 1992年 1993年 1996年 1997年 1998年 1999年 2000年 2001年 2003年
建设用地 50.84 39.17 62.55 56.23 56.03 53.86 47.76 86.13 78.55 107.19 73.07 107.83 111.08 126.06
植被 972.51 950.54 994.48 990.62 967.19 974.73 1 043.44 956.23 955.41 1 020.90 1 039.48 998.41 1 025.00 988.57
水体 28.44 60.18 50.45 71.42 49.45 81.43 45.96 42.40 34.89 57.74 40.67 48.43 51.56 47.31
裸地 255.55 247.57 188.59 157.36 221.10 170.19 131.12 211.54 188.53 114.52 83.03 126.23 130.59 118.22
陆域总面积 1 307.34 1 297.45 1 296.07 1 275.63 1 293.76 1 280.21 1 268.28 1 296.31 1 257.38 1 300.36 1 236.24 1 280.90 1 318.24 1 280.16
土地利用类型 2004年 2005年 2006年 2007年 2008年 2009年 2010年 2011年 2013年 2014年 2015年 2016年 2017年
建设用地 127.52 143.04 141.21 154.85 142.43 147.58 154.40 150.21 201.14 213.16 205.53 180.30 220.05
植被 996.38 976.87 976.07 998.16 900.54 1007.73 908.48 912.12 939.04 903.26 925.66 949.38 967.42
水体 62.22 63.49 69.56 46.60 60.80 54.79 60.36 60.03 55.01 74.17 73.07 89.88 68.96
裸地 80.23 79.97 135.45 149.37 199.72 154.99 192.88 226.04 167.12 117.34 140.49 175.90 115.67
陆域总面积 1 266.35 1 263.37 1 322.28 1 348.97 1 303.49 1 365.08 1 316.11 1 348.41 1 362.31 1 307.93 1 344.76 1 395.46 1 372.09
Tab.2  各土地利用类型面积
Fig.2  分类结果
指标 lg() lg() lg() lg() lg() e(') e(') e(') e(') e(')
GDP -0.545 5 0.645 8 0.919 4 -0.172 8 0.782 2 -0.546 3 0.607 2 0.842 2 -0.113 2 0.777 4 -0.529 9 0.662 4 0.943 9 -0.222 1 0.808 0
PIP -0.443 3 0.621 4 0.917 2 -0.263 1 0.762 5 -0.443 5 0.581 9 0.850 0 -0.202 5 0.756 0 -0.432 6 0.643 4 0.939 8 -0.310 6 0.801 7
SIP -0.614 0 0.647 8 0.926 8 -0.144 5 0.757 6 -0.616 1 0.617 0 0.860 8 -0.084 3 0.754 0 -0.589 3 0.655 4 0.940 9 -0.197 3 0.773 6
TIP -0.526 1 0.647 4 0.897 8 -0.155 1 0.7943 -0.526 1 0.603 1 0.809 0 -0.098 0 0.789 2 -0.515 6 0.668 5 0.931 0 -0.201 6 0.822 9
人均 GDP -0.547 0 0.646 1 0.919 5 -0.171 7 0.782 3 -0.547 8 0.607 6 0.842 4 -0.112 1 0.777 5 -0.531 4 0.662 4 0.943 9 -0.221 0 0.807 9
常住人口 -0.463 9 0.616 0 0.962 8 -0.4057 0.622 8 -0.468 0 0.615 4 0.956 2 -0.329 6 0.618 3 -0.430 3 0.605 0 0.942 9 -0.469 6 0.647 5
e(GDP') -0.453 5 0.7055 0.881 5 -0.267 4 0.725 1 -0.4545 0.691 4 0.807 4 -0.196 2 0.719 0 -0.437 8 0.704 7 0.907 0 -0.326 3 0.762 2
e(PIP') -0.404 4 0.616 2 0.870 1 -0.224 9 0.781 9 -0.403 2 0.568 2 0.787 0 -0.168 4 0.774 9 -0.403 0 0.645 4 0.905 1 -0.267 5 0.824 9
e(SIP') -0.574 6 0.643 2 0.901 9 -0.129 9 0.779 7 -0.575 8 0.605 4 0.822 2 -0.071 2 0.775 4 -0.555 9 0.657 6 0.927 5 -0.179 8 0.801 5
e(TIP') -0.463 0 0.630 5 0.856 7 -0.151 7 0.799 3 -0.461 8 0.580 6 0.758 7 -0.097 5 0.793 4 -0.460 9 0.657 7 0.899 2 -0.193 6 0.834 1
e(人均GDP') -0.492 7 0.635 0 0.880 8 -0.159 1 0.7952 -0.492 3 0.589 6 0.791 1 -0.102 4 0.789 7 -0.485 3 0.658 1 0.916 4 -0.204 1 0.826 9
e(常住人口') -0.502 7 0.630 9 0.967 1 -0.3289 0.691 9 -0.505 7 0.617 0 0.934 9 -0.257 1 0.687 3 -0.474 6 0.629 4 0.962 7 -0.388 6 0.716 2
lg(GDP) -0.459 3 0.5901 0.947 9 -0.431 7 0.563 1 -0.4640 0.599 9 0.959 1 -0.361 5 0.558 8 -0.422 0 0.571 2 0.914 8 -0.491 8 0.585 9
lg(PIP) -0.372 5 0.565 5 0.925 4 -0.486 1 0.543 5 -0.376 9 0.575 0 0.939 0 -0.413 2 0.537 6 -0.337 5 0.551 8 0.896 9 -0.547 2 0.579 5
lg(SIP) -0.492 3 0.594 1 0.942 4 -0.405 9 0.554 6 -0.497 0 0.606 3 0.954 6 -0.337 7 0.551 1 -0.454 2 0.571 5 0.906 4 -0.465 5 0.572 0
lg(TIP) -0.5024 0.620 1 0.959 9 -0.387 5 0.602 7 -0.506 3 0.622 9 0.957 3 -0.321 0 0.598 7 -0.468 8 0.604 1 0.933 8 -0.445 3 0.623 3
lg(人均GDP) -0.464 2 0.591 0 0.949 4 -0.426 8 0.566 8 -0.468 7 0.600 1 0.959 7 -0.357 2 0.562 6 -0.427 2 0.572 4 0.916 7 -0.486 5 0.589 2
lg(常住人口) -0.450 7 0.610 9 0.958 3 -0.425 4 0.603 2 -0.455 0 0.613 7 0.958 1 -0.348 2 0.598 7 -0.415 9 0.597 5 0.934 8 -0.490 3 0.628 2
Tab.3  土地利用类型面积与各经济指标间的相关系数表
单因子 双因子
x y 线性模型 R2 平均R2 x y 线性模型 R2 平均R2
lg(建设用
地面积)
lg(GDP) y=2.595 0 x-3.034 1 0.919 8 0.907 3 lg(常住人口) x1
lg(建设用地面积) x2
lg(GDP) y=18.236 29 x1+0.247 334 x2-35.130 7 0.988 4 0.979 5
lg(PIP) y=1.735 2 x-2.006 4 0.881 7 lg(PIP) y=13.946 08 x1-0.060 12 x2-26.552 1 0.967 7
lg(SIP) y=2.683 6 x-3.673 8 0.911 2 lg(SIP) y=18.150 05 x1+0.347 049 x2-35.618 7 0.974 1
lg(TIP) y=2.867 3 x-3.979 4 0.916 5 lg(TIP) y=20.561 14 x1+0.220 352 x2-40.168 0.987 7
Tab.4  模型构建结果
经济
指标
单因子 双因子
D/% RMSE RyY D/% RMSE RyY
GDP 8.44 107.66 0.946 5 -8.50 78.11 0.967 0
PIP 6.79 9.44 0.952 5 -3.06 9.87 0.989 0
SIP 6.50 123.75 0.901 3 -11.59 46.67 0.908 3
TIP 16.56 64.93 0.945 3 -6.00 29.33 0.973 5
平均值 9.57 76.44 0.936 4 -7.29 40.99 0.959 4
Tab.5  模型精度评价结果
[1] Grekousis G, Mountrakis G, Kavouras M. Linking MODIS-derived forest and cropland land cover 2011 estimations to socioeconomic and environmental indicators for the European Union’s 28 countries[J]. GIS Science & Remote Sensing, 2016,53(1):122-146.
[2] Vilar L, Camia A, San M A J,et al.Modeling temporal changes in human-caused wildfires in Mediterranean Europe based on Land Use-Land Cover interfaces[J]. Forest Ecology and Management, 2016,378:68-78.
[3] 潘思东. 基于夜间灯光遥感和小区POI的住宅发展与经济增长的空间耦合研究[J]. 地球信息科学学报, 2017,19(5):646-652.
Pan S D. Spatial coupling between housing development and economic growth based on night light remote sensing and residential POI[J]. Journal of Geo-information Science, 2017,19(5):646-652.
[4] 赵展, 夏旺, 闫利. 基于多源数据的土地利用变化检测[J]. 国土资源遥感, 2018,30(4):148-155.doi: 10.6046/gtzyyg.2018.04.22.
Zhao Z, Xia W, Yan L. Land use change detection based on multi-source data[J]. Remote Sensing for Land and Resources, 2018,30(4):148-155.doi: 10.6046/gtzyyg.2018.04.22.
[5] Handavu F, Chirwa P W C, Syampungani S,Socio-economic factors influencing land-use and land-cover changes in the miombo woodlands of the Copperbelt Province in Zambia[J]. Forest Policy and Economics, 2019,100:75-94.
[6] Chen Q, Hou X, Zhang X, et al. Improved GDP spatialization approach by combining land-use data and night-time light data:A case study in China’s continental coastal area[J]. International Journal of Remote Sensing, 2016,37(19):4610-4622.
[7] 韩向娣, 周艺, 王世新, 等. 基于夜间灯光和土地利用数据的GDP空间化[J]. 遥感技术与应用, 2012,27(3):396-405.
Hang X D, Zhou Y, Wang S X, et al. GDP spatialization in China based on DMSP/OLS data and land use data[J]. Remote Sensing Technology and Application, 2012,27(3):396-405.
[8] 李翔, 朱江, 尹向东. 基于夜间灯光数据的中国经济发展时空格局特征[J]. 地球信息科学学报, 2019,21(3):417-426.
Li X, Zhu J, Yin X D. Spatio-temporal pattern of Chinese economy development based on nightlight data[J]. Journal of Geo-information Science, 2019,21(3):417-426.
[9] Li G, Li F, Urban sprawl in China:Differences and socioeconomic drivers[J]. Science of the Total Environment, 2019,673:367-377.
[10] Shapla T, Park J, Hongo C, et al. Agricultural land cover change in Gazipur,Bangladesh, in relation to local economy studied using Landsat images[J]. Advances in Remote Sensing, 2015,4(3):214.
[11] Yu W, Zang S, Wu C, et al. Analyzing and modeling land use land cover change(LUCC) in the Daqing City, China[J]. Applied Geography, 2011,31(2):600-608
[12] 李少英, 刘小平, 黎夏, 等. 土地利用变化模拟模型及应用研究进展[J]. 遥感学报, 2017,21(3):329-340.
Li S Y, Liu X P, Li X, et al. Simulation model of land use dynamics and application:Progress and prospects[J]. Journal of Remote Sensing, 2017,21(3):329-340.
[13] 张登荣, 许思莹, 谢斌, 等. 近40年椒江-台州湾滩涂围垦土地利用变化的遥感调查[J]. 国土资源遥感, 2016,28(1):101-106.doi: 10.6046/gtzyyg.2016.01.15.
Zhang D R, Xu S Y, Xie B, et al. Land use change of reclaimed mud flats in Jiaojiang-Taizhou Estuary in the past 40 years based on remote sensing technology[J]. Remote Sensing for Land and Resources, 2016,28(1):101-106.doi: 10.6046/gtzyyg.2016.01.15.
[14] Yin J, Yin Z, Zhong H, et al. Monitoring urban expansion and land use/land cover changes of Shanghai metropolitan area during the transitional economy(1979—2009) in China[J]. Environmental Monitoring and Assessment, 2011,177(1-4):609-621.
[15] 陈超, 傅姣琪, 随欣欣, 等. 面向灾后水体遥感信息提取的知识决策树构建及应用[J]. 遥感学报, 2018,22(5):792-801.
Chen C, Fu J Q, Sui X X, et al. Construction and application of knowledge decision tree after a disaster for water body information extraction from remote sensing images[J]. Journal of Remote Sensing, 2018,22(5):792-801.
[16] 陈玲, 贾佳, 王海庆. 高分遥感在自然资源调查中的应用综述[J]. 国土资源遥感, 2019,31(1):1-7.doi: 10.6046/gtzyyg.2009.01.01.
Chen L, Jia J, Wang H Q. An overview of applying high resolution remote sensing to land and resources survey[J]. Remote Sensing for Land and Resources, 2019,31(1):1-7.doi: 10.6046/gtzyyg.2009.01.01.
[17] 施利锋, 张增祥, 刘芳, 等. 1973年—2013年经济特区城市空间扩展遥感监测[J]. 遥感学报, 2015,19(6):1030-1039.
Shi L F, Zhang Z X, Liu F, et al. Spatial expansion remote sensing monitoring of special economic zones from 1973 to 2013[J]. Journal of Remote Sensing, 2015,19(6):1030-1039.
[18] 曾刚, 尚勇敏, 司月芳. 中国区域经济发展模式的趋同演化-以中国16中典型模式为例[J]. 地理研究, 2015,34(11):2005-2020.
Zeng G, Shang Y M, Si Y F. The convergent evolution of China’s regional economic development models[J]. Geographical Research, 2015,34(11):2005-2020.
[19] 鲁旭, 陈超. 基于遥感数据的舟山市土地利用时空格局研究[J]. 浙江科技学院学报, 2018,30(5):404-411.
Lu X, Chen C. Research on spatial-temporal pattern of land use in Zhoushan city by using remote sensing images[J]. Journal of Zhejiang University of Science and Technology, 2018,30(5):404-411.
[20] 张晓萍, 吕颖, 张华国, 等. 1990—2011年舟山群岛不透水面动态遥感分析[J]. 国土资源遥感, 2018,30(2):178-185.doi: 10.6046/gtzyyg.2018.02.01.
Zhang X P, Lyu Y, Zhang H G, et al. Remote sensing analysis of impervious surface change in Zhoushan Islands during 1990—2011[J]. Remote Sensing for Land and Resources, 2018,30(2):178-185.doi: 10.6046/gtzyyg.2018.02.01.
[1] 陈超, 陈慧欣, 陈东, 张自力, 张旭锋, 庄悦, 褚衍丽, 陈建裕, 郑红. 舟山群岛海岸线遥感信息提取及时空演变分析[J]. 国土资源遥感, 2021, 33(2): 141-152.
[2] 张晓萍, 吕颖, 张华国, 李朝奎. 1990―2011年舟山群岛不透水面动态遥感分析[J]. 国土资源遥感, 2018, 30(2): 178-185.
[3] 张华国, 周长宝, 楼琇林, 史爱琴, 肖清梅. 舟山群岛—宁波深水港群遥感综合调查[J]. 国土资源遥感, 2003, 15(4): 63-67.
Viewed
Full text


Abstract

Cited

  Shared   
  Discussed   
京ICP备05055290号-2
版权所有 © 2015 《自然资源遥感》编辑部
地址:北京学院路31号中国国土资源航空物探遥感中心 邮编:100083
电话:010-62060291/62060292 E-mail:zrzyyg@163.com
本系统由北京玛格泰克科技发展有限公司设计开发