|
|
 |
|

|
|
|
Relationship of air temperature to NDVI and NDBI in Guangzhou City using spatial autoregressive model |
Jianhui XU1,2,3( ), Yi ZHAO4,5, Minghong XIAO6, Kaiwen ZHONG1,2,3, Huihua RUAN7 ), Yi ZHAO4,5, Minghong XIAO6, Kaiwen ZHONG1,2,3, Huihua RUAN7 |
1. Guangzhou Institute of Geography, Guangzhou 510070, China
2. Key Laboratory of Guangdong for Utilization of Remote Sensing and Geographical Information System, Guangzhou 510070, China
3. Guangdong Open Laboratory of Geospatial Information Technology and Application, Guangzhou 510070, China
4. Guangzhou Institute of Geochemistry, China Academy of Sciences, Guangzhou 510640, China
5. University of Chinese Academy of Sciences, Beijing 100049, China
6. Guangxi Institute of Geographic Information Surveying and Mapping, Liuzhou 545006, China
7. Guangdong Meteorological Observation Data Center, Guangzhou 510080, China |
|
|
|
|
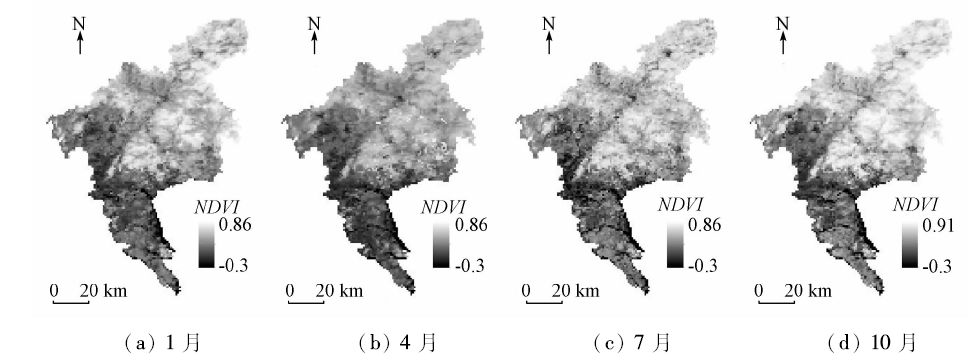
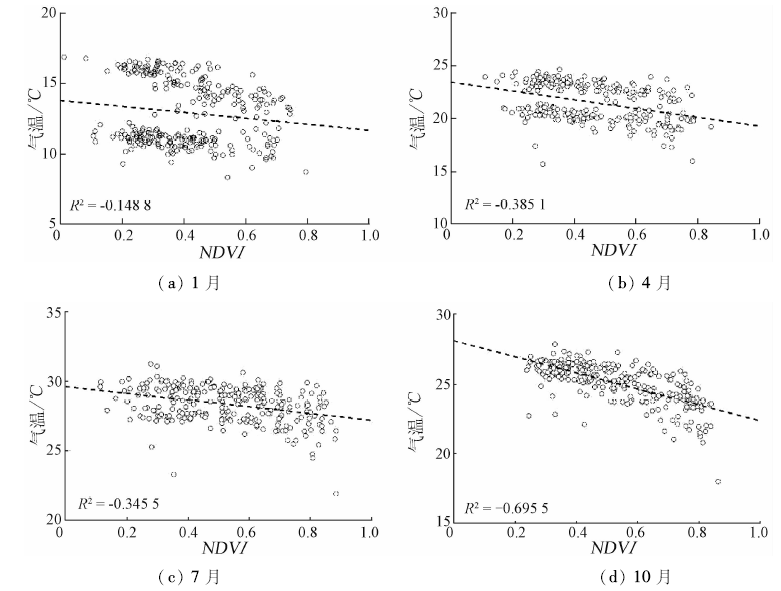
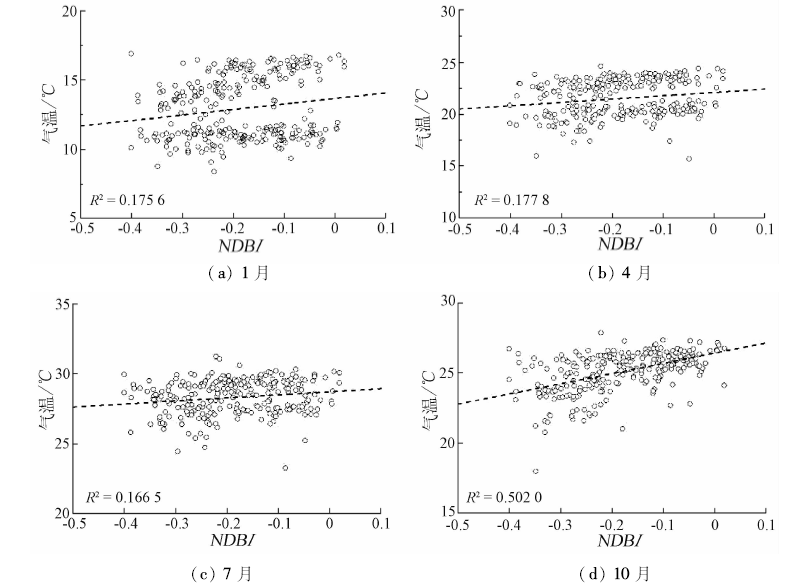
Abstract To study the spatio-temporal pattern of the air temperature in Guangzhou City, the authors used MODIS monthly normalized difference vegetation index (NDVI) acquired in 2015 and extracted the normalized difference built-up index (NDBI) with Landsat8 OLI data. The correlation analysis method was used to explore the relationship between air temperature and NDVI, NDBI. The experimental results show that there is a negative relation between NDVI and air temperature and a positive relation between NDBI and air temperature. On such a basis, the spatial lag model (SLM) and spatial error model (SEM) were established to discuss the spatial relations between air temperature and NDVI, NDBI in different seasons, respectively. The SLM and SEM results were compared with the ordinary least square regression (OLS) model, which shows the best performance of the SLM and SEM models. The SLM model with higher R 2 and lower AIC values performs slightly better than the SEM model. NDVI has more influence on air temperature from spring to autumn than NDBI. In the SLM model, the positive and significant spatial autoregressive coefficients indicate an active influence from neighboring meteorological stations.
|
| Keywords
spatial autoregressive model
normalized difference built-up index(NDBI)
normalized difference vegetation index(NDVI)
air temperature
|
|
|
|
Issue Date: 30 May 2018
|
|
|
| [1] |
肖荣波, 欧阳志云, 李伟峰 , 等. 城市热岛的生态环境效应[J]. 生态学报, 2005,25(8):2055-2060.
|
| [1] |
Xiao R B, Ouyang Z Y, Li W F , et al. A review of the eco-environmental consequences of urban heat islands[J]. Acta Ecologica Sinica, 2005,25(8):2055-2060.
|
| [2] |
岳文泽, 徐丽华 . 城市土地利用类型及格局的热环境效应研究——以上海市中心城区为例[J]. 地理科学, 2007,27(2):243-248.
doi: 10.3969/j.issn.1000-0690.2007.02.020
url: http://d.wanfangdata.com.cn/Periodical_dlkx200702020.aspx
|
| [2] |
Yue W Z, Xu L H . Thermal environment effect of urban land use type and pattern:A case study of central area of Shanghai City[J]. Scientia Geographica Sinica, 2007,27(2):243-248.
|
| [3] |
Yuan F, Bauer M E . Comparison of impervious surface area and normalized difference vegetation index as indicators of surface urban heat island effects in Landsat imagery[J]. Remote Sensing of Environment, 2007,106(3):375-386.
doi: 10.1016/j.rse.2006.09.003
url: http://linkinghub.elsevier.com/retrieve/pii/S0034425706003191
|
| [4] |
韩雅, 朱文博, 李双成 . 基于GWR模型的中国NDVI与气候因子的相关分析[J]. 北京大学学报(自然科学版), 2016,52(6):1125-1133.
doi: 10.13209/j.0479-8023.2015.130
url: http://www.cqvip.com/QK/94075X/201606/670820325.html
|
| [4] |
Han Y, Zhu W B, Li S C . Modelling relationship between NDVI and climatic factors in China using geographically weighted regression[J]. Acta Scientiarum Naturalium Universitatis Pekinensis, 2016,52(6):1125-1133.
|
| [5] |
沈斌, 房世波, 余卫国 . NDVI与气候因子关系在不同时间尺度上的结果差异[J]. 遥感学报, 2016,20(3):481-490.
|
| [5] |
Shen B, Fang S B, Yu W G . Different correlations between NDVI and meteorological factors at temporal-time scales[J]. Journal of Remote Sensing, 2016,20(3):481-490.
|
| [6] |
仙巍, 邵怀勇 . 长江上游安宁河流域植被生长变化对气候条件的响应[J]. 国土资源遥感, 2015,27(3):108-113.doi: 10.6046/gtzyyg.2015.03.18.
|
| [6] |
Xian W, Shao H Y . Responses of vegetation changes to climatic variations in Anning River Basin of upper Yangtze River Region[J]. Remote Sensing for Land and Resources, 2015,27(3):108-113.doi: 10.6046/gtzyyg.2015.03.18.
|
| [7] |
殷刚, 孟现勇, 王浩 , 等. 1982 —2012年中亚地区植被时空变化特征及其与气候变化的相关分析[J]. 生态学报, 2017,37(9):3149-3163.
|
| [7] |
Yin G, Meng X Y, Wang H , et al.Spatial-temporal variation of vegetation and its correlation with climate change in Central Asia during the period of 1982—2012[J]. Acta Ecologica Sinca, 2017,37(9):3149-3163.
|
| [8] |
梁守真, 禹定峰, 王猛 , 等. 应用遥感时序数据研究植被变化与气候因子的关系——以环渤海地区为例[J]. 国土资源遥感, 2015,27(3):114-121.doi: 10.6046/gtzyyg.2015.03.19.
|
| [8] |
Liang S Z, Yu D F, Wang M , et al. Application of remote sensing time-series data to investigate the relationship between vegetation change and climatic factors:A case study of Circum-Bohai Sea area[J]. Remote Sensing for Land and Resources, 2015,27(3):114-121.doi: 10.6046/gtzyyg.2015.03.19.
|
| [9] |
孟丹, 李小娟, 宫辉力 , 等. 京津冀地区NDVI变化及气候因子驱动分析[J]. 地球信息科学学报, 2015,17(8):1001-1007.
doi: 10.3724/SP.J.1047.2015.01001
url: http://www.cqvip.com/QK/86408A/201508/665612328.html
|
| [9] |
Meng D, Li X J, Gong H L , et al.Analysis of spatial-temporal change of NDVI and its climatic driving factors in Beijing-Tianjin-Hebei metropolis circle from 2001 to 2013[J]. Journal of Geo-Information Science, 2015,17(8):1001-1007.
|
| [10] |
Li J Z, Zheng J G .Study on the relationship between urban surface temperature and vegetation index in Xuchang City[J].Applied Mechanics and Materials, 2013, 321-324:2496-2500.
doi: 10.4028/www.scientific.net/AMM.321-324.2496
url: https://www.scientific.net/AMM.321-324
|
| [11] |
Huang C D, Ye X Y . Spatial modeling of urban vegetation and land surface temperature:A case study of Beijing[J]. Sustainability, 2015,7(7):9478-9504.
doi: 10.3390/su7079478
url: http://www.mdpi.com/2071-1050/7/7/9478
|
| [12] |
Walther G R, Post E, Convey P , et al. Ecological responses to recent climate change[J]. Nature, 2002,416(6879):389-395.
doi: 10.1038/416389a
pmid: 11919621
url: http://www.nature.com/articles/416389a
|
| [13] |
Liu J H, Wu J J, Wu Z T , et al. Response of NDVI dynamics to precipitation in the Beijing-Tianjin sandstorm source region[J]. International Journal of Remote Sensing, 2013,34(15):5331-5350.
doi: 10.1080/01431161.2013.787505
url: http://www.tandfonline.com/doi/abs/10.1080/01431161.2013.787505
|
| [14] |
侯光雷, 张洪岩, 王野乔 , 等. 基于MODIS数据的吉林省中部地表温度反演及空间分布研究[J]. 地理科学, 2010,30(3):421-427.
|
| [14] |
Hou G L, Zhang H Y, Wang Y Q , et al. Retrieval and spatial distribution of land surface temperature in the middle part of Jilin Province based on MODIS data[J]. Scientia Geographica Sinica, 2010,30(3):421-427.
|
| [15] |
贾虎军, 杨武年, 周丹 , 等. 基于MODIS地表温度和归一化植被指数的生态环境变化分析[J]. 遥感信息, 2014,29(3):44-49.
doi: 10.3969/j.issn.1000-3177.2014.03.008
url: http://www.cqvip.com/QK/92871X/201403/1003261433.html
|
| [15] |
Jia H J, Yang W N, Zhou D , et al. Analysis of the ecological environment changes in land surface temperature and NDVI based on MODIS remote sensing data[J]. Remote Sensing Information, 2014,29(3):44-49.
|
| [16] |
Kumar D, Shekhar S . Statistical analysis of land surface temperature-vegetation indexes relationship through thermal remote sensing[J]. Ecotoxicology and Environmental Safety, 2015,121:39-44.
doi: 10.1016/j.ecoenv.2015.07.004
pmid: 26209299
url: http://linkinghub.elsevier.com/retrieve/pii/S0147651315300117
|
| [17] |
崔林丽, 史军 . 中国华东及其周边地区NDVI对气温和降水的季节响应[J]. 资源科学, 2012,34(1):81-90.
|
| [17] |
Cui L L, Shi J . Characteristics of seasonal response of NDVI to variations in temperature and precipitation in east China and its surrounding areas[J]. Resources Science, 2012,34(1):81-90.
|
| [18] |
历华, 柳钦火, 邹杰 . 基于MODIS数据的长株潭地区NDBI和NDVI与地表温度的关系研究[J]. 地理科学, 2009,29(2):262-267.
doi: 10.3969/j.issn.1000-0690.2009.02.019
url: http://www.cqvip.com/QK/71135X/201107/30270076.html
|
| [18] |
Li H, Liu Q H, Zou J . Relationships of LST to NDBI and NDVI in Changsha-Zhuzhou-Xiangtan Area based on MODIS data[J]. Scientia Geographica Sinica, 2009,29(2):262-267.
|
| [19] |
宋瑞祥, 张庆国, 孟庆岩 , 等. 基于Landsat8 OLI数据的合肥市热岛时空特征分析[J]. 安徽农业大学学报, 2016,43(3):474-480.
doi: 10.13610/j.cnki.1672-352x.20160512.014
url: http://d.wanfangdata.com.cn/Periodical/ahnydxxb201603025
|
| [19] |
Song R X, Zhang Q G, Meng Q Y , et al. Landsat8 OLI data-based analysis of spatial-temporal characteristics of heat island in Hefei[J]. Journal of Anhui Agricultural University, 2016,43(3):474-480.
|
| [20] |
薛晓娟, 孟庆岩, 王春梅 , 等. 北京市热岛效应时空变化的HJ-1B监测分析[J]. 地球信息科学学报, 2012,14(4):474-480.
doi: 10.3724/SP.J.1047.2012.00474
url: http://d.wanfangdata.com.cn/Periodical/dqxxkx201204009
|
| [20] |
Xue X J, Meng Q Y, Wang C M , et al. Monitoring spatio-temporal changes of heat island effect in Beijing based on HJ-1B[J]. Journal of Geo-Information Science, 2012,14(4):474-480.
|
| [21] |
Grover A, Singh R B . Analysis of urban heat island(UHI) in relation to normalized difference vegetation index(NDVI):A comparative study of Delhi and Mumbai[J]. Environments, 2015,2(2):125-138.
doi: 10.3390/environments2020125
url: http://www.mdpi.com/2076-3298/2/2/125
|
| [22] |
樊亚鹏, 徐涵秋, 李乐 , 等. 广州市城市扩展及其城市热岛效应分析[J]. 遥感信息, 2014,29(1):23-29.
doi: 10.3969/j.issn.1000-3177.2014.01.006
url: http://d.wanfangdata.com.cn/Periodical/ygxx201401006
|
| [22] |
Fan Y P, Xu H Q, Li L , et al. Analysis of urban expansion and urban heat island effect in Guangzhou City[J]. Remote Sensing Information, 2014,29(1):23-29.
|
| [23] |
查勇, 倪绍祥, 杨山 . 一种利用TM图像自动提取城镇用地信息的有效方法[J]. 遥感学报, 2003,7(1):37-40.
|
| [23] |
Zha Y, Ni S X, Yang S . An effective approach to automatically extract urban land-use from TM imagery[J]. Journal of Remote Sensing, 2003,7(1):37-40.
|
| [24] |
Tan B, Hu J N, Zhang P , et al. Validation of moderate resolution imaging spectroradiometer leaf area index product in croplands of Alpilles,France[J]. Journal of Geophysical Research, 2005,110(D1):D01107.
doi: 10.1029/2004JD004860
url: http://onlinelibrary.wiley.com/doi/10.1029/2004JD004860/full
|
| [25] |
Anselin L . Spatial Econometrics:Methods and Models[M]. Dordrecht: Kluwer Academic Publishers, 1988.
|
| [26] |
Akaike H . Information theory and an extension of the maximum likelihood principle[M] //Petrov B N,Csáki F.Second International Symposium on Information Theory.Budapest:Académiai Kiadó, 1973: 267-281.
|
|
Viewed |
|
|
|
Full text
|
|
|
|
|
Abstract
|
|
|
|
|
Cited |
|
|
|
|
| |
Shared |
|
|
|
|
| |
Discussed |
|
|
|
|
 2018,
Vol. 30
2018,
Vol. 30