|
|
|
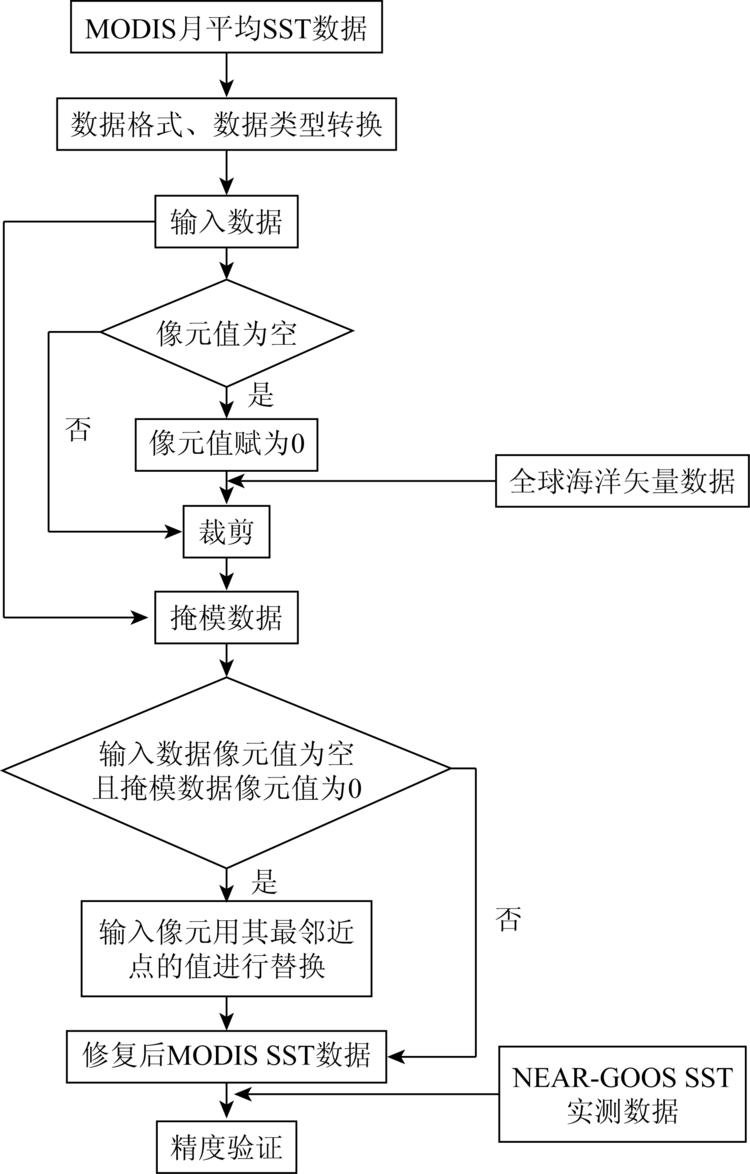
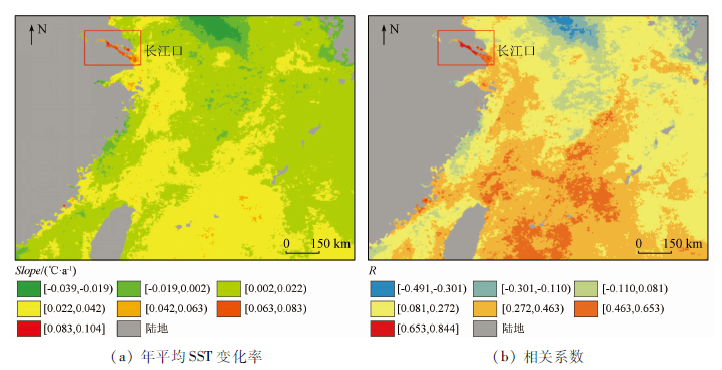
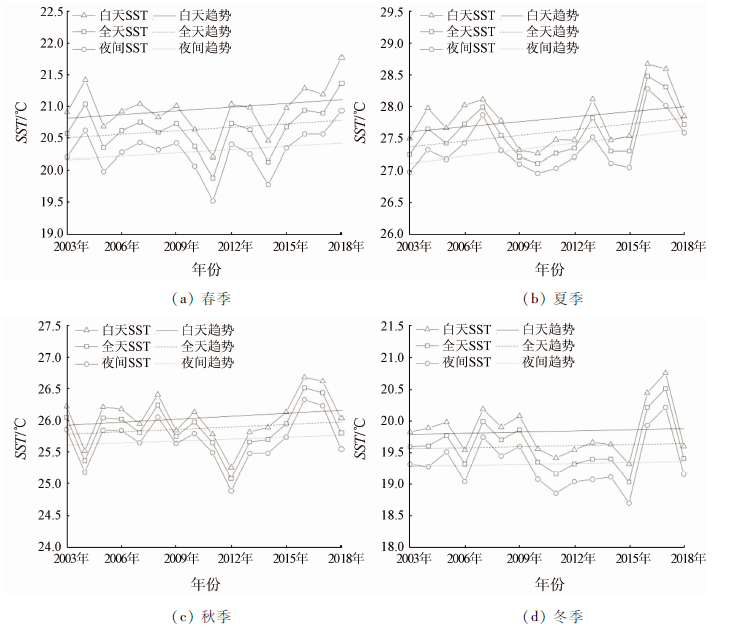
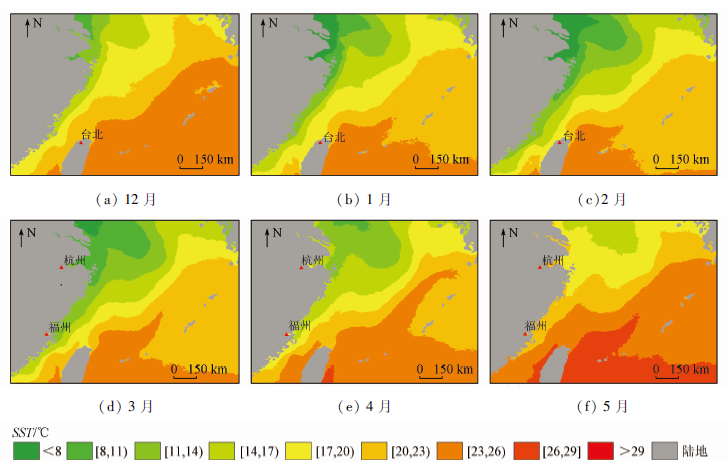
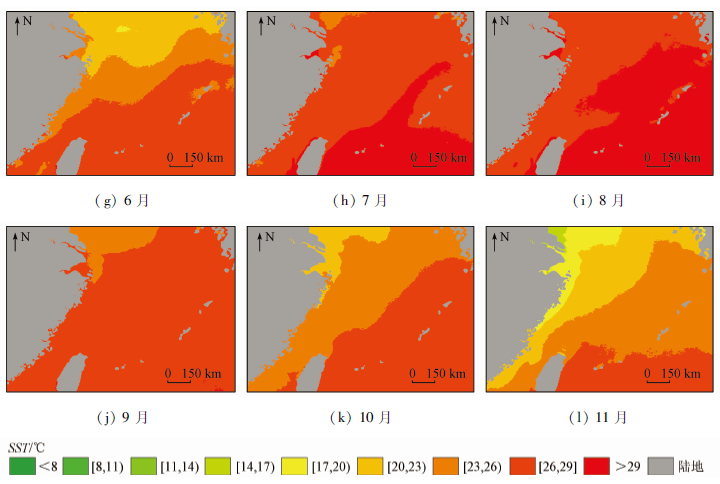
Abstract In order to grasp the law of sea surface temperature (SST) change in the East China Sea from 2003 to 2018, the authors analyzed the relationship between SST changes and climate anomalies, and used remote sensing data to monitor the temporal and spatial evolution of SST in the East China Sea for 16 years. With the 2003—2018 MODIS SST product as the data source, the data were first repaired by the nearest neighbor point value replacement method, and the measured data were used to verify the accuracy. The least square method and Pearson correlation coefficient were used to analyze the SST change trend. Through cross-correlation analysis, the correlation between sea surface temperature anomaly (SSTA) and southern oscillation index (SOI) was studied. The results are as follows: ① SST in the East China Sea generally showed an upward trend from 2003 to 2018, and the temperature rise in summer was more obvious. The temperature rise rate in the Yangtze River estuary could reach above 0.042 ℃/a; ② SST in the East China Sea showed a SE—NW distribution, and at the same latitude, SST near the mainland was usually lower than the eastern sea area, but the SST of Hangzhou Bay area from April to September was higher than that of the eastern area; ③ SOI was basically not related to the East China Sea SSTA that was 15 months behind it, but it had a strong negative correlation with the East China Sea SSTA that was 21~39 months behind with correlation coefficient exceeding -0.2. The research results can provide a reference for grasping the laws of climate change and predicting extreme weather.
|
| Keywords
sea surface temperature(SST)
spatial and temporal variability
East China Sea
|
|
|
|
Corresponding Authors:
MAO Kebiao
E-mail: wangping_1997@163.com;maokebiao@caas.cn
|
|
Issue Date: 23 December 2020
|
|
|
| [1] |
邱欢. 140年来东海及毗邻的西北太平洋海水温度变化的特征分析[D]. 上海:上海师范大学, 2017.
|
| [1] |
Qiu H. Characteristics of sea temperature changes in the East China Sea and the adjacent Northwest Pacific over the past 140 years[D]. Shanghai:Shanghai Normal University, 2017.
|
| [2] |
孙楠楠. 东海黑潮海表温度变化及其与厄尔尼诺和全球变暖的关系[D]. 青岛:中国海洋大学, 2009.
|
| [2] |
Sun N N. Variations of sea surface temperature over Kuroshio in the East Sea and its relationship with El-Niño and global warming[D]. Qingdao:Ocean University of China, 2009.
|
| [3] |
王智祖, 左军成, 陈美香, 等. 黄、东海沿岸海表温度变化与厄尔尼诺的关系[J]. 河海大学学报(自然科学版), 2012,40(4):461-468.
|
| [3] |
Wang Z Z, Zuo J C, Chen M X, et al. Relationship between El Niño and sea surface temperature variation in coastal region of Yellow Sea and East China Sea[J]. Journal of Hohai University (Natural Sciences), 2012,40(4):461-468.
|
| [4] |
张琪. 中国近海海表温度的年代际变化及其对全球变暖的响应[D]. 青岛:中国海洋大学, 2014.
|
| [4] |
Zhang Q. The interdecadal variation of SST in the coastal China Seas and its response to global warming[D]. Qingdao:Ocean University of China, 2014.
|
| [5] |
Li G, Li C Y, Tan Y K, et al. The interdecadal changes of South Pacific Sea surface temperature in the mid-1990s and their connections with ENSO[J]. Advances in Atmospheric Sciences, 2014,31(1):66-84.
doi: 10.1007/s00376-013-2280-3
url: http://link.springer.com/10.1007/s00376-013-2280-3
|
| [6] |
Robles-Tamayo C M, Valdez-Holguín J E, García-Morales R, et al. Sea surface temperature (SST) variability of the eastern coastal zone of the gulf of California[J]. Remote Sensing, 2018,10(9):1434-1456.
|
| [7] |
谭红建, 蔡榕硕, 黄荣辉. 中国近海海表温度对气候变暖及暂缓的显著响应[J]. 气候变化研究进展, 2016,12(6):500-507.
|
| [7] |
Tan H J, Cai R S, Huang R H. Enhanced responses of sea surface temperature over offshore China to global warming and hiatus[J]. Climate Change Research, 2016,12(6):500-507.
|
| [8] |
董雷娟, 李洪平. 全球海表温度变化特征分析[J]. 地理空间信息, 2013,11(5):29-33.
|
| [8] |
Dong L J, Li H P. Analysis of global sea surface temperature variation[J]. Geospatial Information, 2013,11(5):29-33.
|
| [9] |
Liu Q Y, Zhang Q. Analysis on long-term change of sea surface temperature in the China seas[J]. Oceanic and Coastal Sea Research, 2013,12(2):295-300.
|
| [10] |
Park Y G, Choi A. Long-term changes of South China Sea surface temperatures in winter and summer[J]. Continental Shelf Research, 2017,143:185-193.
|
| [11] |
宋春阳, 姜华, 张守文, 等. 2017年中国近海海表温度特征[J]. 海洋预报, 2019,36(1):1-9.
|
| [11] |
Song C Y, Jiang H, Zhang S W, et al. Sea surface temperature characteristics of the China seas in 2017[J]. Marine Forecasts, 2019,36(1):1-9.
|
| [12] |
伍玉梅, 徐兆礼, 樊伟, 等. 1985—2005年东海海表温度时空变化特征分析[J]. 海洋学报, 2011,33(6):9-18.
|
| [12] |
Wu Y M, Xu Z L, Fan W, et al. Change of sea surface temperature in East China Sea during 1985—2005[J]. Acta Oceanologica Sinica, 2011,33(6):9-18.
|
| [13] |
化成君, 伍玉梅, 张衡, 等. 2014年东黄海海表温度季节变化分析[J]. 渔业信息与战略, 2016,31(3):193-205.
|
| [13] |
Hua C J, Wu Y M, Zhang H, et al. Analysis on the seasonal variability of sea surface temperature in the East the Yellow Sea in 2014[J]. Fishery Information and Strategy, 2016,31(3):193-205.
|
| [14] |
张春桂. 福建省近海区域海面表层温度的卫星遥感应用研究[J]. 国土资源遥感, 1999,11(1):25-28.doi: 10.6046/gtzyyg.1999.01.06.
|
| [14] |
Zhang C G. Study on the utilization of satellite remote sensing for sea surface temperature of coastal area in Fujian Province[J]. Remote Sensing for Land and Resources, 1999,11(1):25-28.doi: 10.6046/gtzyyg.1999.01.06.
|
| [15] |
陈雪冬, 崔雪森. 卫星遥感在中东太平洋大眼金枪鱼渔场与环境关系的应用研究[J]. 遥感信息, 2006(1):25-28.
|
| [15] |
Chen X D, Cui X S. Application study on relationship between bigeye tuna fishing grounds and environment in the eastern and central Pacific Ocean by satellite remote sensing[J]. Remote Sensing Information, 2006(1):25-28.
|
| [16] |
Haines S L, Jedlovec G J, Lazarus S M. A MODIS sea surface temperature composite for regional applications[J]. Geoscience and Remote Sensing, 2007,45(9):2919-2927.
|
| [17] |
孙凤琴, 张彩云, 商少平, 等. 西北太平洋部分海域AVHRR、TMI与MODIS遥感海表层温度的初步验证[J]. 厦门大学学报(自然科学版), 2007,46(1):1-5.
|
| [17] |
Sun F Q, Zhang C Y, Shang S P, et al. Primary validation of AVHRR/MODIS/TMI SST for part of the northwest Pacific[J]. Journal of Xiamen University(Natural Science), 2007,46(1):1-5.
|
| [18] |
李雪丁. 台湾海峡MODIS遥感的初步验证[J]. 台湾海峡, 2011,30(3):336-340.
|
| [18] |
Li X D. Primary validation of moderate resolution imaging spectroradiometer (MODIS) sea surface temperature in the Taiwan Strait[J]. Journal of Oceanography in Taiwan Strait, 2011,30(3):336-340.
|
| [19] |
丁又专. 卫星遥感海表温度与悬浮泥沙浓度的资料重构及数据同化试验[D]. 南京:南京理工大学, 2009.
|
| [19] |
Ding Y Z. Data reconstruction and assimilation experiment of satellite sea surface temperature and suspended sediment concentration[D]. Nanjing:Nanjing University of Science and Technology, 2009.
|
| [20] |
马寨璞, 井爱芹. 动态最优插值方法及其同化应用研究[J]. 河北大学学报(自然科学版), 2004,24(6):574-580.
|
| [20] |
Ma Z P, Jing A Q. Dynamic interpolation and its application in data assimilation[J]. Journal of Hebei University (Natural Science Edition), 2004,24(6):574-580.
|
| [21] |
谈建国, 周红妹, 陆贤, 等. NOAA卫星云检测和云修复业务应用系统的研制和建立[J]. 遥感技术与应用, 2000,15(4):228-231.
url: http://www.rsta.ac.cn/CN/abstract/abstract1490.shtml
|
| [21] |
Tan J G, Zhou H M, Lu X, et al. Research and establishment in operation system of cloud detection and rehabilitation applied to NOAA satellite[J]. Remote Sensing Technology and Application, 2000,15(4):228-231.
url: http://www.rsta.ac.cn/CN/abstract/abstract1490.shtml
|
| [22] |
毛志华, 朱乾坤, 潘德炉, 等. 卫星遥感速报北太平洋渔场海温方法研究[J]. 中国水产科学, 2003,10(6):502-506.
|
| [22] |
Mao Z H, Zhu Q K, Pan D L, et al. Method of satellite-measured sea surface temperature charts for north Pacific fishery grounds[J]. Journal of Fishery Sciences of China, 2003,10(6):502-506.
|
| [23] |
赵海龙, 张丹丹, 黄松, 等. 基于皮尔逊相关系数的海南省地闪密度与雷击故障关系分析[J]. 高压电器, 2019,55(8):186-192.
|
| [23] |
Zhao H L, Zhang D D, Huang S, et al. Analysis on the relation between cloud-to-ground lightning density and lightning trip rate in Hainan Province based on Pearson correlation coefficient[J]. High Voltage Apparatus, 2019,55(8):186-192.
|
| [24] |
范海燕, 滕军, 管磊, 等. NOAA/AVHRR卫星海表温度在西北太平洋的印证及分析[J]. 海洋预报, 2009,26(2):7-14.
|
| [24] |
Fan H Y, Teng J, Guan L, et al. Validation of sea surface temperature from NOAA/AVHRR in the Northwest Pacific[J]. Marine Forecasts, 2009,26(2):7-14.
|
| [25] |
徐冰, 陈新军, 田思泉, 等. 厄尔尼诺和拉尼娜事件对秘鲁外海茎柔鱼渔场分布的影响[J]. 水产学报, 2012,36(5):696-707.
|
| [25] |
Xu B, Chen X J, Tian S Q, et al. Effects of El Niño/La Niña on distribution of fishing ground of Dosidicus gigas off Peru waters[J]. Journal of Fisheries of China, 2012,36(5):696-707.
|
| [26] |
王文秀, 林燕丹, 许桂旋, 等. 1951—2016年厄尔尼诺/拉尼娜事件对登陆华南地区台风的影响[J]. 亚热带水土保持, 2018,30(2):13-19.
|
| [26] |
Wang W X, Lin Y D, Xu G X, et al. Impact of El Niño or La Niño on the typhoon landed in South China from 1951 to 2016[J]. Subtropical Soil and Water Conservation, 2018,30(2):13-19.
|
| [27] |
刘少锋, 陈红, 林朝晖. 海温异常对2008年1月中国气候异常影响的数值模拟[J]. 气候与环境研究, 2008,13(4):500-509.
|
| [27] |
Liu S F, Chen H, Lin Z H. Numerical simulation of the impact of sea surface temperature anomalies on the climate anomalies over China in January 2008[J]. Climatic and Environmental Research, 2008,13(4):500-509.
|
|
Viewed |
|
|
|
Full text
|
|
|
|
|
Abstract
|
|
|
|
|
Cited |
|
|
|
|
| |
Shared |
|
|
|
|
| |
Discussed |
|
|
|
|
 2020,
Vol. 32
2020,
Vol. 32
 ), MAO Kebiao2(