|
|
|
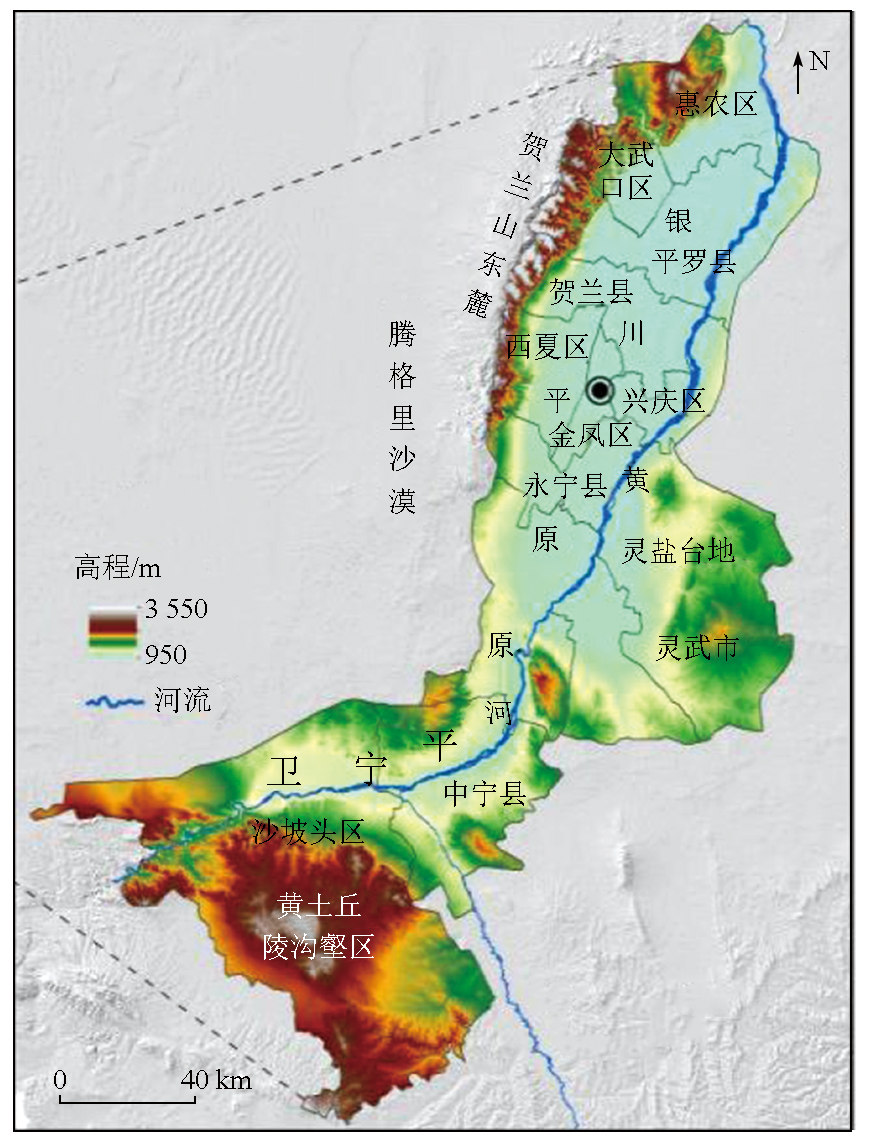
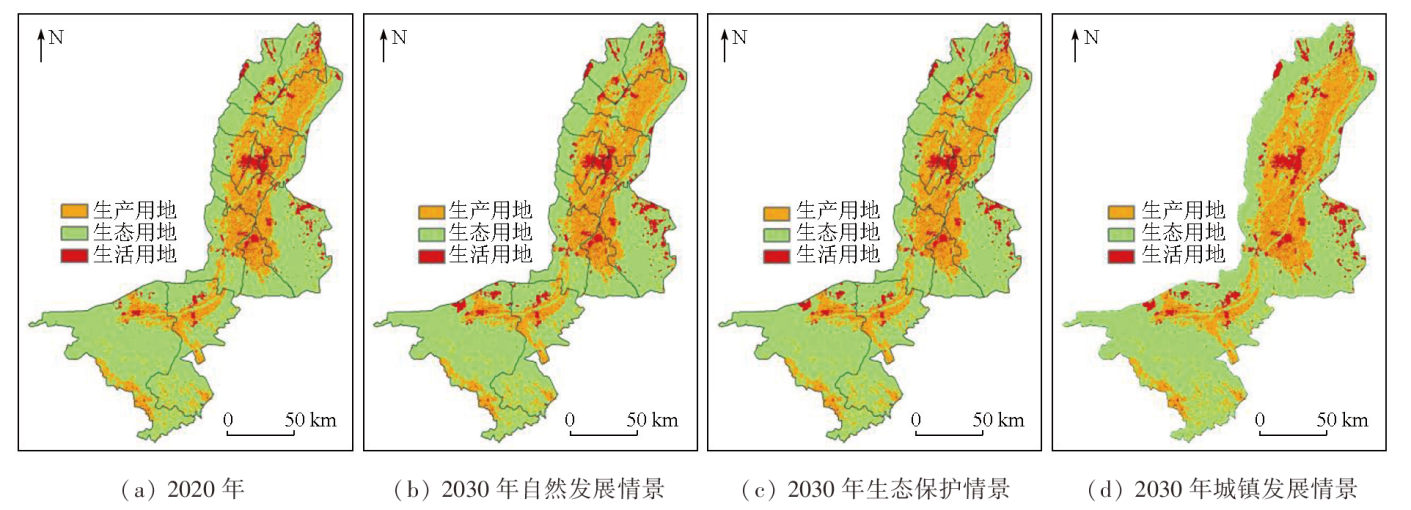
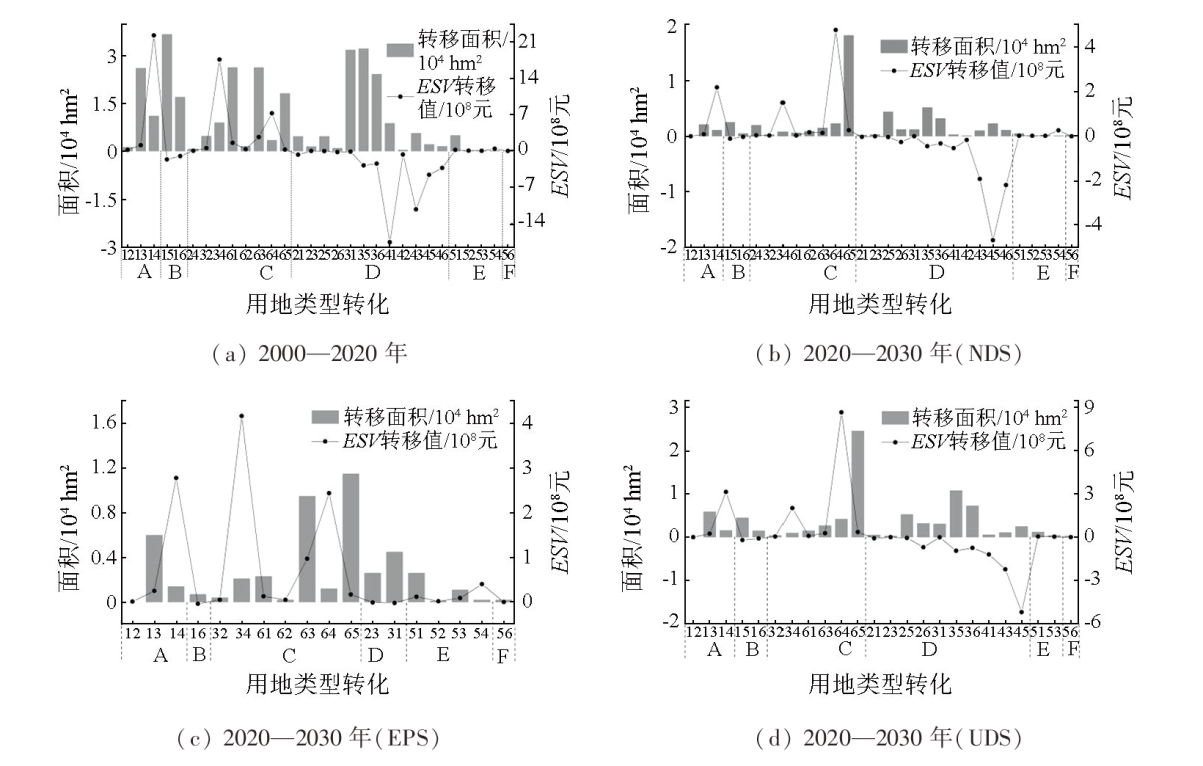
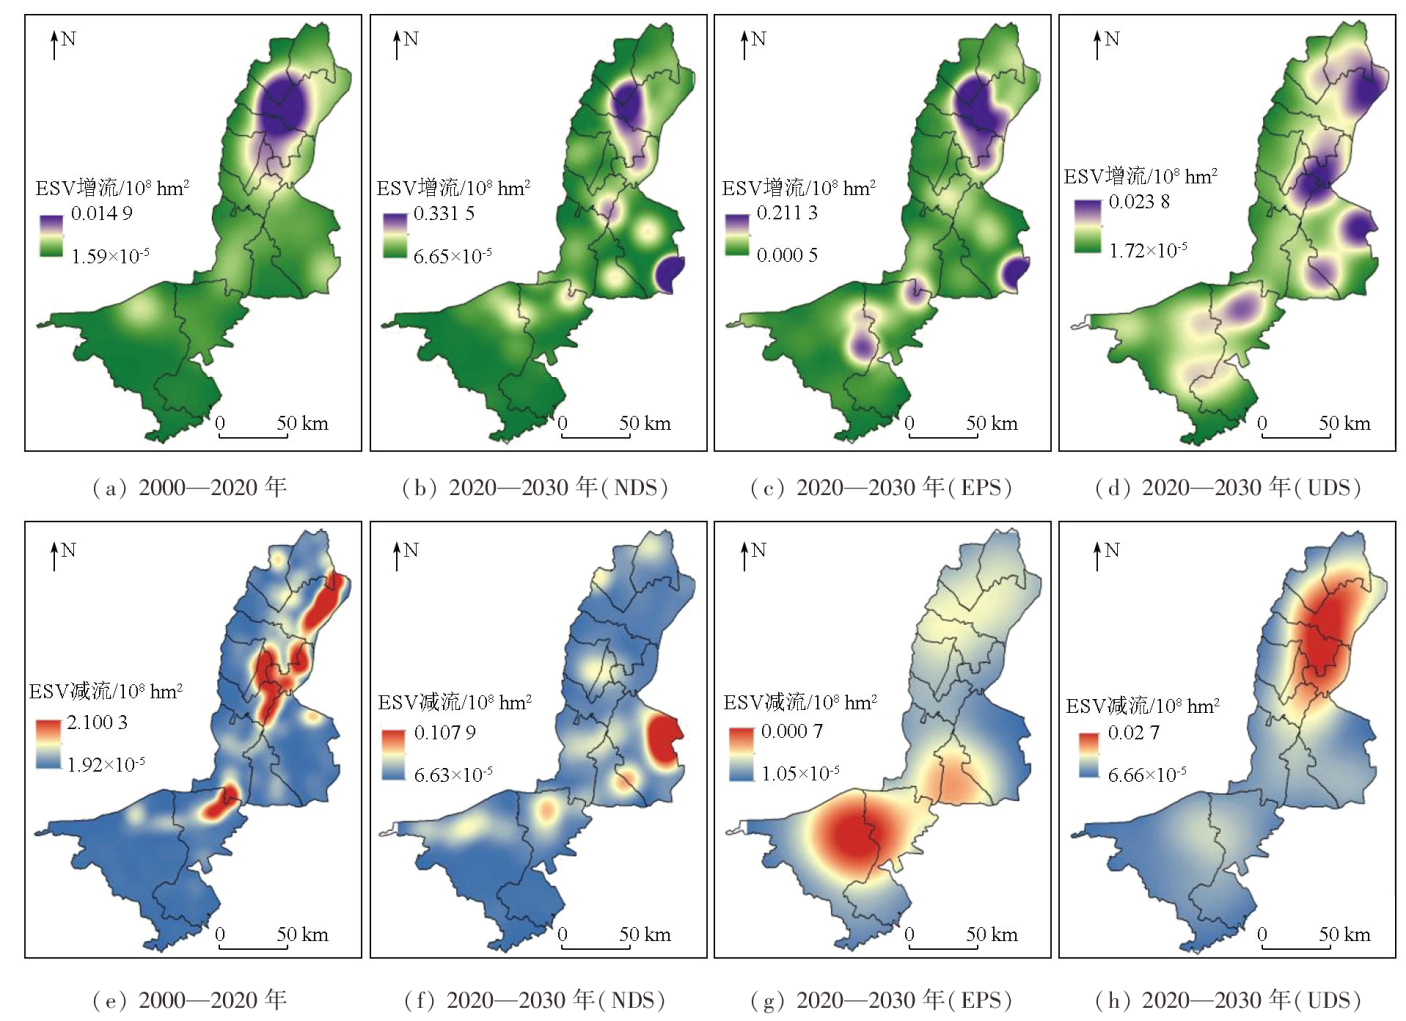
Abstract Exploring the response of ecosystem services to the changes in production-living-ecological land use under different scenarios is critical for the sustainable development of territorial space and the improvement of regional systems. This study investigated the ecological economic belt along the Yellow River in Ningxia Hui Autonomous Region. Based on the PLUS-MarKov model, it simulated the changes in production-living-ecological land use in the ecological economic belt in 2030 under the natural development scenario (NDS), ecological protection scenario (EPS), and urban development scenario (UDS). Moreover, it explored the response characteristics of ecosystem service value (ESV) to the changes in production-living-ecological land use. The results show that the production land exhibits both increase and decrease in the Yinchuan and Weining plains. The ecological land is somewhat reduced due to internal structural adjustment and optimization, concentrated in Shapotou, Baijitan, the Yellow River riparian shelterbelt in the north-central Yinchuan Plain, and the loess hilly soil and water conservation area in the south. The land for living continues to increase, expanding from urban to surrounding areas. The NDS reveals a reduced rate of changes in the production-living-ecological land use, while the EPS indicates a reduced rate of shift in ecological land use. In contrast, the UDS shows a higher rate of increase in land for living and higher rates of decrease in ecological and production land. The ESV is improved under the three scenarios, specifically in decreased order of EPS (11.48×10⁸ yuan), UDS (2.74×10⁸ yuan), and NDS (1.89×10⁸ yuan). The ESV improvement areas extend primarily from the north-central Yinchuan Plain, Weining Plain, and Lingyan Platform to the peripheries. The ESV reduction areas show varying distributions under different scenarios. To achieve high-quality development, the ecological economic belt should prioritize ecological protection, prevent the disorderly spreading of land for living, and ensure the retention of production land.
|
| Keywords
production-living-ecological land use
PLUS-MarKov model
scenario simulation
ecological economic belt along the Yellow River in Ningxia Hui Autonomous Region
|
|
|
|
Issue Date: 09 May 2025
|
|
|
| [1] |
于德永, 郝蕊芳. 生态系统服务研究进展与展望[J]. 地球科学进展, 2020, 35(8):804-815.
doi: 10.11867/j.issn.1001-8166.2020.069
|
| [1] |
Yu D Y, Hao R F. Research progress and prospect of ecosystem services[J]. Advances in Earth Science, 2020, 35(8):804-815.
doi: 10.11867/j.issn.1001-8166.2020.069
|
| [2] |
杨舒媛, 李子君. 土地利用变化背景下沂河流域生态系统服务价值时空格局演化[J]. 环境科学, 2024. 45(8):4722-4732.
|
| [2] |
Yang S H, Li Z J. Spatio-temporal pattern of ecosystem service value evolution in the Yihe River Basin in the context of land use change[J]. Environmental Science, 2024. 45(8):4722-4732.
|
| [3] |
滑雨琪, 马彩虹, 安斯文, 等. 固原市原州区2000—2018年 "三生" 用地及生态系统服务变化[J]. 水土保持通报, 2021, 41(6):295-302,376.
|
| [3] |
Hua Y Q, Ma C H, An S W, et al. Changes in productive-living-ecological land and ecosystem services in Yuanzhou district of Guyuan City during 2000-2018[J]. Bulletin of Soil and Water Conservation, 2021, 41(6):295-302,376.
|
| [4] |
汪清川, 奚砚涛, 刘欣然, 等. 生态服务价值对土地利用变化的时空响应研究——以徐州市为例[J]. 自然资源遥感, 2021, 33(3):219-228.doi:10.6046/zrzyyg.2020305.
|
| [4] |
Wang Q C, Xi Y T, Liu X R, et al. Spatial-temporal response of ecological service value to land use change:A case study of Xuzhou City[J]. Remote Sensing for Natural Resources, 2021, 33(3):219-228.doi:10.6046/zrzyyg.2020305.
|
| [5] |
李琛, 高彬嫔, 吴映梅, 等. 基于PLUS模型的山区城镇景观生态风险动态模拟[J]. 浙江农林大学学报, 2022, 39(1):84-94.
|
| [5] |
Li C, Gao B P, Wu Y M, et al. Dynamic simulation of landscape ecological risk in mountain towns based on PLUS model[J]. Journal of Zhejiang A & F University, 2022, 39(1):84-94.
|
| [6] |
谭昭昭, 陈毓遒, 丁憬枫, 等. 浙江东部沿海城市土地利用模拟及生态系统服务价值评估[J]. 应用生态学报, 2023, 34(10):2777-2787.
doi: 10.13287/j.1001-9332.202310.025
|
| [6] |
Tan Z Z, Chen Y Q, Ding J F, et al. Simulation of land use and assessment of ecosystem service value in the eastern coastal cities of Zhejiang Province,China[J]. Chinese Journal of Applied Ecology, 2023, 34(10):2777-2787.
|
| [7] |
张春悦, 白永平, 杨雪荻, 等. 多情景模拟下宁夏平原生态系统服务簇识别研究[J]. 地理研究, 2022, 41(12):3364-3382.
doi: 10.11821/dlyj020220289
|
| [7] |
Zhang C Y, Bai Y P, Yang X D, et al. Identification of ecosystem service bundles in Ningxia Plain under multi-scenario simulation[J]. Geographical Research, 2022, 41(12):3364-3382.
|
| [8] |
冯丽媛, 米文宝, 马国庆. 基于CA-Markov模型的宁夏沿黄生态经济带土地利用变化及模拟研究[J]. 水土保持通报, 2019, 39(5):218-222,230,2.
|
| [8] |
Feng L Y, Mi W B, Ma G Q. A study of land use change and simulation of a Ningxia eco-economic belt along Yellow River based on CA-Markov model[J]. Bulletin of Soil and Water Conservation, 2019, 39(5):218-222,230,2.
|
| [9] |
马彩虹, 安斯文, 滑雨琪, 等. 宁夏沿黄经济带生态用地格局演变及其驱动机制[J]. 经济地理, 2022, 42(6):179-187.
doi: 10.15957/j.cnki.jjdl.2022.06.018
|
| [9] |
Ma C H, An S W, Hua Y Q, et al. Evolution and driving mechanism of ecological land use along the yellow economic belt in Ningxia[J]. Economic Geography, 2022, 42(6):179-187.
doi: 10.15957/j.cnki.jjdl.2022.06.018
|
| [10] |
李立, 胡睿柯, 李素红. 基于改进FLUS模型的北京市低碳土地利用情景模拟[J]. 自然资源遥感, 2023, 35(1):81-89.doi:10.6046/zrzyyg.2022065.
|
| [10] |
Li L, Hu R K, Li S H. Simulations of the low-carbon land use scenarios of Beijing based on the improved FLUS model[J]. Remote Sensing for Natural Resources, 2023, 35(1):81-89.doi:10.6046/zrzyyg.2022065.
|
| [11] |
Shi J, Shi P, Wang Z, et al. Multi-scenario simulation and driving force analysis of ecosystem service value in arid areas based on PLUS model:A case study of Jiuquan City,China[J]. Land, 2023, 12(5):937.[LinkOut]
|
| [12] |
耿思筱, 杨志, 党小虎, 等. 基于SD-FLUS模型的宁夏土地利用多情景模拟[J]. 地球科学与环境学报, 2023, 45(4):806-818.
|
| [12] |
Geng S X, Yang Z, Dang X H, et al. Multi-scenarios simulation of Ningxia land use in China based on SD-FLUS model[J]. Journal of Earth Sciences and Environment, 2023, 45(4):806-818.
|
| [13] |
邹利林, 王建英, 胡学东. 中国县级"三生用地" 分类体系的理论构建与实证分析[J]. 中国土地科学, 2018, 32(4):59-66.
|
| [13] |
Zou L L, Wang J Y, Hu X D. An classification systems of production-living-ecological land on the county level:Theory building and empirical research[J]. China Land Science, 2018, 32(4):59-66.
|
| [14] |
Liang X, Guan Q, Clarke K C, et al. Understanding the drivers of sustainable land expansion using a patch-generating land use simulation (PLUS) model:A case study in Wuhan,China[J]. Computers,Environment and Urban Systems, 2021, 85:101569.
|
| [15] |
Hao W, Cao Z, Ou S, et al. A simulation analysis of land use changes in the Yarlung Zangbo River and its two tributaries of Tibet using the Markov-PLUS model[J]. Sustainability, 2023, 15(2):1376.
|
| [16] |
Mokarram M, Pourghasemi H R, Hu M, et al. Determining and forecasting drought susceptibility in southwestern Iran using multi-criteria decision-making (MCDM) coupled with CA-Markov model[J]. Science of the Total Environment, 2021, 781:146703.
|
| [17] |
杨朔, 苏昊, 赵国平. 基于PLUS模型的城市生态系统服务价值多情景模拟——以汉中市为例[J]. 干旱区资源与环境, 2022, 36(10):86-95.
|
| [17] |
Yang S, Su H, Zhao G P. Multi-scenario simulation of urban ecosystem service value based on PLUS model:A case study of Hanzhong city[J]. Journal of Arid Land Resources and Environment, 2022, 36(10):86-95.
|
| [18] |
谢高地, 张彩霞, 张雷明, 等. 基于单位面积价值当量因子的生态系统服务价值化方法改进[J]. 自然资源学报, 2015, 30(8):1243-1254.
|
| [18] |
Xie G D, Zhang C X, Zhang L M, et al. Improvement of the evaluation method for ecosystem service value based on per unit area[J]. Journal of Natural Resources, 2015, 30(8):1243-1254.
doi: 10.11849/zrzyxb.2015.08.001
|
| [19] |
李聪慧, 马彩虹, 滑雨琪, 等. 黄河上游荒漠绿洲生态系统服务对三生用地变化的响应——以银川市为例[J]. 资源科学, 2023, 45(1):190-203.
doi: 10.18402/resci.2023.01.14
|
| [19] |
Li C H, Ma C H, Hua Y Q, et al. Response of desert oasis ecosystem services to the production-living-ecological land change in the upper reaches of the Yellow River:A case study in Yinchuan City[J]. Resources Science, 2023, 45(1):190-203.
doi: 10.18402/resci.2023.01.14
|
| [20] |
崔旺来, 奚恒辉, 蔡莉, 等. 基于NDVI的中国海岛县生态系统服务价值时空变化[J]. 经济地理, 2021, 41(9):184-192,224.
doi: 10.15957/j.cnki.jjdl.2021.09.019
|
| [20] |
Cui W L, Xi H H, Cai L, et al. Spatial and temporal change of ecosystem service value in China's Island Counties base on NDVI[J]. Economic Geography, 2021, 41(9):184-192,224.
doi: 10.15957/j.cnki.jjdl.2021.09.019
|
| [21] |
高超, 赵军, 王玉纯, 等. 石羊河流域自然植被对生态系统服务的约束效应[J]. 生态学报, 2020, 40(9):2851-2862.
|
| [21] |
Gao C, Zhao J, Wang Y C, et al. Study on the constraint effect of natural vegetation on ecosystem services in the Shiyang River Basin[J]. Acta Ecologica Sinica, 2020, 40(9):2851-2862.
|
| [22] |
安斯文, 马彩虹, 袁倩颖, 等. 生态移民区“三生”用地变化对生态系统服务的影响--以宁夏红寺堡区为例[J]. 干旱区地理, 2021, 44(6):1836-1846.
doi: 10.12118/j.issn.1000–6060.2021.06.30
|
| [22] |
An S W, Ma C H, Yuan Q Y, et al. Effects of “ecological-production-living” land changes on ecosystem services in ecological migration area:A case of Hongsibu District in Ningxia[J]. Arid Land Geography, 2021, 44(6):1836-1846.
|
| [23] |
高星, 杨刘婉青, 李晨曦, 等. 模拟多情景下白洋淀流域土地利用变化及生态系统服务价值的空间响应[J]. 生态学报, 2021, 41(20):7974-7988.
|
| [23] |
Gao X, Yang L, Li C X, et al. Land use change and ecosystem service value measurement in Baiyangdian Basin under the simulated multiple scenarios[J]. Acta Ecologica Sinica, 2021, 41(20):7974-7988.
|
| [24] |
杨强强, 章翩, 邱小琮, 等. 宁夏回族自治区生态系统服务时空变化及其权衡研究[J]. 中国环境科学, 2023, 43(10):5453-5465.
|
| [24] |
Yang Q Q, Zhang P, Qiu X C, et al. Spatiotemporal changes and trade-off analysis of ecosystem services in Ningxia Hui Autonomous Region[J]. China Environmental Science, 2023, 43(10):5453-5465.
|
|
Viewed |
|
|
|
Full text
|
|
|
|
|
Abstract
|
|
|
|
|
Cited |
|
|
|
|
| |
Shared |
|
|
|
|
| |
Discussed |
|
|
|
|
 2025,
Vol. 37
2025,
Vol. 37
 ), MA Caihong1(