

0 引言
1 研究区概况及数据源
研究区位于我国黑龙江西北部,大兴安岭南部松岭区(图1)。
图1
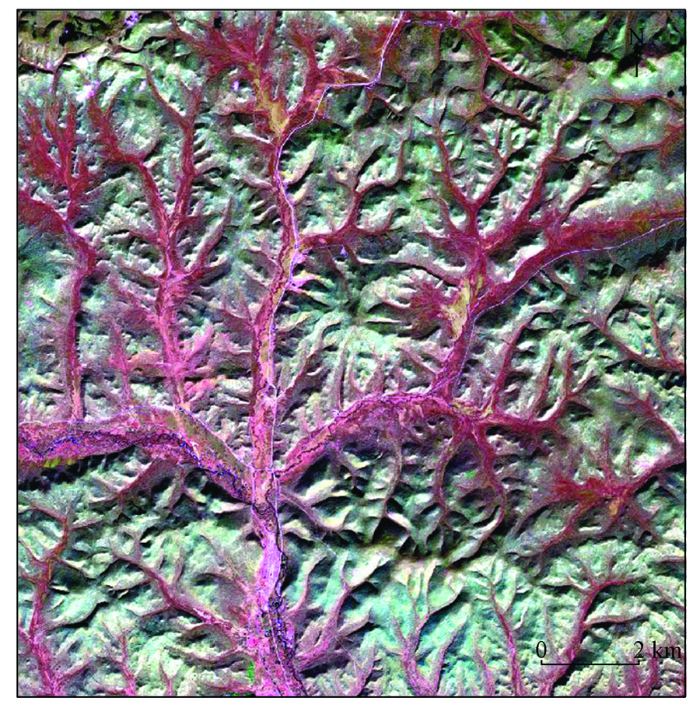
图1
松岭区遥感影像(Landsat8 B7(R),B5(G),B3(B)假彩色合成)
Fig.1
Remote sensing image in Songling
图2
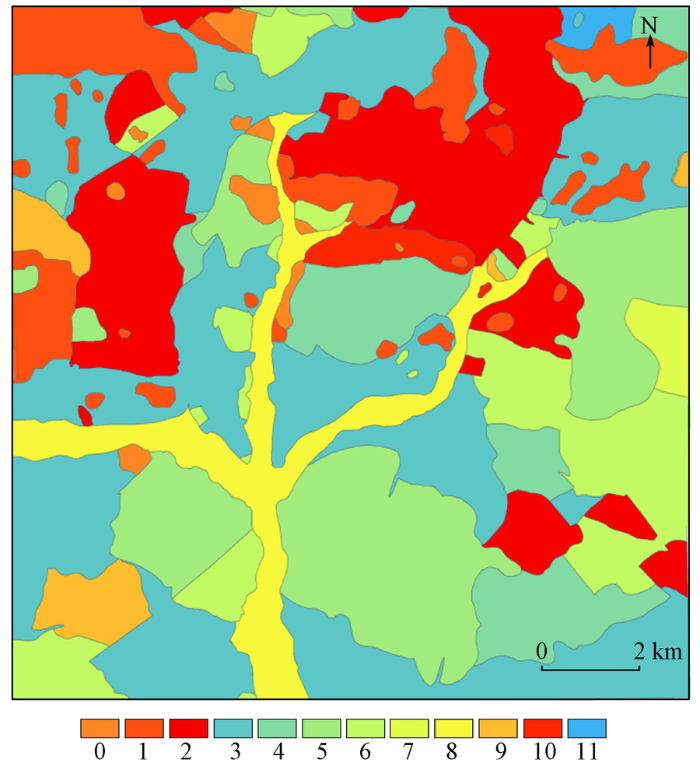
图2
松岭区岩性单元分布
0-未识别岩性; 1-吉祥峰组: 深灰、灰绿色流纹岩和流纹质凝灰岩; 2-正长花岗岩; 3-二长花岗岩; 4- 花岗闪长岩; 5-上库力组: 流纹岩、流纹质凝灰岩、流纹质凝灰熔岩; 6-大网子组: 变英安质熔结凝灰岩、变英安岩、变砂岩; 7-小古里河组: 强片理化流纹岩、流纹质熔岩和凝灰岩; 8-低河漫滩堆积层: 黄褐色砂砾石、砂、粘土和淤泥; 9-碱长花岗岩; 10-石英闪长岩; 11-红水泉组: 变质砾岩、变质砂岩、含早石炭世昆虫
Fig.2
Lithologic unit distribution in Songling
图3
2 地形因子简介
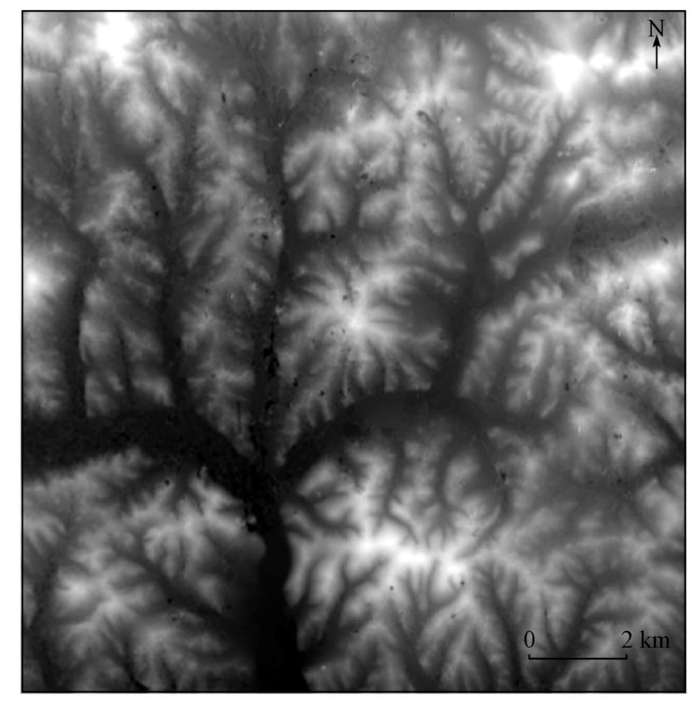
在DEM数据中每个像元的DN值为高程。通过中心像元与邻近像元DN值的运算或一定区域内所有像元DN值的统计,即可得到反映地表地貌特征的各个地形因子参数。本文采用的地形因子参数包括高程、坡度、剖面曲率、平面曲率、纵向曲率、横向曲率、地形起伏度、地表切割深度、地表粗糙度和高程变异系数。其中: ①高程是地面点沿铅垂线到大地水准面的距离; ②坡度反映曲面的倾斜程度,用垂直高差和水平距离的比值表示; ③剖面曲率是对地表曲面在垂直方向上高程变化率的度量; ④平面曲率是对地表曲面在水平方向上扭曲变化的度量; ⑤纵向曲率是沿下坡方向的坡度变化率; ⑥横向曲率是沿下坡方向的垂直方向上的坡度变化率; ⑦地形起伏度是一个特定分析区域内高程最大值和最小值之差; ⑧地表切割深度是一个特定分析区域内高程均值与最小值之差; ⑨地表粗糙度是地形的曲面面积与其在水平面上的投影面积之比,即坡度的余弦值的倒数; ⑩高程变异系数是区域内高程标准差与均值之比[11,12,13]。在实际研究中,经常用因子①—⑥各自的均值来反映非点状要素信息。
3 地形因子的分类有效性评价
在DEM影像上以专家遥感目视解译成果图(图2)为基准划分岩性单元,将各个岩性单元(这一部分不考虑低河漫滩堆积层)的地形因子数据提取或计算出来时,由于地形因子间往往存在着重叠信息并且有些因子区分岩性的效果有一定的相似性,本文首先通过分析地形因子间的相关系数,以及各因子区分岩性的相似性和差异性来对地形因子进行筛选,剔除相关性高、区分岩性效果相似的地形因子,然后深入分析筛选出的地形因子适宜识别区分的岩性。
每一岩性区的地形因子提取分为高程因子提取、微观地形因子提取和宏观地形因子提取3个方面,其中微观地形因子包括坡度、剖面曲率、平面曲率、纵向曲率和横向曲率; 宏观因子包括地形起伏度、地表切割深度、地表粗糙度和高程变异系数。高程因子通过DEM数据直接获取,微观地形因子利用ENVI软件的地形工具获取,再统计高程因子和微观地形因子的均值数据。对于宏观地形因子,地形起伏度由每一岩性区高程的最大值减最小值得到; 地表切割深度由每一岩性区高程的均值减最小值得到; 高程变异系数由每一岩性区高程的标准差与均值的比值得到; 每一岩性区的地表粗糙度表示为
R=[
式中: R为地表粗糙度; slopei为每一像元的坡度; n为分析区域内的总像元数。
表1 各因子的区分情况
Tab.1
| 序号 | 地形因子 | 区分情况① | 分开数量 |
|---|---|---|---|
| 1 | 高程 | (3,11)(5,11)(2,6 7 9 10 11)(6,7 9 11)(9,11)(11,7 10) | 13 |
| 2 | 剖面曲率 | (3,5 7 9)(5,10 11)(1,10 11)(6,10)(9,10 11)(11,7)(10,7) | 12 |
| 3 | 地表切割深度 | (5,6 7 10 11)(1,6 10 11)(4,10)(9,10)(10,7) | 10 |
| 4 | 纵向曲率 | (3,9 10)(5, 10)(1,10)(6,10)(9,10 11)(11,7)(10,7) | 9 |
| 5 | 地表粗糙度 | (3,7)(5, 9)(2,7)(1,7)(4,7)(6,7)(9,7)(11,7)(10,7) | 9 |
| 6 | 坡度 | (3,7)(2,7)(4,7)(6,7)(9,7)(11,7)(10,7) | 7 |
| 7 | 地形起伏度 | (3,10)(5,10)(1,10)(4,10 11)(9,10) | 6 |
| 8 | 高程变异系数 | (3,11)(5,11)(4,11)(9,10 11)(11,7) | 6 |
| 9 | 平面曲率 | (5,10)(1,10 11)(9,10 11) | 4 |
| 10 | 横向曲率 | (5,10)(9,10) | 2 |
①“区分情况”中的数字对应于
从表1中可以看出纵向曲率与剖面曲率对于岩性的区分情况相似,并且纵向曲率能区分开的岩性剖面曲率也几乎都能分开,因此从两者中剔除纵向曲率而选择剖面曲率; 在地表切割深度、坡度、高程变异系数和地形起伏度中,地表切割深度的分开数量最佳,且与其他因子相比能将岩性5,6和7以及岩性1和6分开; 地形起伏度和高程变异系数所能区分开的岩性由高程、剖面曲率和地表切割深度也几乎都能分开,因此选择地表切割深度; 坡度区分岩性的效果与地表粗糙度相似,且能区分开的岩性种类少于地表粗糙度; 此外横向曲率能分开的岩性,平面曲率也能分开,因此剔除横向曲率。最后筛选出用于岩性分类的地形因子为高程、剖面曲率、地表切割深度、地表粗糙度和平面曲率5种。
对于以上筛选出的5个因子根据图4分析每个地形因子适宜识别区分的岩性。
图4
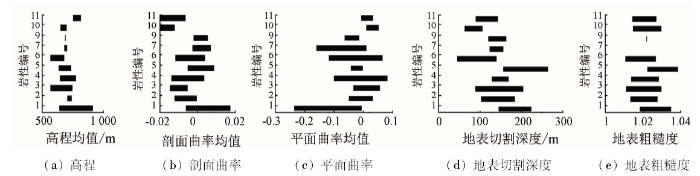
图4
不同岩性的地形因子范围结果图(注: 图中岩性标号对应于
Fig.4
Patterns of topographic variables range of different lithologies
由图可知,高程因子能分开的岩性类别最多,由图4(a)还可以直观看出其对岩性1,2,6,9,11的区分性强,岩性1高程值最大; 岩性11几乎与除了岩性1以外的岩性完全区分开; 岩性2可与岩性6,7,9,10,11区分开; 岩性6与岩性2,7,9,11区分开,与岩性10也只有一点重叠; 岩性9与岩性2,6,11区分开。由图4(b)可以直观看出剖面曲率因子对岩性1,3,10,11的区分性强,相较于其他岩性,岩性1的剖面曲率值最大; 岩性3与岩性5,7,9区分开,且与岩性1和10只有一点重叠; 岩性10可与岩性1,5,6,7,9区分开,与岩性2,3,4也都只有一点重叠; 岩性11可与岩性1,5,7,9区分开。对于平面曲率因子,由图4(c)可以直观看出其对岩性1,10,11的区分性强,岩性1平面曲率值是最小的,岩性1与岩性10,11明显区分开; 岩性10与岩性1,5,9分开,与岩性2,7也只有一点重叠; 岩性11与岩性1,9分开,与岩性5,7也只有一点重叠。对于地表切割深度因子,由图4(d)可以直观看出其对岩性5,6,10的区分性强,岩性5几乎可以与岩性4,6,7,9,10,11区分开; 岩性6与岩性1,5完全分开,与岩性4,7,9也几乎可以分开; 岩性10几乎与岩性1,2,3,4,5,7,9都区分开,另外相比较其他因子其对岩性4的区分力是最好的,岩性4与岩性5,6,10,11都只有一点重叠。对于地表粗糙度因子,由图4(e)可以直观看出其对岩性7的区分性最强,另外岩性5的粗糙度值是所有岩性中最大的,岩性7除了与岩性5有点重叠以外与其余岩性全部区分开; 岩性5与岩性2,3,4,6,11也都只有一点重叠。
基于以上分析可以看出5个地形因子对于岩性分类效果显著,且每类岩性都有其特有的地形因子组合可以将其与其他类岩性区分开。
3.1 地形因子基础数据提取
研究区用于岩性分类的5个地形因子数据都是一定大小区域内的统计数据,可以通过ENVI软件以模板窗口的形式运算得到。由于不同窗口下的地形因子数据不同,因此需要考虑窗口问题,最佳窗口下得到的地形因子能准确反映地形地貌特征,将其用于岩性分类能得到最好的岩性分类效果(表2)。
表2 地形因子的单元大小与均值的对应情况
Tab.2
| 窗口大小 | 面积/(100m2) | 地表切割深度均值/m | 地表粗糙度均值 | 高程均值/m | 平面曲率均值 | 剖面曲率均值 |
|---|---|---|---|---|---|---|
| 3 | 81 | 6.66 | 1.021 182 | 657.775 16 | -0.012 682 | -0.005 103 |
| 11 | 1 089 | 28.60 | 1.021 183 | 657.768 86 | -0.012 759 | -0.005 099 |
| 19 | 3 249 | 45.46 | 1.021 183 | 657.755 86 | -0.012 719 | -0.005 095 |
| 27 | 6 561 | 58.88 | 1.021 183 | 657.736 16 | -0.012 651 | -0.005 104 |
| 35 | 11 025 | 69.81 | 1.021 185 | 657.711 20 | -0.012 465 | -0.005 130 |
| 43 | 16 641 | 78.98 | 1.021 189 | 657.684 66 | -0.012 358 | -0.005 145 |
| 51 | 23 409 | 86.88 | 1.021 194 | 657.658 69 | -0.012 229 | -0.005 155 |
| 67 | 40 401 | 100.14 | 1.021 211 | 657.613 29 | -0.012 155 | -0.005 156 |
| 101 | 91 809 | 121.94 | 1.021 244 | 657.527 59 | -0.012 169 | -0.005 144 |
表3 地形因子的单元大小与地表切割深度均值的对应情况
Tab.3
| 窗口大小 | 面积/(100 m2) | 地表切割深度均值/m |
|---|---|---|
| 3 | 81 | 6.66 |
| 5 | 225 | 12.79 |
| 7 | 441 | 18.45 |
| 9 | 729 | 23.70 |
| 11 | 1 089 | 28.60 |
| 13 | 1 521 | 33.21 |
| 15 | 2 025 | 37.54 |
| 17 | 2 601 | 41.61 |
| 19 | 3 249 | 45.46 |
| 21 | 3 969 | 49.09 |
| 23 | 4 761 | 52.53 |
| 25 | 5 625 | 55.79 |
| 27 | 6 561 | 58.88 |
| 31 | 8 649 | 64.61 |
| 35 | 11 025 | 69.81 |
| 39 | 13 689 | 74.58 |
| 43 | 16 641 | 78.98 |
| 47 | 19 881 | 83.06 |
| 51 | 23 409 | 86.88 |
| 55 | 27 225 | 90.47 |
可以看出地表切割深度均值随窗口的增大在不断地增大,且增大幅度在逐渐减小。
将其拟合为对数方程,即
y=15.454lnx-74.809 , (2)
式中: x为单元面积; y为地表切割深度均值。
图5
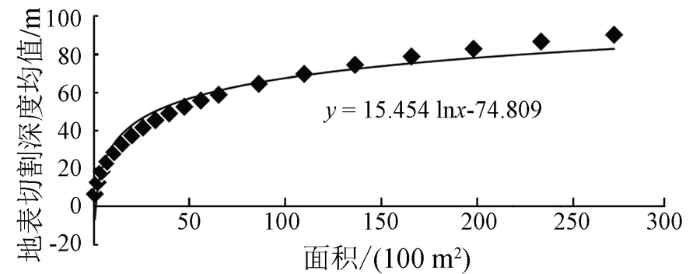
图5
地表切割深度均值与单元面积对应关系拟合曲线
Fig.5
Fitting curve of the average surface cutting depth and the unit area
1)计算不同窗口大小下单位面积上的地表切割深度均值,并对其求对数得到要统计的数列{xK},K=1,…,N,N为样本数。
2)对每个k(k≥2)将样本数列xK分为2段,即x1,x2, …,xK-1和xK,xK+1,…,xN。计算每段样本的算术平均值
3)计算统计量SK和S,其中SK为2段样本的离差平方和之和,S为总的离差平方和。
变点的存在会使整个样本的变量S与样本分段后的变量SK之间的差距增大,最大差值对应的窗口大小即为最佳窗口单元。表4示出均值变点法的统计结果,可以看出当K=9时差值最大,对应的窗口大小为19,因此选用19像元×19像元窗口下的地表切割深度数据作为岩性分类的基础数据。
表4 均值变点法的统计结果
Tab.4
| K | SK | S-SK |
|---|---|---|
| 2 | 12.589 | 3.678 |
| 3 | 9.960 | 6.307 |
| 4 | 8.102 | 8.165 |
| 5 | 6.799 | 9.468 |
| 6 | 5.909 | 10.358 |
| 7 | 5.336 | 10.931 |
| 8 | 5.015 | 11.252 |
| 9 | 4.897 | 11.370 |
| 10 | 4.956 | 11.321 |
| 11 | 5.134 | 11.133 |
| 12 | 5.437 | 10.830 |
| 13 | 5.836 | 10.431 |
| 14 | 6.313 | 9.954 |
| 15 | 7.112 | 9.155 |
| 16 | 8.182 | 8.085 |
| 17 | 9.477 | 6.790 |
| 18 | 10.961 | 5.306 |
| 19 | 12.603 | 3.664 |
| 20 | 14.379 | 1.888 |
3.2 分类研究与对比分析
为了有效地运用地形因子进行岩性分类,采用ISODATA迭代自组织的数据分析方法对研究区进行非监督分类,共分出8类岩石,结果如图6所示。
图6
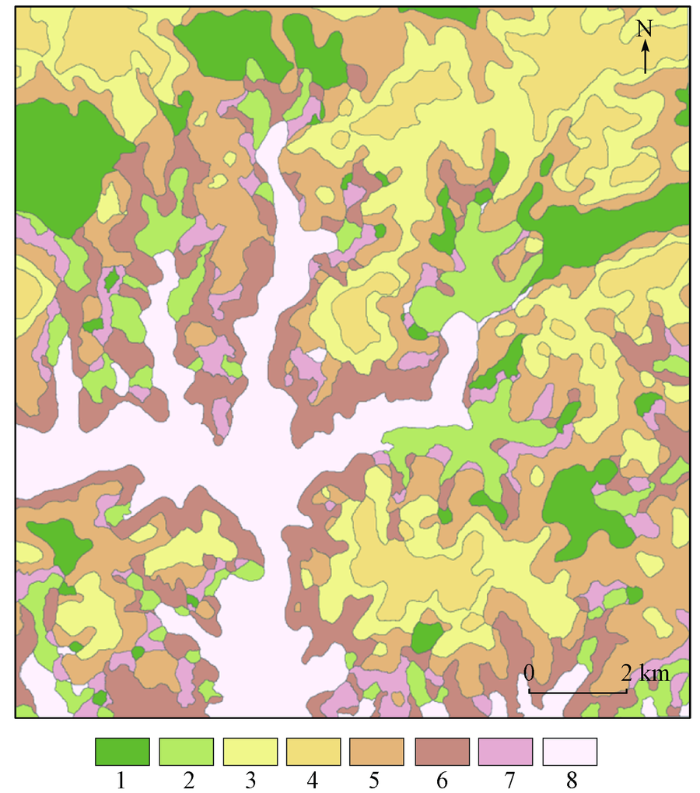
图6
本文方法图像分类结果
1-大网子组: 变英安质熔结凝灰岩、变英安岩、变砂岩; 2-花岗闪长岩; 3-正长花岗岩; 4-吉祥峰组: 深灰、灰绿色流纹岩和流纹质凝灰岩; 5-二长花岗岩; 6-上库力组: 流纹岩、流纹质凝灰岩、流纹质凝灰熔岩; 7-碱长花岗岩; 8-低河漫滩堆积层: 黄褐色砂砾石、砂、粘土和淤泥
Fig.6
Image classification result
表5 岩性单元面积对应情况
Tab.5
| 分布图中 岩性编号 | 分类结果图中岩性编号 | |||||||
|---|---|---|---|---|---|---|---|---|
| 1 | 2 | 3 | 4 | 5 | 6 | 7 | 8 | |
| 1 | 5 949 761 | 2 086 659 | 30 010 953 | 33 918 272 | 18 239 900 | 7 215 781 | 3 493 717 | 2 376 494 |
| 2 | 19 346 740 | 18 394 248 | 58 110 957 | 18 599 059 | 56 231 876 | 23 124 459 | 4 909 170 | 9 350 201 |
| 3 | 48 945 930 | 34 583 857 | 25 967 775 | 10 214 733 | 84 839 723 | 84 188 991 | 32 131 963 | 62 783 966 |
| 4 | 5 626 219 | 9 654 631 | 25 371 820 | 10 171 135 | 30 800 045 | 15 106 756 | 5 931 198 | 1 100 251 |
| 5 | 12 454 452 | 3 169 551 | 55 132 367 | 32 902 075 | 44 977 491 | 39 889 654 | 5 682 589 | 10 919 553 |
| 6 | 16 342 165 | 13 487 423 | 9 719 016 | 0 | 38 424 795 | 13 590 921 | 10 025 250 | 10 328 643 |
| 7 | 0 | 1 206 611 | 2 390 134 | 900 670 | 1 704 757 | 2 589 176 | 1 153 986 | 0 |
| 8 | 787 456 | 5 478 334 | 21 | 0 | 25 523 | 1 213 225 | 526 591 | 80 577 218 |
| 9 | 2 310 757 | 4 577 790 | 4 407 416 | 0 | 8 329 258 | 2 721 464 | 3 564 971 | 0 |
| 10 | 545 952 | 2 520 577 | 3 485 273 | 0 | 5 038 708 | 0 | 2 222 177 | 692 278 |
| 11 | 0 | 0 | 3 416 612 | 3 705 695 | 691 222 | 1 144 187 | 0 | 0 |
表6 岩性单元对应情况
Tab.6
| 分类结果 图中编号 | 对应面积/m2 | 岩性单元分布 图中各类总 面积/m2 | 对应面积占各类 的百分比/% |
|---|---|---|---|
| 1 | 16 342 165.11 | 116 775 952.60 | 13.99 |
| 2 | 9 654 631.46 | 98 813 007.72 | 9.77 |
| 3 | 58 110 957.00 | 218 991 255.80 | 26.54 |
| 4 | 33 918 271.69 | 110 411 638.10 | 30.72 |
| 5 | 84 839 722.93 | 292 867 380.20 | 28.97 |
| 6 | 39 889 653.55 | 197 008 668.20 | 20.25 |
| 7 | 3 564 971.06 | 70 808 773.97 | 5.03 |
| 8 | 80 577 217.73 | 186 747 411.80 | 43.15 |
3.3 精度评价与分析
由表5和表6可知每类岩性都有误分和漏分,但几乎都被识别出来了,只有小古里河组、石英闪长岩和红水泉组没有分出来,原因是这3类岩性区域太小,在分类参数设置时更侧重于使整体分类效果达到最佳,导致有的小区域没有分出来,此外3类岩性都只分布于一小块区域内,可能代表性较差,没能充分表达出其特有的地形地貌特征。区内的第四纪,即低河漫滩堆积层,其高程明显偏低,因此利用高程因子就可以将其分出来,其误分情况严重的主要原因是岩性单元分布图上多以细条的树枝状呈现而被处理到了临近的岩性类中。吉祥峰组岩性的平面曲率偏小而剖面曲率偏大,因而最适宜将其与其他岩性区分开; 此外其高程值在所有岩性中最大。由于一部分上库力组和正长花岗岩岩性的高程值也偏大,因此对于区分吉祥峰组与除了上述2种以外的岩性还可以通过高程因子实现。正长花岗岩的高程值较大,与大部分岩性区分明显。上库力组的地表切割深度与地表粗糙度较大,是将其与其他岩性区分开的最佳因子。从分类结果中可以看出吉祥峰组、上库力组与正长花岗岩3种岩性之间有一定的混淆,主要原因是三者的上述因子值都有一定程度的重叠。二长花岗岩的剖面曲率偏小,因此将其与其他岩性区分开的效果最佳。对于大网子组,其高程和地表切割深度值都偏小,因此这2个因子为将其区分出来的最佳因子。从分类结果中还可以看出二长花岗岩与大网子组岩性混淆严重主要是因二者5个地形因子值都有一定程度的重叠。对于花岗闪长岩,地表切割深度因子是将其与其他岩性区分开的最佳因子,但是可以看出分类图上花岗闪长岩分类精度很低,主要是其在5个地形因子值上与其他岩性都有一定的重叠。对于碱长花岗岩,地表粗糙度因子将其区分出来的效果最佳,但是其分类的误分和漏分情况都比较严重,原因可能是其在研究区内岩性区范围较小。
4 结论
1)以研究区30 m空间分辨率的DEM数据为基础提取地形因子,通过比较分析地形因子区分岩性的有效性,得出地形因子中高程、剖面曲率、平面曲率、地表切割深度和地表粗糙度5个因子都有其最适宜识别区分的岩性,将5种因子用于岩性分类,得到的分类结果中主要岩性区均能被识别出来。
2)研究结果表明岩性与地形因子间存在一定的相关性,主要的岩性类都有其特有的地形特征都可以通过一定的地形因子组合而被识别出来。因此加入地形因子参数会明显提高岩性的识别能力,这也为有植被覆盖的岩性区解译精度的提高提供了一种可能。为了深入研究各类岩性的地形特征从而进一步提高岩性的解译精度,还需挖掘岩性的更多地形信息,因此下一步需要研究更多的地形因子。
参考文献
运用LANDSAT ETM+和ASTER数据进行岩性分类
[J].本文评价了运用ASTER和LANDSAT ETM+数据进行岩性制图的性能。分别利用ASTER数据不同波段区图像及其组合,以及ETM+数据进行岩性分类,并探讨了将ASTER和ETM+数据叠加在一起进行了岩性分类; 利用现有地质图对所有分类结果进行了定量评价。结果表明,ASTER数据不同波段的岩性识别能力不同,并且较ETM+数据能更准确地识别岩性。更重要的是,把ASTER与ETM+数据结合在一起进行岩性分类,可获得比用任一数据单独分类更高的分类精度,表明二者的光谱特征具有一定的互补性。
Lithologic mapping using LANDSAT ETM+ and ASTER data
[J].
水系提取方法研究及其地质意义
[D].
The Research of Drainage Extraction Method and Its Geological Significance
[D].
基于光谱指数的遥感影像岩性分类
[J].
Lithologic classification from remote sensing images based on spectral index
[J].
基于地统计学的图像纹理在岩性分类中的应用
[J].纹理是遥感图像的重要特征,它揭示了图像中辐射亮度值空间变化的重要信息。本文运用地统计学中的对数变差函数计算图像纹理,并与图像的光谱信息结合,进行图像岩性分类,分析了不同大小窗口纹理信息对分类精度的影响。结果表明,运用地统计学原理进行图像分类,可大大提高图像的分类精度;采用较大窗口提取的纹理信息参与分类能使总体分类精度提高,但某些岩性类的分类精度有所下降,建议在实际应用中,根据具体情况选择窗口的大小。
The application of geostatistical image texture to remote sensing lithological classification
[J].
基于最佳地形因子组合的地貌形态类型划分研究
[D].
Classification of Relief Form Based on the Best Terrain Factor Combination
[D].
最佳因子复合的四川省地貌类型自动划分
[J].
DOI:10.3969/j.issn.1673-2944.2009.04.015
URL
[本文引用: 1]

地貌本身所固有的结构是可以通过计算机自动识别和分类的.从地形图等高线生成的DEM中分别提取反映地貌形态信息的9个地形因子,综合考虑标准差、相关系 数、OIF指数等,筛选出适于四川全省地貌类型划分的5个最佳因子进行复合,运用遥感图像自动分类原理中非监督分类功能完成了四川省地貌类型的自动划分. 这是由对地貌形态特征的定性描述到定量描述.
Automatic classification of landform types in Sichuan Province with the optimum factors complex
[J].
基于ASTER图像和地形因子的岩性单元分类——以新疆木垒地区为例
[J].
DOI:10.3724/SP.J.1047.2011.00825
URL
Magsci
[本文引用: 1]
利用遥感图像进行岩性分类,是遥感地质应用的重要方面之一.本文运用ASTER DEM提取地形因子,并与原始的光谱图像相结合用于遥感图像的岩性单元分类.文章分析了不同尺度的地形因子对岩性单元分类的作用,并进一步分析和比较各种地形因子对岩性单元分类的作用.结果表明,在岩性单元分类过程中加入不同的地形因子可不同程度地提高岩性单元分类精度,加入DEM信息,可得到更高的分类精度.将地形信息和光谱信息综合,是一种有效 的岩性单元分类方法,尤其是对植被覆盖区域.
Lithologic unit mapping using ASTER data and topographic variables:A case study of Mulei area of XinJiang
[J].
Lithological mapping of the Troodos ophiolite,Cyprus,using airborne LiDAR topographic data
[J].
DOI:10.1016/j.rse.2009.11.006
URL
[本文引用: 1]
Traditional field-based lithological mapping can be a time-consuming, costly and challenging endeavour when large areas need to be investigated, where terrain is remote and difficult to access and where the geology is highly variable over short distances. Consequently, rock units are often mapped at coarse-scales, resulting in lithological maps that have generalised contacts which in many cases are inaccurately located. Remote sensing data, such as aerial photographs and satellite imagery are commonly incorporated into geological mapping programmes to obtain geological information that is best revealed by overhead perspectives. However, spatial and spectral limitations of the imagery and dense vegetation cover can limit the utility of traditional remote sensing products. The advent of Airborne Light Detection And Ranging (LiDAR) as a remote sensing tool offers the potential to provide a novel solution to these problems because accurate and high-resolution topographic data can be acquired in either forested or non-forested terrain, allowing discrimination of individual rock types that typically have distinct topographic characteristics. This study assesses the efficacy of airborne LiDAR as a tool for detailed lithological mapping in the upper section of the Troodos ophiolite, Cyprus. Morphometric variables (including slope, curvature and surface roughness) were derived from a 4 m digital terrain model in order to quantify the topographic characteristics of four principal lithologies found in the area. An artificial neural network (the Kohonen Self-Organizing Map) was then employed to classify the lithological units based upon these variables. The algorithm presented here was used to generate a detailed lithological map which defines lithological contacts much more accurately than the best existing geological map. In addition, a separate map of classification uncertainty highlights potential follow-up targets for ground-based verification. The results of this study demonstrate the significant potential of airborne LiDAR for lithological discrimination and rapid generation of detailed lithological maps, as a contribution to conventional geological mapping programmes.
Integrating airborne multispectral imagery and airborne LiDAR data for enhanced lithological mapping in vegetated terrain
[J].
DOI:10.1016/j.rse.2010.08.019
URL
[本文引用: 1]
Practical and financial constraints associated with traditional field-based lithological mapping are often responsible for the generation of maps with insufficient detail and inaccurately located contacts. In arid areas with well exposed rocks and soils, high-resolution multi- and hyperspectral imagery is a valuable mapping aid as lithological units can be readily discriminated and mapped by automatically matching image pixel spectra to a set of reference spectra. However, the use of spectral imagery in all but the most barren terrain is problematic because just small amounts of vegetation cover can obscure or mask the spectra of underlying geological substrates. The use of ancillary information may help to improve lithological discrimination, especially where geobotanical relationships are absent or where distinct lithologies exhibit inherent spectral similarity. This study assesses the efficacy of airborne multispectral imagery for detailed lithological mapping in a vegetated section of the Troodos ophiolite (Cyprus), and investigates whether the mapping performance can be enhanced through the integration of LiDAR-derived topographic data. In each case, a number of algorithms involving different combinations of input variables and classification routine were employed to maximise the mapping performance. Despite the potential problems posed by vegetation cover, geobotanical associations aided the generation of a lithological map with a satisfactory overall accuracy of 65.5% and Kappa of 0.54 using only spectral information. Moreover, owing to the correlation between topography and lithology in the study area, the integration of LiDAR-derived topographic variables led to significant improvements of up to 22.5% in the overall mapping accuracy compared to spectral-only approaches. The improvements were found to be considerably greater for algorithms involving classification with an artificial neural network (the Kohonen Self-Organizing Map) than the parametric Maximum Likelihood Classifier. The results of this study demonstrate the enhanced capability of data integration for detailed lithological mapping in areas where spectral discrimination is complicated by the presence of vegetation or inherent spectral similarities.
Multivariate image texture by multivariate variogram for multispectral image classification
[J].
DOI:10.1007/s00190-008-0251-8
URL
[本文引用: 1]
Traditional image texture measure usually allows a texture description of a single band of the spectrum, characterizing the spatial variability of gray-level values within the single-band image. A problem with the approach while applied to multispectral images is that it only uses the texture information from selected bands. In this paper, we propose a new multivariate texture measure based on ...
数字高程模型在地表过程研究中的应用
[J].
Application of digital elevation model to surficial process research
[J].
数字地形分析的理论、方法与应用
[J].
Digital terrain analysis:Theory, method and application
[J].
基于SRTM-DEM的我国地势起伏度统计单元研究
[J].
Statistical unit of relief amplitude in China based on SRTM-DEM
[J].
基于ArcGIS的望谟河流域地势起伏度分析
[J].
DOI:10.3969/j.issn.1672-3007.2015.04.002
URL
[本文引用: 1]
地势起伏度的研究对中小尺度流域的滑坡、泥石流等地质灾害的敏感性分析和危险性评价具有重要的理论意义和实际应用价值。以山洪地质灾害频发的望谟河流域为研究区,基于ArcGIS平台以望谟河流域1∶1万的DEM为基础数据,采用窗口分析法和均值变点分析法,利用Python模块编程自动提取和计算望谟河流域地势起伏度的最佳统计单元,并对望谟河流域的地势起伏度进行分析。结果表明:望谟河流域地势起伏度最佳统计单元的面积是1.49 km^2,地势起伏度在0~648.23 m之间;中部河网密集区起伏度大,流域边缘起伏度小;流域地貌属于小起伏山地,以切割高地和切割山地为主,土壤侵蚀较严重。
Analysis of ArcGIS-based relief amplitude of the Wangmo River watershed in Guizhou
[J].
