Please wait a minute...
 
国土资源遥感  2018, Vol. 30 Issue (2): 231-237    DOI: 10.6046/gtzyyg.2018.02.31
     技术应用 本期目录 | 过刊浏览 | 高级检索 |
基于DEM的地形因子分析与岩性分类
王婷(), 潘军(), 蒋立军, 邢立新, 于一凡, 王鹏举
吉林大学地球探测科学与技术学院,长春 130026
Topographic variable analysis and lithologic classification based on DEM
Ting WANG(), Jun PAN(), Lijun JIANG, Lixin XING, Yifan YU, Pengju WANG
College of Geoexploration Science and Technology, Jilin University, Changchun 130026, China
全文: PDF(2903 KB)   HTML  
输出: BibTeX | EndNote (RIS)      
摘要 

地形因子作为对地形地貌特征进行数字表达的定量参数,对岩性识别精度的提高具有重要的意义。在对已知岩性类别区域的高程、坡度、剖面曲率、地表粗糙度和地表切割深度等10个地形因子的分类有效性和相关性进行评价的基础上,对地形因子进行筛选并将最佳尺度下的地形因子用于岩性的分类。结果表明,高程、剖面曲率、地表切割深度、地表粗糙度和平面曲率这5个地形因子的组合更具良好的分类效果,且都对应有识别性最好的岩性。在识别岩性类别时加入充分表达其地形特征的最佳地形因子组合有利于提高岩性的识别与分类能力。

服务
把本文推荐给朋友
加入引用管理器
E-mail Alert
RSS
作者相关文章
王婷
潘军
蒋立军
邢立新
于一凡
王鹏举
关键词 地质岩性分类地形地貌地形因子均值变点分析非监督分类    
Abstract

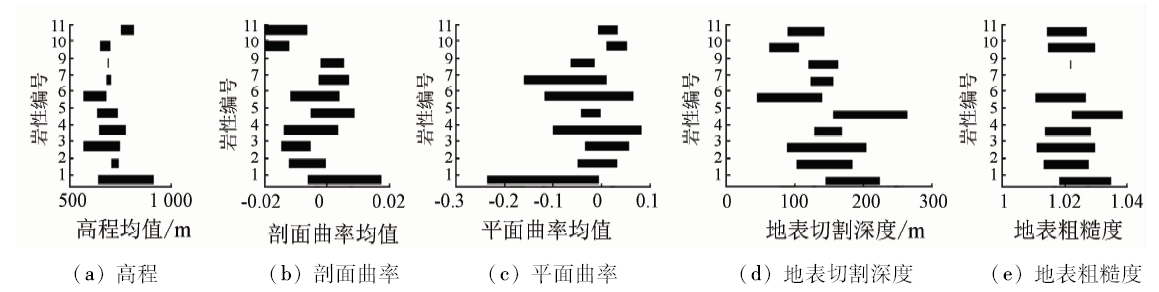
Lithologic identification and classification can provide important basic information for regional geological survey and mineral resource exploration. Topographic variables constitute the quantitative parameters of digital expression for topography, and are very important in improving the accuracy. Based on the classification validity and correlation of 10 topographic variables such as elevation, slope, profile curvature, surface roughness, and surface cutting depth in the known lithologic area, the authors screened the topographic variables and used the variables under the best scale for the classification of lithology. The result shows that the combination of elevation, profile curvature, surface cutting depth, surface roughness and plane curvature is very useful and, in terms of the capability of identification, each variable has the corresponding lithology. The adding of the best terrain variables combination to fully express terrain characteristics in identifying each type of lithology is helpful to improving the recognition and classification of lithology.

Key wordsgeological lithology classification    topography    topographic variables    mean change point analysis    unsupervised classification
收稿日期: 2017-04-06      出版日期: 2018-05-30
:  TP75  
基金资助:中国地质调查局地质调查项目“内蒙古望峰公社1∶5万区调遥感地质信息提取方法技术研究”(编号: 3R114Z184423)
通讯作者: 潘军
引用本文:   
王婷, 潘军, 蒋立军, 邢立新, 于一凡, 王鹏举. 基于DEM的地形因子分析与岩性分类[J]. 国土资源遥感, 2018, 30(2): 231-237.
Ting WANG, Jun PAN, Lijun JIANG, Lixin XING, Yifan YU, Pengju WANG. Topographic variable analysis and lithologic classification based on DEM. Remote Sensing for Land & Resources, 2018, 30(2): 231-237.
链接本文:  
https://www.gtzyyg.com/CN/10.6046/gtzyyg.2018.02.31      或      https://www.gtzyyg.com/CN/Y2018/V30/I2/231
Fig.1  松岭区遥感影像(Landsat8 B7(R),B5(G),B3(B)假彩色合成)
Fig.2  松岭区岩性单元分布
0-未识别岩性; 1-吉祥峰组: 深灰、灰绿色流纹岩和流纹质凝灰岩; 2-正长花岗岩; 3-二长花岗岩; 4- 花岗闪长岩; 5-上库力组: 流纹岩、流纹质凝灰岩、流纹质凝灰熔岩; 6-大网子组: 变英安质熔结凝灰岩、变英安岩、变砂岩; 7-小古里河组: 强片理化流纹岩、流纹质熔岩和凝灰岩; 8-低河漫滩堆积层: 黄褐色砂砾石、砂、粘土和淤泥; 9-碱长花岗岩; 10-石英闪长岩; 11-红水泉组: 变质砾岩、变质砂岩、含早石炭世昆虫
Fig.3  松岭区 DEM影像
序号 地形因子 区分情况 分开数量
1 高程 (3,11)(5,11)(2,6 7 9 10 11)(6,7 9 11)(9,11)(11,7 10) 13
2 剖面曲率 (3,5 7 9)(5,10 11)(1,10 11)(6,10)(9,10 11)(11,7)(10,7) 12
3 地表切割深度 (5,6 7 10 11)(1,6 10 11)(4,10)(9,10)(10,7) 10
4 纵向曲率 (3,9 10)(5, 10)(1,10)(6,10)(9,10 11)(11,7)(10,7) 9
5 地表粗糙度 (3,7)(5, 9)(2,7)(1,7)(4,7)(6,7)(9,7)(11,7)(10,7) 9
6 坡度 (3,7)(2,7)(4,7)(6,7)(9,7)(11,7)(10,7) 7
7 地形起伏度 (3,10)(5,10)(1,10)(4,10 11)(9,10) 6
8 高程变异系数 (3,11)(5,11)(4,11)(9,10 11)(11,7) 6
9 平面曲率 (5,10)(1,10 11)(9,10 11) 4
10 横向曲率 (5,10)(9,10) 2
Tab.1  各因子的区分情况
Fig.4  不同岩性的地形因子范围结果图(注: 图中岩性标号对应于图2的岩性编号)
窗口大小 面积/(100m2) 地表切割深度均值/m 地表粗糙度均值 高程均值/m 平面曲率均值 剖面曲率均值
3 81 6.66 1.021 182 657.775 16 -0.012 682 -0.005 103
11 1 089 28.60 1.021 183 657.768 86 -0.012 759 -0.005 099
19 3 249 45.46 1.021 183 657.755 86 -0.012 719 -0.005 095
27 6 561 58.88 1.021 183 657.736 16 -0.012 651 -0.005 104
35 11 025 69.81 1.021 185 657.711 20 -0.012 465 -0.005 130
43 16 641 78.98 1.021 189 657.684 66 -0.012 358 -0.005 145
51 23 409 86.88 1.021 194 657.658 69 -0.012 229 -0.005 155
67 40 401 100.14 1.021 211 657.613 29 -0.012 155 -0.005 156
101 91 809 121.94 1.021 244 657.527 59 -0.012 169 -0.005 144
Tab.2  地形因子的单元大小与均值的对应情况
窗口大小 面积/(100 m2) 地表切割深度均值/m
3 81 6.66
5 225 12.79
7 441 18.45
9 729 23.70
11 1 089 28.60
13 1 521 33.21
15 2 025 37.54
17 2 601 41.61
19 3 249 45.46
21 3 969 49.09
23 4 761 52.53
25 5 625 55.79
27 6 561 58.88
31 8 649 64.61
35 11 025 69.81
39 13 689 74.58
43 16 641 78.98
47 19 881 83.06
51 23 409 86.88
55 27 225 90.47
Tab.3  地形因子的单元大小与地表切割深度均值的对应情况
Fig.5  地表切割深度均值与单元面积对应关系拟合曲线
K SK S-SK
2 12.589 3.678
3 9.960 6.307
4 8.102 8.165
5 6.799 9.468
6 5.909 10.358
7 5.336 10.931
8 5.015 11.252
9 4.897 11.370
10 4.956 11.321
11 5.134 11.133
12 5.437 10.830
13 5.836 10.431
14 6.313 9.954
15 7.112 9.155
16 8.182 8.085
17 9.477 6.790
18 10.961 5.306
19 12.603 3.664
20 14.379 1.888
Tab.4  均值变点法的统计结果
Fig.6  本文方法图像分类结果
1-大网子组: 变英安质熔结凝灰岩、变英安岩、变砂岩; 2-花岗闪长岩; 3-正长花岗岩; 4-吉祥峰组: 深灰、灰绿色流纹岩和流纹质凝灰岩; 5-二长花岗岩; 6-上库力组: 流纹岩、流纹质凝灰岩、流纹质凝灰熔岩; 7-碱长花岗岩; 8-低河漫滩堆积层: 黄褐色砂砾石、砂、粘土和淤泥
分布图中
岩性编号
分类结果图中岩性编号
1 2 3 4 5 6 7 8
1 5 949 761 2 086 659 30 010 953 33 918 272 18 239 900 7 215 781 3 493 717 2 376 494
2 19 346 740 18 394 248 58 110 957 18 599 059 56 231 876 23 124 459 4 909 170 9 350 201
3 48 945 930 34 583 857 25 967 775 10 214 733 84 839 723 84 188 991 32 131 963 62 783 966
4 5 626 219 9 654 631 25 371 820 10 171 135 30 800 045 15 106 756 5 931 198 1 100 251
5 12 454 452 3 169 551 55 132 367 32 902 075 44 977 491 39 889 654 5 682 589 10 919 553
6 16 342 165 13 487 423 9 719 016 0 38 424 795 13 590 921 10 025 250 10 328 643
7 0 1 206 611 2 390 134 900 670 1 704 757 2 589 176 1 153 986 0
8 787 456 5 478 334 21 0 25 523 1 213 225 526 591 80 577 218
9 2 310 757 4 577 790 4 407 416 0 8 329 258 2 721 464 3 564 971 0
10 545 952 2 520 577 3 485 273 0 5 038 708 0 2 222 177 692 278
11 0 0 3 416 612 3 705 695 691 222 1 144 187 0 0
Tab.5  岩性单元面积对应情况
分类结果
图中编号
对应面积/m2 岩性单元分布
图中各类总
面积/m2
对应面积占各类
的百分比/%
1 16 342 165.11 116 775 952.60 13.99
2 9 654 631.46 98 813 007.72 9.77
3 58 110 957.00 218 991 255.80 26.54
4 33 918 271.69 110 411 638.10 30.72
5 84 839 722.93 292 867 380.20 28.97
6 39 889 653.55 197 008 668.20 20.25
7 3 564 971.06 70 808 773.97 5.03
8 80 577 217.73 186 747 411.80 43.15
Tab.6  岩性单元对应情况
[1] 余海阔, 李培军 . 运用LANDSAT ETM+和ASTER数据进行岩性分类[J]. 岩石学报, 2010,26(1):345-351.
Yu H K, Li P J . Lithologic mapping using LANDSAT ETM+ and ASTER data[J]. Acta Petrologica Sinica, 2010,26(1):345-351.
[2] 王晓东 . 水系提取方法研究及其地质意义[D]. 长春:吉林大学, 2015.
Wang X D . The Research of Drainage Extraction Method and Its Geological Significance[D]. Changchun:Jinlin University, 2015.
[3] 于亚凤, 杨金中, 陈圣波 , 等. 基于光谱指数的遥感影像岩性分类[J]. 地球科学, 2015,40(8):1415-1419.
Yu Y F, Yang J Z, Chen S B , et al. Lithologic classification from remote sensing images based on spectral index[J]. Earth Science, 2015,40(8):1415-1419.
[4] 黄颖端, 李培军, 李争晓 . 基于地统计学的图像纹理在岩性分类中的应用[J]. 国土资源遥感, 2003,15(3):45-49.doi: 10.6046/gtzyyg.2003.03.11
doi: 10.3969/j.issn.1001-070X.2003.03.011
Huang Y D, Li P J, Li Z X . The application of geostatistical image texture to remote sensing lithological classification[J]. Remote Sensing for Land and Resources, 2003,15(3):45-49.doi: 10.6046/gtzyyg.2003.03.11
[5] 曾德耀 . 基于最佳地形因子组合的地貌形态类型划分研究[D]. 重庆:重庆交通大学, 2015.
Zeng D Y . Classification of Relief Form Based on the Best Terrain Factor Combination[D]. Chongqing:Chongqing Jiaotong University, 2015.
[6] 杨晏立, 何政伟, 杨斌 , 等. 最佳因子复合的四川省地貌类型自动划分[J].陕西理工学院学报(自然科学版)2009, 25(4):74-79.
doi: 10.3969/j.issn.1673-2944.2009.04.015
Yang Y L, He Z W, Yang B , et al. Automatic classification of landform types in Sichuan Province with the optimum factors complex[J].Journal of Shaanxi University of Technology(Natural Science Edition)2009, 25(4):74-79.
[7] 姜莎莎, 李培军 . 基于ASTER图像和地形因子的岩性单元分类——以新疆木垒地区为例[J]. 地球信息科学学报, 2011,13(6):825-832.
doi: 10.3724/SP.J.1047.2011.00825
Jiang S S, Li P J . Lithologic unit mapping using ASTER data and topographic variables:A case study of Mulei area of XinJiang[J]. Journal of Geo-Information Science, 2011,13(6):825-832.
[8] Grebby S, Cunningham D, Naden J , et al. Lithological mapping of the Troodos ophiolite,Cyprus,using airborne LiDAR topographic data[J]. Remote Sensing of Environment, 2010,114(4):713-724.
doi: 10.1016/j.rse.2009.11.006
[9] Grebby S, Naden J, Cunningham D , et al. Integrating airborne multispectral imagery and airborne LiDAR data for enhanced lithological mapping in vegetated terrain[J]. Remote Sensing of Environment, 2011,115(1):214-226.
doi: 10.1016/j.rse.2010.08.019
[10] Li P J, Cheng T, Guo J C . Multivariate image texture by multivariate variogram for multispectral image classification[J]. Photogrammetric Engineering and Remote Sensing, 2009,75(2):147-157.
doi: 10.1007/s00190-008-0251-8
[11] 周启明, 刘学军 . 数字地形分析[M]. 北京: 科学出版社, 2006: 52-75.
Zhou Q M, Liu X J. Digital Terrain Analysis[M]. Beijing: Science Press, 2006: 52-75.
[12] 刘少峰, 王陶, 张会平 , 等. 数字高程模型在地表过程研究中的应用[J]. 地学前缘, 2005,12(1):303-309.
Liu S F, Wang T, Zhang H P , et al. Application of digital elevation model to surficial process research[J]. Earth Science Frontiers, 2005,12(1):303-309.
[13] 杨昕, 汤国安, 刘学军 , 等. 数字地形分析的理论、方法与应用[J]. 地理学报, 2009,64(9):1058-1070.
Yang X, Tang G A, Liu X J , et al. Digital terrain analysis:Theory, method and application[J]. Acta Geographica Sinica, 2009,64(9):1058-1070.
[14] 赵斌滨, 程永锋, 丁士君 , 等. 基于SRTM-DEM的我国地势起伏度统计单元研究[J]. 水利学报, 2015,46(s1):284-290.
Zhao B B, Cheng Y F, Ding S J , et al. Statistical unit of relief amplitude in China based on SRTM-DEM[J]. Journal of Hydraulic Engineering, 2015,46(s1):284-290.
[15] 高蜻, 唐丽霞, 谷晓平 , 等. 基于ArcGIS的望谟河流域地势起伏度分析[J]. 中国水土保持科学, 2015,13(4):9-14.
doi: 10.3969/j.issn.1672-3007.2015.04.002
Gao Q, Tang L X, Gu X P , et al. Analysis of ArcGIS-based relief amplitude of the Wangmo River watershed in Guizhou[J]. Science of Soil and Water Conservation, 2015,13(4):9-14.
[1] 李亚平, 卢小平, 张航, 路泽忠, 王舜瑶. 基于GIS和RUSLE的淮河流域土壤侵蚀研究——以信阳市商城县为例[J]. 国土资源遥感, 2019, 31(4): 243-249.
[2] 戴晨曦, 谢相建, 徐志刚, 杜培军. 中草药材种植遥感监测与分析——以云南省文山和红河地区三七种植为例[J]. 国土资源遥感, 2018, 30(1): 210-216.
[3] 付天举, 许昱苹, 安添琳, 乔占明. 地形因子流程化提取的模型描述与方法研究[J]. 国土资源遥感, 2015, 27(4): 62-67.
[4] 白淑英, 吴奇, 史建桥, 顾海敏. 青藏高原积雪深度时空分布与地形的关系[J]. 国土资源遥感, 2015, 27(4): 171-178.
[5] 张洁, 梁明剑, 邵延秀. 基于Openness可视化参数的二维地貌显示[J]. 国土资源遥感, 2015, 27(3): 172-176.
[6] 李娜, 赵慧洁. 高光谱数据非监督分类的改进独立成分分析方法[J]. 国土资源遥感, 2011, 23(2): 70-74.
[7] 于海洋, 甘甫平, 党福星. 高分辨率遥感影像波段配准误差试验分析[J]. 国土资源遥感, 2007, 19(3): 39-42.
[8] 刘修国, 罗小波. 自组织神经网络在遥感影像分类中的应用研究[J]. 国土资源遥感, 2004, 16(4): 14-18.
Viewed
Full text


Abstract

Cited

  Shared   
  Discussed   
京ICP备05055290号-2
版权所有 © 2015 《自然资源遥感》编辑部
地址:北京学院路31号中国国土资源航空物探遥感中心 邮编:100083
电话:010-62060291/62060292 E-mail:zrzyyg@163.com
本系统由北京玛格泰克科技发展有限公司设计开发