

0 引言
LUCC自动更新的通用技术是首先利用变化检测方法获得变化/非变化的像元; 再选择非变化的像元对后期待更新影像进行分类器训练,并对后期影像中变化的像元进行重分类; 未变化像元则直接继承原始分类影像的类别,以此实现LUCC的更新过程[6]。Xian等[7,8]首次结合变化检测方法,使用2001年的LUCC分类数据自动更新出2006年的LUCC情况,该方法先使用变化矢量分析(change vector analysis,CVA)算法检测出变化/未变化像元,再利用决策树分类(decision tree classification,DTC)方法重新对变化像元进行分类。应用CVA-DTC方法自动更新LUCC时,需要2景获取时间为同一物候期的影像,且自动化更新程度较低,限制了该方法的应用; Jin等[9]提出多特征指数集成的综合变化检测方法(comprehensive change detection method,CCDM ),首先提取多种特征指数用于检测变化信息,然后结合现有的知识系统进一步更新变化/未变化像元,但该过程复杂并需要一定的知识或经验作为参考; Chen等[10]提出利用后验概率变化矢量分析(change vector analysis in posterior probability space,CVAPS)进行LUCC自动更新,该方法将原始影像的光谱空间转换为后验概率空间,实现了对另一期影像分类图的自动更新,并取得了较好效果。然而,CVAPS并没有考虑到遥感影像各波段之间和多时相之间的光谱相关性,因而可能会造成信息丢失[11]。多元变化检测(multivariate change detection,MAD)算法是另一种变化检测技术,能够将多波段的变化信息集中体现在少数波段中,从而最大限度地消除了多波段影像间的相关性,特别适用于多时相影像的变化检测[12]。因此,在前人研究基础上,本文综合发挥CVAPS与MAD的优势,提出改进CVAPS的LUCC自动更新技术,通过改善像元的变化检测精度,增强LUCC分类自动更新过程中训练样本的可靠性,提高LUCC分类自动更新的精度。为减少分类图中“椒盐”噪声的影响,本文进一步利用迭代马尔科夫随机场(iterative Markov random field,IR-MRF)模型进行分类后的空间邻域处理,以提高自动更新的精度。
1 技术方法
改进CVAPS的LUCC自动更新方法主要包括3大步骤: ①确定变化/未变化像元; ②采用迭代法选择样本进行重分类; ③采用IR-MRF 去除噪声。在检测变化时,首先利用CVAPS确定变化/未变化像元,然后利用MAD方法更新变化/未变化像元,提高检测未变化像元的精度,以便在迭代分类中高精度地选取未变化像元。考虑到像元的空间邻域相关特征,对每次的迭代分类结果进行IR-MRF后处理,去除类似“椒盐”的噪声现象。具体技术流程见图1。
图1
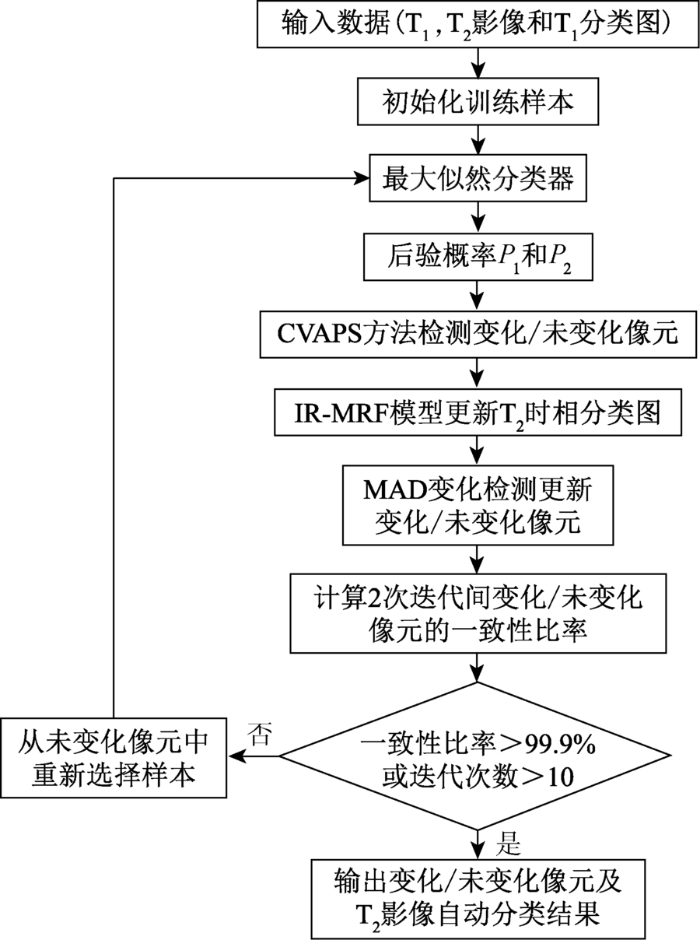
在初始化训练样本时,将时相T1的所有像元作为训练样本输入。由于最大似然分类器(max-likelihood calssifer,MLC)能够输出像元属于不同类别的后验概率,本文以MLC分类器为例进行相关实验。从图1 的自动更新流程中可以看出,本文方法主要涉及多时相影像的变化检测、训练样本选择以及影像的IR-MRF后处理3个主要技术环节。
1.1 多元变化检测
MAD是一种以典型相关分析为基础、以方差最大化为判断准则的多元变化检测技术。该方法利用2个时相各波段之间的典型相关结构将2组多元变量变换成1组新的多元变量,并按原始变量之间的相关性大小重新分配; 同时构造出变化差异变量,最大限度地检测出变化信息。如果将2个时相的多波段遥感影像视为2组多元随机变量,则可引入MAD变化检测方法,对2组随机变量进行典型相关分析。经MAD变换后,可大大降低2景影像各波段间的相关性,增强变化信息并抑制噪声,有利于进一步的信息提取和地学分析[13]。
假设2景不同时相的影像为X和Y,波段数分别为p和q,E(X)和E(Y)为期望值,E(X)=0,E(Y)=0,p≤q。使用2组线性组合系数向量a和b,分别构造2个线性组合,即
aTX=a1X1+…+apXp , (1)
bTY=b1Y1+…+bqYq , (2)
其中X=
d=aTX-bTY 。 (3)
MAD变化检测法就是以离差d作为衡量变化信息的测度,将d的方差最大化作为判断准则,即满足max(Var{aTX-bTY}),在单位方差约束条件下Var{aTX}=Var{bTY}=1。
Var{aTX-bTY}=Var{aTX}+Var{bTY}-2Cov{aTX,bTY}=2(1-Corr{aTX,bTY})。 (4)
MADi=
式中P为自由度。
MAD近似符合高斯正态分布,对MAD变量的平方标准化后的Tj则服从自由度为P的χ2分布[13],即
Tj=
ρi=Corr{aTX,bTY} , (8)
式中
1.2 样本自动选择
LUCC自动更新的关键是对影像中的变化像元进行重分类,前提是准确地确定影像在需更新时期内的变化与非变化像元,以便从非变化的像元中选取合适的样本用于后期影像的重分类。本文采取的策略是利用CVAPS检测出初始的变化/未变化像元,再结合MAD变化检测结果来更新未变化像元,从而确定未变化区域。由于需要从未变化的像元中选择样本,而单次变化检测的精度会直接影响样本的选择,从而影响再分类的精度。为此,本文引入迭代条件模型(iterated conditional model,ICM)自动选择未变化像元的样本,并根据2次迭代间变化/未变化像元的一致性比率确定迭代是否终止。具体的步骤如下:
1)利用T1时相的参考分类图初始化训练样本Ω=C1,C1为已知的参考分类图。
2)采用MLC分类器以初始样本Ω分别对T1和T2时相影像进行分类,同时获取2个时相的后验概率矢量P1和P2。
3)采用自动化阈值选取方法对后验概率变化矢量自动选取阈值,确定2个时相间的变化像元Θc和未变化像元Θu,这里应用直方图熵的方法自动选取阈值[16]。
4)使用IR-MRF模型更新T2时相分类图,消除变化区域中的“椒盐”现象,并更新变化像元Θcm和未变化像元Θum。
5)应用MAD算法检测T1与T2时相间的变化/未变化像元,结合步骤4中的检测结果对未变化像元进行逻辑并运算,更新2个时相间未变化像元,用于下次迭代选取样本。
6)从未变化像元中选择样本,执行步骤1—5的操作,直至2次迭代过程中变化与未变化像元趋于稳定,一致性比率大于99.9%; 最后输出T2时相的分类影像。一致性比率的定义为
pconsistence=
式中: nunchange和nchange 分别为2次迭代过程中都不变化和都变化的像元数; N为像元总数; pconsistence为2次迭代过程中的一致性比率。
1.3 IR-MRF模型后处理
MRF模型考虑了相邻像元间的空间相关特征,因而可以提高影像自动更新的精度。本文采用二阶8邻域系统N(i,j)来定义MRF模型,像元(i,j)属于类别Cl的概率由该像元的光谱信息和其邻域像元所决定[17],即
P[Cl(i,j)]=
式中: Z为归一化常数; Ucontext和Uspect分别为像元(i,j)处的邻域能量函数和光谱能量函数,即
Uspect[Cl(i,j)]=-ln{pspect[Cl(i,j)]} , (11)
Ucontext计算式为
Ucontext[Cl(i,j)]=Ucontext{
δk[Cl(i,j),Cl(g,h)]=
式中β为邻域像元信息的权重系数,一般取值为1.6[10]。
在使用MRF模型对迭代分类结果进行后处理时,利用IR-ICM可进一步优化分类效果,大大减少分类结果中的影像噪声,提高区域连续性。其基本计算步骤如下:
1)对分类结果及每个像元的后验概率进行初始化,按照式(12)计算每个像元属于类别Cl的最大概率,即最小邻域和光谱能量。
2)按照像元所在最大概率时的类别编码更新输入的分类结果。
3)重复步骤1和2,直到2次迭代间类别一致性比率大于99.9%或者迭代次数超过10为止。
2 实验研究
2.1 研究区与实验数据
为了测试和对比所提方法的有效性,选取覆盖福建省长汀县为研究区。研究区位于E115°59'~116°39',N25°18'~26°02'之间,东西宽66 km,南北长80 km,面积共3 090 km2。长汀县的植被覆盖率为60%,森林结构单一,林下植被稀疏; 常有大雨暴雨,降水强度大,水土流失较为严重; 主要地表覆盖类型为植被、居民地、农田、水体和裸地等。
图2
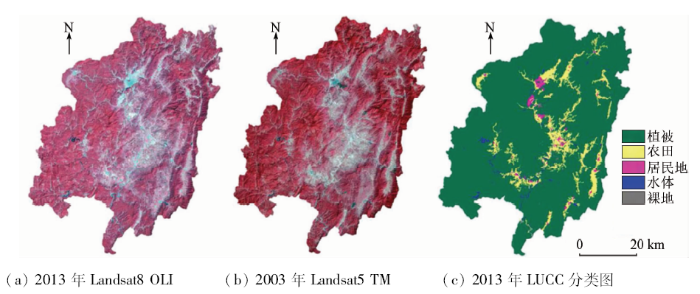
图2
研究区原始遥感影像及参考分类图
Fig.2
Original remote sensing images and references classification map of study area
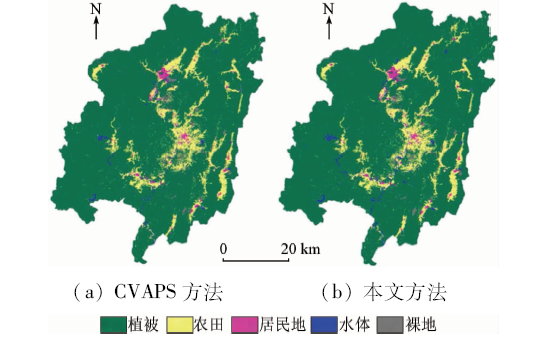
2.2 分类结果自动更新
图3
Tab.1 Samples for precision evaluation of change detection and classification(个)
| 地表覆盖类别 | 变化像元 | 未变化像元 | 样本总量 |
|---|---|---|---|
| 植被 | 784 | 1 292 | 2 076 |
| 农田 | 710 | 351 | 1 061 |
| 水体 | 0 | 412 | 412 |
| 居民地 | 52 | 490 | 542 |
| 裸地 | 763 | 189 | 952 |
| 合计 | 2 309 | 2 734 | 5 043 |
表2 CVAPS分类混淆矩阵
Tab.2
| 分类类别 | 参考类别 | 合计 | 用户精度/ % | ||||
|---|---|---|---|---|---|---|---|
| 植被 | 农田 | 水体 | 居民地 | 裸地 | |||
| 植被 | 1 494 | 89 | 5 | 9 | 137 | 1 734 | 86.16 |
| 农田 | 6 | 779 | 0 | 31 | 105 | 921 | 84.58 |
| 水体 | 0 | 0 | 401 | 0 | 7 | 408 | 98.28 |
| 居民地 | 0 | 96 | 0 | 501 | 1 | 598 | 83.78 |
| 裸地 | 576 | 97 | 6 | 1 | 702 | 1 382 | 50.80 |
| 合计 | 2 076 | 1 061 | 412 | 542 | 952 | 5 043 | |
| 制图精度/ % | 71.96 | 73.42 | 97.33 | 92.44 | 73.74 | ||
| 总体精度= 76.76%,Kappa = 0.691 | |||||||
表3 本文方法分类混淆矩阵
Tab.3
| 分类类别 | 参考类别 | 合计 | 用户精度/ % | ||||
|---|---|---|---|---|---|---|---|
| 植被 | 农田 | 水体 | 居民地 | 裸地 | |||
| 植被 | 1 608 | 88 | 5 | 9 | 115 | 1 825 | 88.10 |
| 农田 | 6 | 795 | 6 | 31 | 90 | 928 | 85.67 |
| 水体 | 0 | 0 | 395 | 0 | 6 | 401 | 98.50 |
| 居民地 | 0 | 81 | 0 | 501 | 0 | 582 | 86.08 |
| 裸地 | 462 | 97 | 6 | 1 | 741 | 1 307 | 56.70 |
| 合计 | 2 076 | 1 061 | 412 | 542 | 952 | 5 043 | |
| 制图精度/ % | 77.46 | 74.93 | 95.88 | 92.44 | 77.84 | ||
| 总体精度= 80.11%,Kappa = 0.733 | |||||||
从表2和表3可以看出,CVAPS方法自动更新分类的总体精度和Kappa系数分别为76.76%和0.691,而本文方法的分类总体精度达到80.11%,Kappa系数为0.733,比CVAPS方法分别提高了近3.4%和0.04。从表3中可以看出,水体因其光谱稳定,分类精度最高,用户精度达到了98.50%; 植被和农田因二者具有相似的光谱特征而造成了一定的误分,用户精度分别为88.10%和85.67%; 由于2003年长汀县的水土流失现象较为严重,部分植被因水土流失变成极易与裸地混淆的低密度稀疏植被,因此裸地的自动更新分类精度仅仅在50%左右。对照表2和表3可以看出,本文方法对裸地的分类精度较CVAPS方法有较大改善,其分类精度由50.80%提高到56.70%。
3 结果分析与讨论
由图1示出的技术流程可知,本文方法主要涉及以下3个方面问题: ①所采用的变化检测方法不同; ②迭代样本选择不一致; ③后处理的方式不同。对上述3方面问题对LUCC自动更新的影响进一步分析。
3.1 变化检测
图4分别示出MAD方法、CVAPS法和本文方法对2个时相变化像元的检测结果(红色部分代表变化像元)。
图4
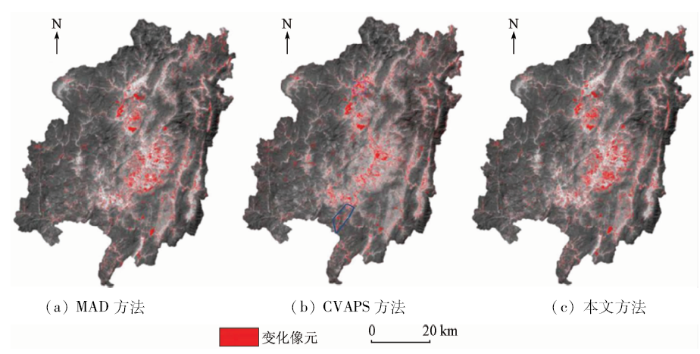
从图4(a)可以看出,MAD方法能够检测出新建的居民地、道路和部分火烧迹地等变化。图4(b)中CVAPS方法检测的长汀县城和沿汀江两岸的变化像元(蓝色框内)明显是错误的。在长汀县城内,地物并没有发生明显的变化,而CVAPS方法却将居民地内部区域检测为变化像元; 对于沿汀江两岸,2003年与2013年的土地覆盖类型都是植被,并没有土地覆盖类型的变化。图4(c)中的检测结果则明显避免了4(b)中的错误,并且对道路和火烧迹地的变化检测也很准确,这表明在CVAPS自动更新的模型中引入MAD的变化检测技术对提高模型的自动更新精度具有重要意义。为了定量评价上述3种方法的变化检测精度,同样利用表1中的样本数据,计算各方法变化/未变化像元检测结果的精度(表4—6)。从表中可以看出,本文方法综合了CVAPS方法和MAD方法的优势,将总体精度和Kappa系数
表4 MAD变化/未变化像元检测结果
Tab.4
| 像元数量 | 真实结果 | ||||
|---|---|---|---|---|---|
| 未变化像元 | 变化像元 | 合计 | 错分误差/% | ||
| 分类结果 | 未变化像元 | 2 272 | 462 | 2 734 | 16.90 |
| 变化像元 | 399 | 1 910 | 2 309 | 17.28 | |
| 合计 | 2 671 | 2 372 | 5 043 | ||
| 漏分误差/% | 14.94 | 19.48 | |||
| 总体精度= 82.92%, Kappa= 0.656 | |||||
表5 CVAPS变化/未变化像元检测结果
Tab.5
| 像元数量 | 真实结果 | ||||
|---|---|---|---|---|---|
| 未变化像元 | 变化像元 | 合计 | 错分误差/% | ||
| 分类结果 | 未变化像元 | 2 701 | 33 | 2 734 | 1.21 |
| 变化像元 | 911 | 1 398 | 2 309 | 39.45 | |
| 合计 | 3 612 | 1 431 | 5 043 | ||
| 漏分误差/% | 25.22 | 2.30 | |||
| 总体精度= 81.28%, Kappa=0 .611 | |||||
表6 本文方法变化/未变化像元检测结果
Tab.6
| 像元数量 | 真实结果 | ||||
|---|---|---|---|---|---|
| 未变化像元 | 变化像元 | 合计 | 错分误差/% | ||
| 分类结果 | 未变化像元 | 2 287 | 447 | 2 734 | 16.35 |
| 变化像元 | 365 | 1 944 | 2 309 | 15.81 | |
| 合计 | 2 652 | 2 391 | 5 043 | ||
| 漏分误差/% | 13.76 | 18.69 | |||
| 总体精度= 83.90%, Kappa= 0.674 | |||||
分别提高到83.90%和0.674,总体精度比CVAPS提高了近2.6%,Kappa系数提高了近0.06。表5表明,CVAPS方法的未变化像元检测精度比较高,而变化像元的检测精度较低,这可能与该方法仅仅利用后验概率迭代选择未变化像元有关。由于影像中的变化像元数量通常远小于未变化像元的检测数量,较低的变化像元的检测精度直接导致了迭代过程中的未变化像元在自动选择样本过程中逐渐累积,造成分类过程中变化/未变化像元数量的不均衡和检测精度的降低。表4表明,MAD方法中的变化/未变化像元检测精度比较均衡。因此,本文利用MAD方法在每次算法迭代之前通过逻辑运算更新了未变化像元,可以保持变化/未变化像元数量在迭代过程中的动态均衡性,因而最终检测出的变化/未变化像元的错分和漏分误差都相对较低,从而有效提取出了地表变化信息。
3.2 迭代样本选择
在影像自动迭代分类中,每次迭代都需要更新影像中变化/未变化像元的分布以及分类结果,本文设置的迭代终止条件是邻近2次迭代过程中变化/未变化像元的一致性比率大于99.9%。由于迭代次数对变化/未变化像元以及分类结果都会造成显著影响,因而需要分析本文方法和CVPAS的迭代次数与一致性比率以及变化检测和自动分类精度评价指标之间的关系(图5)。
图5
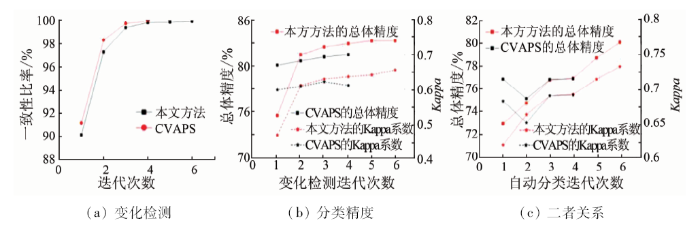
图5(a)表明,本文方法通过6次迭代,而CVAPS经过4次迭代,它们的一致性比率均超过了99.9%。从图5(b)可以看出,本文方法第一次迭代时的变化检测总体精度只有74.62%,经6次迭代之后提升到83.90%; 相应地,Kappa系数也从0.466提高到0.674,相比CVAPS变化检测的总体精度和Kappa系数分别提高了近1.5%和0.05。图5(c)为迭代次数与自动更新分类结果的总体精度和Kappa系数的关系,从该图可以看出,本文方法随着迭代次数的增加,总体精度和Kappa系数也逐渐提高,总体精度从72.92%提高到80.11%,Kappa系数从0.617提高到0.733; 与CVAPS方法相比,总体精度提升了近4%,而Kappa系数也提高了约0.04。因此,本文的自动迭代选择样本技术可以较显著地提升影像自动更新过程中变化检测和分类的精度。
3.3 IR-MRF分类后处理
为了提高影像分类的空间一致性效果,减少影像分类结果中产生的“斑点”或“椒盐”噪声,本文进一步利用IR-MRF模型进行分类后的空间邻域处理,以提高自动更新的精度。图6 是采取和未采取IR-MRF模型自动更新结果的局部对比。
图6
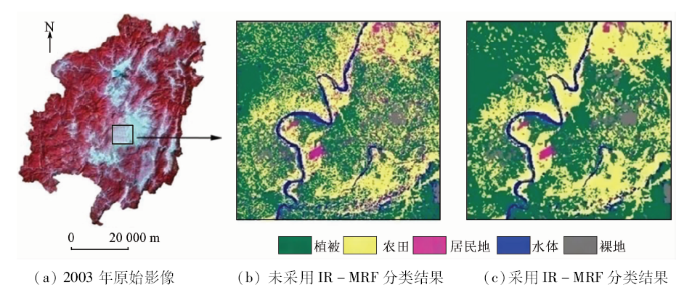
图6
IR-MRF模型改进自动更新分类的结果
Fig.6
Result of automatic updating and classification improved by IR-MRF model
图7
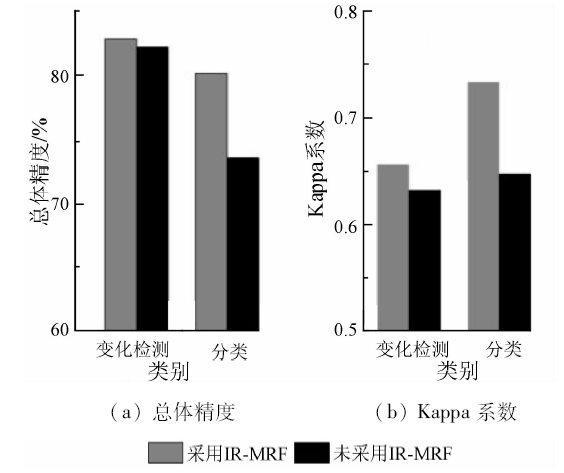
图7
采用/未采用IR-MRF模型的精度对比直方图
Fig.7
Histogram for precision comparison between IR-MRF model used and unused
4 结论
1)本文发展了一种基于CVAPS和IR-MRF的LUCC自动更新方法,主要包括多时相影像的变化检测、训练样本选择及影像的IR-MRF后处理3个主要技术环节。
2)针对LUCC自动更新的关键(即对变化像元重分类),本文方法综合了CVAPS与MAD变化检测的优势,同时引入ICM模型对未变化像元进行分类更新,能够有效提高变化检测结果精度。
3)基于2013年长汀县的参考分类影像对2003年的TM影像进行土地利用类型自动更新实验,实现了长汀县LUCC的自动更新。结果表明,本文方法的变化检测结果的总体精度为83.90%,Kappa系数为0.674,分别比CVAPS提高了近2.6%和0.06; 自动更新的分类结果显示,本文方法的总体精度达到80.11%,Kappa系数为0.733,比传统CVAPS的分类结果分别提高了近3.4%和0.04。
参考文献
Land-Use and Land-Cover Change Science/Research Plan
[R].
全球环境变化研究的核心领域——土地利用/土地覆被变化的国际研究动向
[J].
A review of the international researches on land use/land cover change
[J].
土地利用动态变化研究方法探讨
[J].
DOI:10.3969/j.issn.1007-6301.1999.01.012
URL
Magsci
[本文引用: 1]

本文从全球变化的研究热点--“土地利用/土地覆盖变化”的涵义及研究内容出发,概括分析了土地利用变化研究的方法-土地利用变化模型的建立,阐述了各类模型的涵义及在土地利用变化研究中的意义,并重点介绍了定量研究土地利用动态变化的几种模型-(1)土地资源数量变化模型;(2)土地资源生态背景质量变化模型;(3)土地利用程度变化模型;(4)土地利用变化区域差异模型;(5)土地利用空间变化模型;(6)土地需求量预测模型。
Study on the methods of land use dynamic change research
[J].
Global land-use/land-cover change:Towards an integrated study
[J].
DOI:10.1080/02786829408959678
URL
[本文引用: 1]
Human actions are altering the terrestrial environment at unprecedented rates, magnitudes, and spatial scales. Land-cover change stemming from human land uses represents a major source and a major element of global environmental change. Not only are the global-level data on land-use and land-cover change relatively poor, but we need a much better understanding of the underlying driving forces for these changes. Many forces have been proposed as significant, but single-factor explanations of land transformation have proved to be inadequate. How the human causes interact, and under what circumstances each is important, are questions needing systematic research. An international and interdisciplinary agenda is currently being developed to address these issues, through several closely-connected foci of study. A division of the world according to common situations of environment, human driving forces, and land-cover dynamics will be followed by detailed study of the processes at work within each situation. The results will form the basis for a concurrent effort to develop a global land model that can offer projections of patterns of land transformation.
遥感影像变化检测方法综述及展望
[J].
DOI:10.3969/j.issn.1000-3177.2011.01.023
URL
[本文引用: 1]
变化检测技术是遥感应用领域的一个重要研究方向。本文首先对常见的变化检测方法进行了概括性介绍与优缺点评述,并分析了当前变化检测方法中存在的普遍问题;并在此基础上,展望了一种基于影像分割的变化检测方法:在仅对其中一个时相影像进行分割的基础上,建立了两时相影像间的对应图斑单元与变化判别规则,实现图斑单元间的直接比较来提取变化信息。并分析了基于分割的变化检测方法与像素级变化检测方法相比具有的优势。
A summary on current techniques and prospects of remote sensing change detection
[J].
An automated approach for updating land cover maps based on integrated change detection and classification methods
[J].
DOI:10.1016/j.isprsjprs.2012.05.006
URL
[本文引用: 1]
Updating land cover maps from remotely sensed data in a timely manner is important for many areas of scientific research. Unfortunately, traditional classification procedures are very labor intensive and subjective because of the required human interaction. Based on the strategy of updating land cover data only for the changed area, we proposed an integrated, automated approach to update land cover maps without human interaction. The proposed method consists primarily of the following three parts: a change detection technique, a Markov Random Fields (MRFs) model, and an iterated training sample selecting procedure. In the proposed approach, remotely sensed data acquired in different seasons or from different remote sensors can be used. Meanwhile, the approach is completely unsupervised. Therefore, the methodology has a wide scope of application. A case study of Landsat data was conducted to test the performance of this method. The experimental results show that several sub-modules in this method work effectively and that reasonable classification accuracy can be achieved.
national land cover database land cover classification to 2006 by using Landsat imagery change detection methods
[J].
DOI:10.1016/j.rse.2009.02.004
URL
[本文引用: 1]
The recent release of the U.S. Geological Survey (USGS) National Land Cover Database (NLCD) 2001, which represents the nation's land cover status based on a nominal date of 2001, is widely used as a baseline for national land cover conditions. To enable the updating of this land cover information in a consistent and continuous manner, a prototype method was developed to update land cover by an individual Landsat path and row. This method updates NLCD 2001 to a nominal date of 2006 by using both Landsat imagery and data from NLCD 2001 as the baseline. Pairs of Landsat scenes in the same season in 2001 and 2006 were acquired according to satellite paths and rows and normalized to allow calculation of change vectors between the two dates. Conservative thresholds based on Anderson Level I land cover classes were used to segregate the change vectors and determine areas of change and no-change. Once change areas had been identified, land cover classifications at the full NLCD resolution for 2006 areas of change were completed by sampling from NLCD 2001 in unchanged areas. Methods were developed and tested across five Landsat path/row study sites that contain several metropolitan areas including Seattle, Washington; San Diego, California; Sioux Falls, South Dakota; Jackson, Mississippi; and Manchester, New Hampshire. Results from the five study areas show that the vast majority of land cover change was captured and updated with overall land cover classification accuracies of 78.32%, 87.5%, 88.57%, 78.36%, and 83.33% for these areas. The method optimizes mapping efficiency and has the potential to provide users a flexible method to generate updated land cover at national and regional scales by using NLCD 2001 as the baseline.
Updating the 2001 national land cover database impervious surface products to 2006 using Landsat imagery change detection methods
[J].
DOI:10.1016/j.rse.2010.02.018
URL
[本文引用: 1]
A prototype method was developed to update the U.S. Geological Survey (USGS) National Land Cover Database (NLCD) 2001 to a nominal date of 2006. NLCD 2001 is widely used as a baseline for national land cover and impervious cover conditions. To enable the updating of this database in an optimal manner, methods are designed to be accomplished by individual Landsat scene. Using conservative change thresholds based on land cover classes, areas of change and no-change were segregated from change vectors calculated from normalized Landsat scenes from 2001 and 2006. By sampling from NLCD 2001 impervious surface in unchanged areas, impervious surface predictions were estimated for changed areas within an urban extent defined by a companion land cover classification. Methods were developed and tested for national application across six study sites containing a variety of urban impervious surface. Results show the vast majority of impervious surface change associated with urban development was captured, with overall RMSE from 6.86 to 13.12% for these areas. Changes of urban development density were also evaluated by characterizing the categories of change by percentile for impervious surface. This prototype method provides a relatively low cost, flexible approach to generate updated impervious surface using NLCD 2001 as the baseline.
A comprehensive change detection method for updating the national land cover database to circa 2011
[J].
DOI:10.1016/j.rse.2013.01.012
URL
[本文引用: 1]
The importance of characterizing, quantifying, and monitoring land cover, land use, and their changes has been widely recognized by global and environmental change studies. Since the early 1990s, three U.S. National Land Cover Database (NLCD) products (circa 1992, 2001, and 2006) have been released as free downloads for users. The NLCD 2006 also provides land cover change products between 2001 and 2006. To continue providing updated national land cover and change datasets, a new initiative in developing NLCD 2011 is currently underway. We present a new Comprehensive Change Detection Method (CCDM) designed as a key component for the development of NLCD 2011 and the research results from two exemplar studies. The CCDM integrates spectral-based change detection algorithms including a Multi-Index Integrated Change Analysis (MIICA) model and a novel change model called Zone, which extracts change information from two Landsat image pairs. The MIICA model is the core module of the change detection strategy and uses four spectral indices (CV, RCVMAX, dNBR, and dNDVI) to obtain the changes that occurred between two image dates. The CCDM also includes a knowledge-based system, which uses critical information on historical and current land cover conditions and trends and the likelihood of land cover change, to combine the changes from MIICA and Zone. For NLCD 2011, the improved and enhanced change products obtained from the CCDM provide critical information on location, magnitude, and direction of potential change areas and serve as a basis for further characterizing land cover changes for the nation. An accuracy assessment from the two study areas show 100% agreement between CCDM mapped no-change class with reference dataset, and 18% and 82% disagreement for the change class for WRS path/row p22r39 and p33r33, respectively. The strength of the CCDM is that the method is simple, easy to operate, widely applicable, and capable of capturing a variety of natural and anthropogenic disturbances potentially associated with land cover changes on different landscapes.
Change vector analysis in posterior probability space:A new method for land cover change detection
[J].
DOI:10.1109/LGRS.2010.2068537
URL
[本文引用: 2]
Postclassification comparison (PCC) and change vector analysis (CVA) have been widely used for land use/cover change detection using remotely sensed data. However, PCC suffers from error cumulation stemmed from an individual image classification error, while a strict requirement of radiometric consistency in remotely sensed data is a bottleneck of CVA. This letter proposes a new method named CVA in posterior probability space (CVAPS), which analyzes the posterior probability by using CVA. The CVAPS approach was applied and validated by a case study of land cover change detection in Shunyi District, Beijing, China, based on multitemporal Landsat Thematic Mapper data. Accuracies of “change/no-change” detection and “from-to” types of change were assessed. The results show that error cumulation in PCC was reduced in CVAPS. Furthermore, the main drawbacks in CVA were also alleviated effectively by using CVAPS. Therefore, CVAPS is potentially useful in land use/cover change detection.
基于多元统计分析的遥感影像变化检测方法研究
[D].
Change Detection in Remotely Sensed Imagery Using Multivariate Statistical Analysis
[D].
基于典型相关分析的变化检测中变化阈值的确定
[J].
DOI:10.3321/j.issn:1007-4619.2004.05.011
URL
Magsci
[本文引用: 1]
以东营市为例 ,把基于典型相关分析的方法运用于多时相遥感影像的变化检测中。对于变化阈值的确定 ,采用了一种基于贝叶斯理论的最小错误率的方法。这种方法实质上是一种非监督分类的方法 ,即不需要地面实况数据或其它先验知识 ,直接对典型相关处理后的差值图像进行分析计算得到阈值 ,使变化检测的错误率达到最小。实验结果证明了这种方法的有效性。
Determination of threshold in change detection based on canonical correlation analysis
[J].
基于典型相关分析的多元变化检测
[J].
DOI:10.11834/jrs.20000307
Magsci
[本文引用: 2]
通过对传统变化检测方法存在不足的分析, 引进典型相关分析的基础理论, 将不同时相的多通道遥感数据视为分组的多元随机变量, 利用典型变换进行遥感数据的多元变化检测。实验结果表明, 所提出的M变换方法用于多时相、多通道遥感影像的变化检测具有明显的优势和应用前景。
Multivariate change detection based on canonical transformation
[J].
Multivariate alteration detection(MAD) and MAF postprocessing in multispectral,bitemporal image data:New approaches to change detection studies
[J].
DOI:10.1016/S0034-4257(97)00162-4
URL
[本文引用: 1]
This paper introduces a new orthogonal transformation, the multivariate alteration detection (MAD) transformation, based on an established multivariate statistical technique canonical correlation analysis. The theory for canonical correlation analysis is sketched and a result necessary for the definition of the MAD transformation is proven. As opposed to traditional univariate change detection schemes our scheme transforms two sets of multivariate observations (e.g. two multispectral satellite images covering the same geographical area acquired at different points in time) into a difference between two linear combinations of the original variables explaining maximal change (i.e. the difference explaining maximal variance) in all variables simultaneously. The MAD transformation is invariant to linear scaling. The MAD transformation can be used iteratively. First, it can be used to detect outliers (such as drop-outs) or noise and in a second iteration, it can be used to perform the actual change detection after appropriate action on outliers or noise. Also, if an analyst has additional information such as geographical position of certain changes of interest that show up in certain bands only, our method can be applied to any spatial and/or spectral subset of the full data set to direct the analysis in any desired manner. In order to obtain a spatially more coherent representation of the detected change as obtained from the MAD analysis, post-processing by means of a minimum/maximum autocorrelation factor (MAF) transformation of the MAD variates can be performed. Whereas the traditionally used principal component (PC) transformation optimizes the data variance in each new component the MAF transformation optimizes the autocorrelation represented by each component. This post-processing introduces a new spatial element into our change detection scheme which is highly relevant for image data. Two case studies using multispectral SPOT HRV data from 5 February 1987 and 12 February 1989 covering coffee and pineapple plantations in central Kenya, and Landsat TM data from 6 June 1986 and 27 June 1988 covering a forested region in northern Sweden show the usefulness of these new concepts. Because of their ability to detect change in many channels simultaneously, the MAD transformation and the MAF post-processing are expected to be even more useful when applied to image data with more bands.
The regularized iteratively reweighted MAD method for change detection in multi-and hyperspectral data
[J].
DOI:10.1109/TIP.2006.888195
URL
PMID:17269639
[本文引用: 1]
This paper describes new extensions to the previously published multivariate alteration detection (MAD) method for change detection in bi-temporal, multi- and hypervariate data such as remote sensing imagery. Much like boosting methods often applied in data mining work, the iteratively reweighted (IR) MAD method in a series of iterations places increasing focus on "difficult" observations, here observations whose change status over time is uncertain. The MAD method is based on the established technique of canonical correlation analysis: for the multivariate data acquired at two points in time and covering the same geographical region, we calculate the canonical variates and subtract them from each other. These orthogonal differences contain maximum information on joint change in all variables (spectral bands). The change detected in this fashion is invariant to separate linear (affine) transformations in the originally measured variables at the two points in time, such as 1) changes in gain and offset in the measuring device used to acquire the data, 2) data normalization or calibration schemes that are linear (affine) in the gray values of the original variables, or 3) orthogonal or other affine transformations, such as principal component (PC) or maximum autocorrelation factor (MAF) transformations. The IR-MAD method first calculates ordinary canonical and original MAD variates. In the following iterations we apply different weights to the observations, large weights being assigned to observations that show little change, i.e., for which the sum of squared, standardized MAD variates is small, and small weights being assigned to observations for which the sum is large. Like the original MAD method, the iterative extension is invariant to linear (affine) transformations of the original variables. To stabilize solutions to the (IR-)MAD problem, some form of regularization may be needed. This is especially useful for work on hyperspectral data. This paper describes ordinary two-set canonical correlation analysis, the MAD transformation, the iterative extension, and three regularization schemes. A simple case with real Landsat Thematic Mapper (TM) data at one point in time and (partly) constructed data at the other point in time that demonstrates the superiority of the iterative scheme over the original MAD method is shown. Also, examples with SPOT High Resolution Visible data from an agricultural region in Kenya, and hyperspectral airborne HyMap data from a small rural area in southeastern Germany are given. The latter case demonstrates the need for regularization
A new method for gray-level picture thresholding using the entropy of the histogram
[J].
DOI:10.1016/0734-189X(85)90125-2
URL
[本文引用: 1]
Threshold is a popular tool for segmenting gray level images.In this paper, a new optimal threshold selection method based on the maximum entroy principle is proposed.Experimental results show that the approach is correct and effectual,and it can be applicable,even when histogram bimodality is unclear.
Automatic analysis of the difference image for unsupervised change detection
[J].
DOI:10.1109/36.843009
URL
[本文引用: 1]
One of the main problems related to unsupervised change detection methods based on the difference image lies in the lack of efficient automatic techniques for discriminating between changed and unchanged pixels in the difference image. Such discrimination is usually performed by using empirical strategies or manual trial-and-error procedures, which affect both the accuracy and the reliability of the change-detection process. To overcome such drawbacks, in this paper, we propose two automatic techniques (based on the Bayes theory) for the analysis of the difference image. One allows an automatic selection of the decision threshold that minimizes the overall change detection error probability under the assumption that pixels in the difference image are independent of one another. The other analyzes the difference image by considering the spatial-contextual information included in the neighborhood of each pixel. In particular, an approach based on Markov Random Fields (MRF's) that exploits interpixel class dependency contexts is presented. Both proposed techniques require the knowledge of the statistical distributions of the changed and unchanged pixels in the difference image. To perform an unsupervised estimation of the statistical terms that characterize these distributions, we propose an iterative method based on the Expectation-Maximization (EM) algorithm. Experimental results confirm the effectiveness of both proposed techniques.
新街台格庙矿区开发初期土地利用动态遥感监测
[J].<p>基于2007年SPOT5数据、2011年ALOS数据、2012年WorldView数据和2013年QuickBird数据,提取新街台格庙矿区开发初期的土地利用变化信息; 通过对变化信息的分析,掌握矿区内土地利用变化和转化情况,进而分析其变化规律及驱动力。研究结果表明: 耕地在2007—2013年间呈现高速增加的趋势,其驱动力来自于居民对矿区开发中征地补偿的预期,居民点、水域和设施农用地的增加也是该驱动力的直接体现; 林地和交通用地面积的增加主要集中在2007—2011年,前者缘于治沙造林工程,后者缘于新恩铁路的修建和兰嘎一级公路的改道; 工矿用地面积的持续增加归结于工业园区的建设和天然气资源的加速开采,随着矿区开发进入建设阶段,工矿用地仍将保持增长的态势; 草地作为矿区内唯一净减少的土地利用类型,其大面积被侵占是利益驱使而导致的; 而荒地的变化更多体现在草地转化为其他地类的中间过程。</p>
Land use dynamic remote sensing monitoring at the initial stage of exploitation of the Xinjie Taigemiao mining area
[J].
地形地貌对半山区土地利用动态变化影响分析——以天津市蓟县为例
[J].以2001年和2011年2期TM图像为数据源,采用分类后比较法提取了10 a间天津市蓟县土地利用动态变化信息; 利用空间分析算法生成地形起伏度和坡度2个地形因子,分析了不同地形特征上的土地利用类型分布及变化特征; 从类型转换和动态度2个方面定量分析土地利用变化情况,并分析土地利用变化与地形起伏度和坡度的相关关系以及土地利用变化的影响因素。结果表明: 地形地貌对土地利用的动态变化有显著的影响,在微缓起伏地形上,居民地增加最多,其次是水域,而林地减少最多; 在低起伏和中起伏地形上,居民地增加最多; 在山地起伏地形上,居民地有所增加; 在高山起伏地形上,只有林地和未利用地有少量变化。该结果可以为天津市蓟县的生态保护以及半山区县土地利用规划提供科学依据。
Impact analysis of landform for land use dynamic change of the partly mountainous area:A case study of Jixian County in Tianjin City
[J].
基于选权迭代估计与非监督分类的多光谱图像变化检测
[J].<p>针对多光谱图像的变化检测问题,提出了一种基于选权迭代估计(iterative estimation with weight selection,IEWS)与非监督分类(unsupervised classification,UC)的多光谱图像变化检测方法。借鉴IEWS的思想,并以类似于迭代加权多元变化检测(iteratively reweighted multivariate alteration detection,IRMAD)的迭代模式进行回归估计,得到初步的变化检测结果; 并通过对初始变化信息的UC处理,以及对不同类别的IEWS,得到最终的变化检测结果。利用该方法对TM图像进行了实验,结果表明: 所得到的变化信息在空间位置上同该区域相应时间段内土地利用/覆盖的变化情况具有很好的一致性; 同时与多元变化检测及IRMAD方法变化检测的结果相比较,表明该方法对相对较小的变化信息具有更好的变化检测能力。</p>
Change detection of multi-spectral images based on iterative estimation with weight selection and unsupervised classification
[J].
江苏滨海湿地土地利用/覆盖变化与地表温度响应遥感监测
[J].以Landsat TM/ETM<sup>+</sup>图像为主要数据源,提取了江苏省盐城滨海湿地土地利用/覆盖信息;基于单窗算法反演了地表温度,综合分析了1992—2009年间湿地土地利用/覆盖变化(LUCC)及其对地表温度的影响。结果表明:在1992—2009年的17 a间,江苏省滨海湿地最主要的LUCC类型是人类主导型,且以自然类型向人工类型转化最为显著;互花米草、碱蓬和芦苇等自然景观总面积减少了385.52 km<sup>2</sup>,养殖场、盐田及建筑用地等人工景观总面积增加了376.97 km<sup>2</sup>;人为干扰是湿地LUCC最主要的驱动因素。在LUCC的影响下,湿地地表温度也有显著波动,多数湿地类型都有不同层次的升温。
The remote sensing monitoring of land use/cover change and land surface temperature responses over the coastal wetland in Jiangsu
[J].
河北坝上地区植被覆盖变化遥感时空分析
[J].<p>基于MODIS数据,采用基于像元尺度的趋势分析和稳定性分析方法,深入分析了河北坝上地区近13 a的植被变化特征。研究表明:空间分布上,坝上全区地表植被覆盖从西向东依次渐好,各分区域的季节变化特征具有明显的差异性;时间上,近13 a以来坝上大部分地区植被覆盖有改善的趋势,其中得到改善的区域占坝上总面积的51.35%,基本不变的区域占25.68%;同时,因坝上地区生态环境比较脆弱,植被生长易受自然和人为因素的干扰,植被覆盖在时间序列上的稳定性较差,坝上全区每年的NDVI最大值合成数据的变异系数<em>Cv</em>平均值达到14.85%,<em>Cv</em><10%的区域仅占坝上总面积的15.3%。</p>
Remote Sensing based temporal and spatial analysis of vegetation cover changes in Bashang Area of Hebei Province
[J].
