

0 引言
改革开放以来,我国城镇化政策多次变动,大体经历4个阶段: ①城镇化恢复发展阶段(1978—1984年); ②城镇化平稳发展阶段(1984—1992年); ③城镇化加速发展阶段(1992—2003年); ④城镇化统筹发展阶段(2003年至今)[1]。现在,中国人口大约有40%居住在城市,快速的城镇化进程带来了诸多生态环境问题,城市表面热岛效应及其变化就是其中最为严重的问题之一[2,3]。城市热岛效应指的是城市中央区域的地表温度(land surface temperature,LST)明显高于郊区等城市边缘的LST,温度差值越大表示城市热岛效应越强,反之,温度差值越小表示城市热岛效应越弱[4,5]。交通、工业、商业和住宅区等人为热源的加剧导致热岛中心区域近地面气温高、空气密度小、气压低,大气做上升运动,与周围地区形成气压差异,从而在城市中心区域形成一个低压区,使生产、生活中产生的各种大气污染物在热岛中心区域聚集,危害人们的身体健康甚至生命[5]。因此,城市热岛效应的大小及模式已成为对许多城市气候研究的主要问题。对城市热岛效应的研究方法主要有气象资料分析法[6]、布点观测法[7]、数值模拟化法[8]和卫星遥感技术法[9,10]4种,其中卫星遥感技术法因能够大面积同步观测、时效性强、空间分辨率高而被广泛利用。目前,大量卫星遥感数据己应用于城市热岛效应研究,如NOAA/AVHRR[11],Terra/Aqua MODIS/ASTER[12],FY-2C[13]和Landsat TM/ETM+/TIRS[14,15,16]等数据。国内外学者对城市热岛效应的遥感研究主要有: Gallo等[17]在1993年通过分析城乡归一化植被指数(normalized difference vegetation index,NDVI)及LST差异,评估了最低气温对城市环境的的影响; Chen等[18]在2016年使用NDVI从不同时期的遥感影像中提取深圳市土地利用/覆盖信息,分析其与热红外波段反演的LST之间的关系,并通过城市不透水面分析了LST与城镇化之间的关系; Mathew等[19]在2016年研究了LST与不透水面面积及海拔的关系; Shen等[20]在2016年通过时空融合方法分析了武汉市连续26 a间高空间分辨率城市热岛效应发展模式及其与NDVI、不透水面面积及植被覆盖度之间的相关关系; 许飞等[21]在2014年在Hottel模型中利用TM数据模拟了城市屋顶在不同反射率下对太阳辐射的吸收过程进行模拟,结果表明“白屋顶计划”能有效缓解城市热岛效应。
北京市作为中国的首都,发展十分迅速。自城镇化加速发展阶段(1992—2003年)和城镇化统筹发展阶段(2003年至今)以来,北京市城区规模不断扩大,不透水面增多,城市能源消耗增大,这些都影响着城市的热岛分布格局。因此,研究和调查北京的城市热岛现象很有意义[18]。许多学者已做过广泛研究,Xu等[22]在2013年利用TM影像分析北京市城市热岛效应与NDVI等指数之间的时空分布关系; Peng等[23]在2016年研究北京市2001年以及2009年春夏秋冬4个季节的热岛效应和城市功能分区、景观类型与热岛效应之间的关系; Wang等[24]在2016年将北京—天津—河北城市群作为研究区域,结果表明城镇化进程对温度的影响显著,城市热岛效应随昼夜变化和季节变化而变化,并预测随着城市扩张,研究区的城市环境会越来越不适宜人们生活,特别是夜间环境; 杨可明等[25]在2014年基于V-I-S模型和全约束最小二乘混合像元分解模型来分析城市不透水面丰度与LST之间的关系,结果表明城市不透水面能够反映城市热环境的空间分布。对北京市热岛效应的研究成果已有很多,但很少有人从城镇化进程角度对热岛效应的发展模式进行研究。本文结合他人已有的研究成果,从定量(基于相对温度比例分级策略(relative percentage temperature grading strategy,RPGS)的热聚合指数(heat aggregation indicator,HAI))和定性(基于RPGS方法对地表亮度温度进行等级划分)2个方面研究城镇化进程的发展对北京市城市热岛效应时空变化的影响,旨在为政府部门进行合理的城区规划、减轻城市热岛效应的影响提供参考依据。
1 研究区概况及数据源
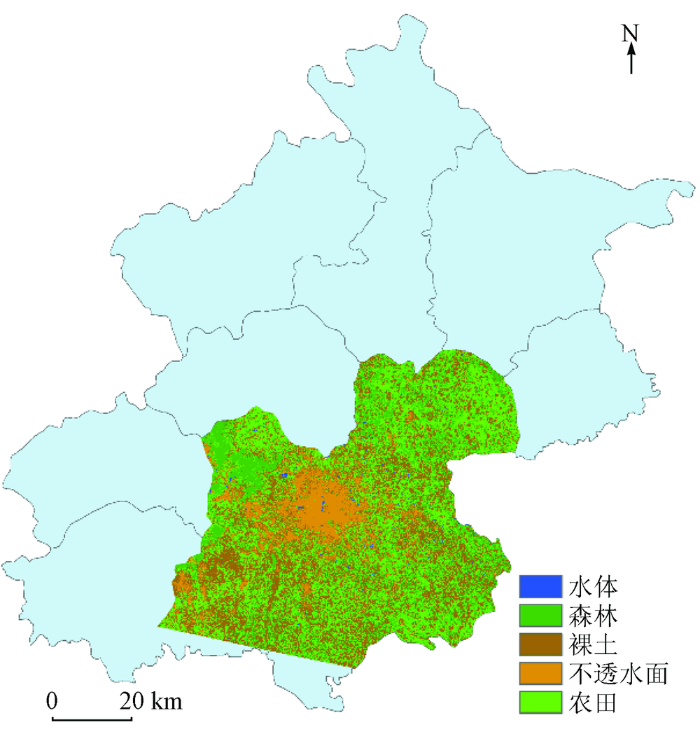
1.1 研究区概况
图1
1.2 数据及其预处理
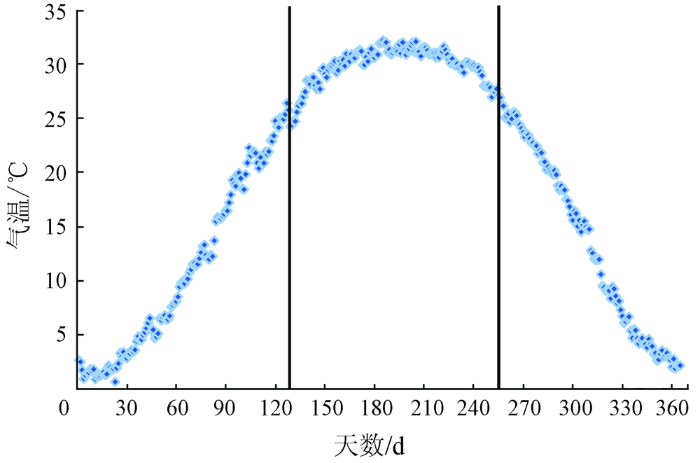
1.2.1 日平均最高气温数据与理想时间窗口
图2
1.2.2 Landsat卫星数据
表1 所获取Landsat数据的部分参数
Tab.1
| 传感器类型 | 获取日期 | 空间分辨率/m | 时间分 辨率/d | |
|---|---|---|---|---|
| 可将光和近 红外波段 | 热红外 波段 | |||
| Landsat5 TM | 19850718 | 30 | 120 | 16 |
| 19910617 | ||||
| 19950916 | ||||
| 20050725 | ||||
| 20110726 | ||||
| Landsat7 ETM+ | 20010924 | 30 | 60 | |
| Landsat8 TIRS | 20150824 | 30 | 100 | |
对上述7景影像利用ENVI软件分别进行辐射定标、大气校正、几何纠正和裁剪等预处理,为后续研究提供基础影像数据。
2 研究方法
2.1 地表亮度温度生成
本文用Landsat数据直接反演地表亮度温度(以下简称为地表亮温),作为LST来研究热岛效应。热红外波段数据经辐射定标之后,便可根据普朗克函数直接求解地表亮温[27],其计算公式为
式中:
2.2 地表亮温等级划分
表2 7期Landsat影像中各覆盖类别最小/最大/平均LST及面积比例
Tab.2
| 覆盖类别 | LST | 1985年 | 1991年 | 1995年 | 2001年 | 2005年 | 2011年 | 2015年 | 7期平均 |
|---|---|---|---|---|---|---|---|---|---|
| 水体 | 最低/K | 287.87 | 290.99 | 284.80 | 283.63 | 293.55 | 296.20 | 296.86 | 290.56 |
| 最高/K | 302.09 | 305.36 | 298.92 | 300.11 | 304.34 | 312.18 | 307.72 | 304.39 | |
| 平均/K | 295.19 | 295.95 | 292.02 | 292.07 | 297.91 | 299.34 | 299.75 | 296.03 | |
| 面积比例/% | 0.57 | 0.74 | 0.62 | 0.73 | 0.75 | 0.75 | 0.68 | 0.69 | |
| 高大植被 | 最低/K | 286.45 | 290.61 | 284.62 | 282.90 | 292.94 | 293.76 | 293.74 | 289.29 |
| 最高/K | 303.09 | 308.85 | 303.76 | 301.84 | 308.67 | 310.90 | 310.81 | 306.85 | |
| 平均/K | 295.70 | 297.69 | 293.60 | 293.86 | 298.73 | 300.58 | 301.55 | 297.39 | |
| 面积比例/% | 22.91 | 23.79 | 33.16 | 27.57 | 24.45 | 24.87 | 6.38 | 23.30 | |
| 低矮植被 | 最低/K | 286.50 | 290.25 | 287.60 | 282.38 | 291.35 | 294.75 | 293.10 | 289.42 |
| 最高/K | 303.14 | 308.46 | 299.34 | 302.55 | 305.80 | 310.59 | 312.73 | 306.09 | |
| 平均/K | 295.62 | 297.08 | 292.91 | 293.11 | 298.29 | 300.23 | 302.04 | 297.04 | |
| 面积比例/% | 30.72 | 8.06 | 31.09 | 18.62 | 30.88 | 27.50 | 35.22 | 26.01 | |
| 裸土 | 最低/K | 281.98 | 291.87 | 289.32 | 282.37 | 293.25 | 294.69 | 295.34 | 289.83 |
| 最高/K | 305.98 | 310.11 | 301.18 | 306.51 | 310.28 | 314.42 | 315.11 | 309.08 | |
| 平均/K | 296.84 | 299.07 | 294.23 | 294.68 | 300.25 | 302.40 | 304.25 | 298.82 | |
| 面积比例/% | 34.67 | 46.59 | 14.90 | 24.13 | 14.91 | 11.01 | 16.09 | 23.19 | |
| 不透水面 | 最低/K | 277.24 | 290.72 | 283.12 | 275.15 | 289.90 | 292.51 | 293.86 | 286.07 |
| 最高/K | 308.72 | 315.46 | 311.19 | 309.09 | 313.24 | 317.51 | 316.18 | 313.05 | |
| 平均/K | 298.16 | 300.65 | 294.93 | 295.02 | 301.22 | 304.06 | 305.47 | 299.93 | |
| 面积比例/% | 11.13 | 20.82 | 20.23 | 28.95 | 29.02 | 35.87 | 41.64 | 26.81 | |
| 分类精度 | OA/% | 96.04 | 95.98 | 95.26 | 92.25 | 94.07 | 92.02 | 93.46 | 94.16 |
| Kappa | 0.95 | 0.95 | 0.94 | 0.90 | 0.92 | 0.90 | 0.92 | 0.93 |
考虑到一般地表覆盖类型的温度由低到高分别为水体/森林、农田、裸土、农村居民用地、其他建设用地和城镇用地,以分类结果为参考,将水体和高大植被作为低温区、低矮植被作为亚低温区、裸土作为中温区、不透水面作为亚高温区和高温区,得到本文的RPGS方法地表亮温等级划分标准(表3)。
表3 RPGS方法温度等级划分
Tab.3
| 温度分区 | 所占比例/% | 分区范围/% |
|---|---|---|
| 低温区 | 24.0 | [0,24) |
| 亚低温区 | 26.0 | [24,50) |
| 中温区 | 23.2 | [50,73.2) |
| 亚高温区 | 25.5 | [73.2,98.7) |
| 高温区 | 1.3 | [98.7,100] |
本文的研究重点是高温区和亚高温区的转移趋势,故文中所有日期的数据均采用表3中的温度等级划分标准,以确保每一个温度等级中的像元个数不发生变化。采用RPGS方法能够清晰地观察到时间序列上的热转移趋势。
3 结果与分析
3.1 城市热分布演变过程定性分析
图3
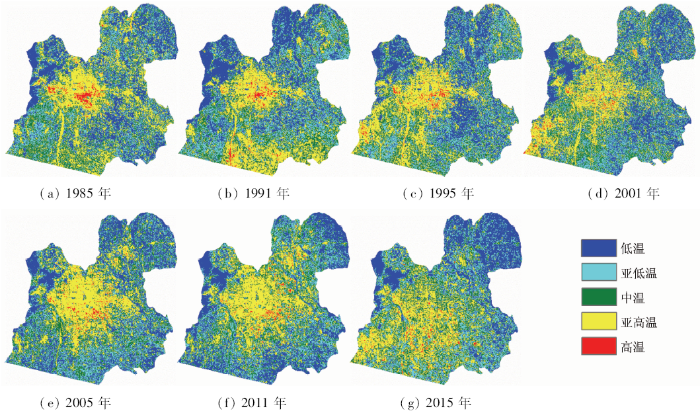
图3中所有的影像都是采用RPGS方法划分的,每一景影像中每一温度区域的像元个数均未发生变化,统一的划分标准可以清楚地从时间序列数据中反映出城市的热转移趋势。图3中一系列的地表亮温分级图表明,市中心的温度均持续高于周边郊区(农村)的温度。高温区(红色)及亚高温区(黄色)主要分布在市区,且随着时间的推移和城镇化进程的加快,城区范围不断扩大,城区内工业发达、商业繁华、人口增多,郊区则大部分变为城区,绿化、裸土面积减小; 因此,高温区域和亚高温区域由原来的市中心和郊区裸土区域逐渐扩展为集中分布在整个城区内。由于城区的扩展,高温区和亚高温区就由早些年的集中分布在东城区和西城区向外扩展为若干个小热岛,分布在整个北京市的市中心。值得注意的是,随着城镇化进程的发展阶段不同,高温区也呈现不同的演化模式。早期的高温区绝大部分集中在东城区、西城区等老城区,亚高温区则围绕着高温区分布; 与高温区的分布相比,亚高温区的分布较为分散且温度等级分布几乎没有什么变化,主要表现在1985年和1991年,该时间段为城镇化进程的平稳发展阶段,城镇化进程缓慢,地表覆盖变化不大,引起热岛效应的因子几乎不变。中期高温区慢慢向老城区之外的区域扩展,但分布仍较为集中; 亚高温区则在向郊区(农村)扩展; 市中心的亚低温区域增多,主要表现在1995年和2001年(对应着城镇化进程的加速发展阶段),从影像图中可看出该期间北京市城区已经扩展至整个五环线,建筑面积急剧增多,因此热岛区域也由市中心向外扩展。自2005年起,高温区零零散散地分布于整个五环或者六环区域内,形成一些零星的小热岛区域,而市中心由原来的大部分属于高温区域变为绝大部分属于亚高温区域。2005年至今,整个北京市已经形成一个整体亚高温和局部高温的组合模式。
经分析发现了一个有趣的现象,即热岛效应最严重的地区由原来集中分布在老城区变为离散分布于几个局部地区。为了将上述热岛现象的演变模式在更小的尺度展现出来,本文对市中心的东西城区(东城区和西城区)、朝阳区、海淀区及石景山区做进一步分析。为了确保更清晰的对比,根据前文所说的中国城镇化进程发展阶段,将本文所用Landsat影像分为3个时段,分别为1985—1991年、1995—2001年和2005—2015年。对每个时段的影像求LST平均值,之后仍然采用2.2节中的地表亮温等级划分方法,生成LST分布分级图(图4)。图4(a)—(c)是东、西城区阶段性热演变图。东、西城区是北京市老城区,从图中可以看出,高温区域大面积集中分布在东、西城区; 随着时间的流逝,高温区范围急剧缩小且变得分散; 在最新时段(2005—2015年),老城区只剩下一个小范围的高温区,该高温区位于大栅栏商业街区,该街区人口众多、胡同密集、建筑物覆盖度很高而植被覆盖度很低(图4(a)—(c)中的方框区域)。
图4-1
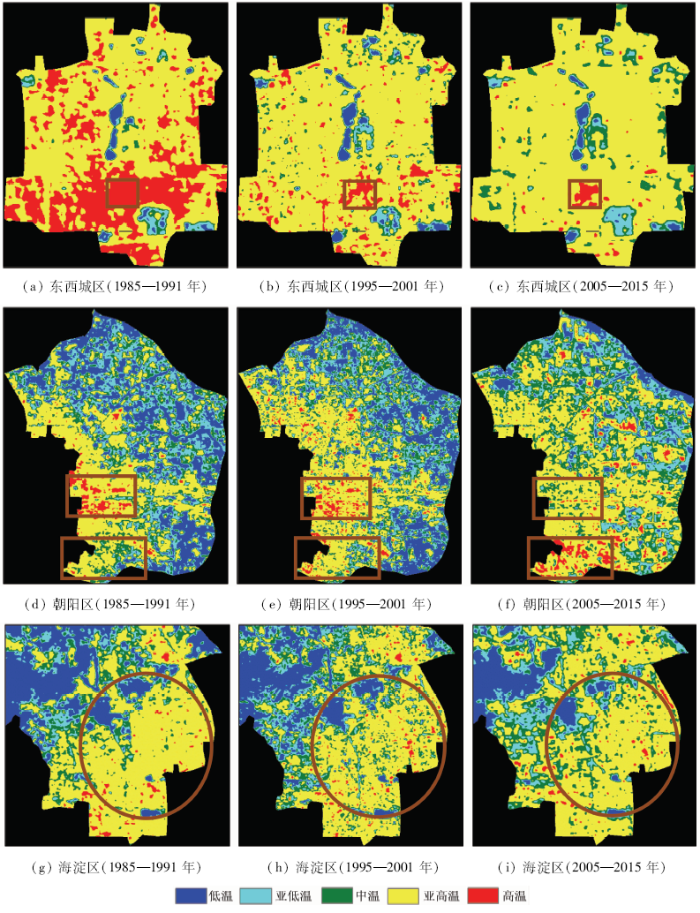
图4-1
各时段Landsat影像平均LST演变图
Fig.4-1
Evolution of average LST of Landsat image in different stages
图4-2

图4-2
各时段Landsat影像平均LST演变图
Fig.4-2
Evolution of average LST of Landsat image in different stages
图5

图6

图6
热分布与工厂区和住宅区之间的关系(搜索自腾讯地图: 圆形(或椭圆形)内是工厂密集区,方框内是住宅区)
Fig.6
Relationship between thermal distribution and factory area as well as residential area
图7
值得注意的是,建筑物低矮密集且低植被覆盖区域的温度远远高于建筑物高大稀疏且高植被覆盖区域的温度,如图8所示。
图8
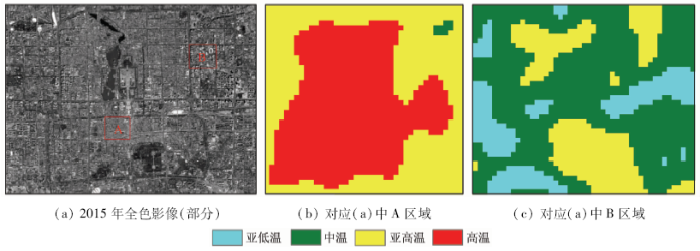
图8
建筑物低矮密集且低植被覆盖区域(A)和建筑物高大稀疏且高植被覆盖区域(B)温度分级
Fig.8
Temperature grades of low-vegetation-covered areas with low-dense of buildings(A)and high-vegetation-covered areas with tall- sparse of buildings(B)
3.2 热聚合和热岛强度演变过程定量分析
图9

图9
用于定量研究地表城市热岛效应的区域(1985年)(从内到外分别是: 东西城区、四环路、五环路)
Fig.9
Areas for quantitative study of surface urban heat island effect in 1985
图10
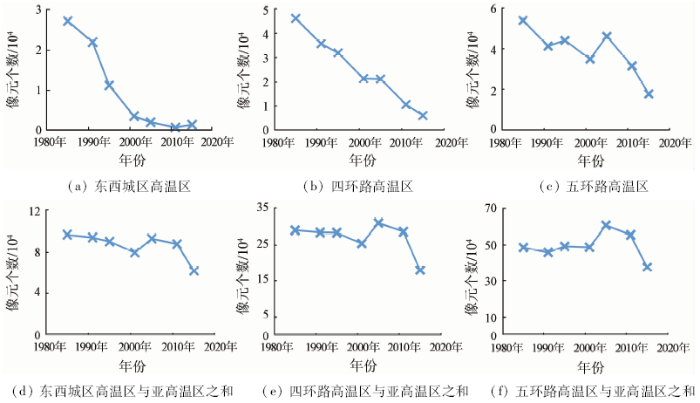
图10
1985—2015年北京市HAI
Fig.10
Beijing heat aggregation indicators from 1985 to 2015
4 结论与建议
本文以经筛选的1985年、1991年、1995年、2001年、2005年、2011年和2015年7个时段内的Landsat卫星数据为基础,采用遥感手段,分析了北京市城市热岛效应的时空变化特征,得到如下结论:
1)考虑到国家政策对城镇化进程的影响,本文使用7个时段的Landsat卫星数据分析北京市热岛效应热转移趋势。一方面,随着北京市城镇化进程的发展,在1985—2015年间温度较高的区域(高温区和亚高温区)一直集中在城区范围内,城中央明显的大范围高温区域形成岛状结构; 另一方面,高温区已从东西城区向海淀、丰台、石景山等区域转移,导致高温区域越来越分散,东西城区高温区大部分被亚高温区所替代,整个研究区已无大范围聚集的高温区,取而代之的是零星分布的小热岛区域。
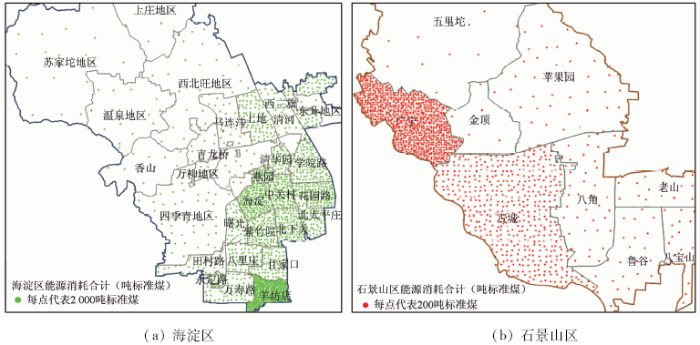
2)对城市热分布演变过程的定性分析结果表明,在工厂密集、大型购物中心较多、住宅区分布较广的区域,高温区与亚高温区分布也相对较密集,但呈递减趋势。究其原因可能是,虽然住宅区人口密度大、建筑物分布密集,但是住宅区能源消耗合计没有工厂区大,绿化程度比工厂区高,且没有明显的热源。此结论对城市规划具有重要意义,可为相关部门合理规划工业园区分布以减轻城市热岛效应的影响提供参考依据。
综上所述,如何缓解或尽量减轻城市热岛效应将是一个非常值得研究讨论的话题。本文的研究考虑到城市绿地面积可有效减轻城市热岛效应的影响,建筑物等地物的密集则会加重城市热岛效应,可给出在以后的城市规划中应该避免高密度低层且低植被覆盖住宅区的建设等建议。
本文在研究热岛效应的时空变化特征中,虽然用到的遥感影像数据的时间间隔相对于已有研究已经大大缩小,但是时间间隔仍然相差了5 a左右,5 a的时间内城市可能已经发生了很大的变化; 因此,后续的研究应进一步缩小遥感影像数据获取的时间间隔,争取做到1 a的时间分辨率。另外,城市热岛效应会随季节而变化,也会随昼夜而变化,故在研究城市热岛效应时,对气温测量的合适季节与昼夜时刻,以及对应遥感数据类型与时相的选择方法也值得进一步调查研究。
参考文献
中国城镇化进程、面临问题及其总体布局
[J].
Relationship between land surface temperature and spatial pattern of greenspace:What are the effects of spatial resolution?
[J].DOI:10.1016/j.landurbplan.2013.02.005 URL [本文引用: 1]
1993—2012年西安城区城市热岛效应强度变化趋势及影响因素分析
[J].
The changing trend of heat island intensity and main influencing factors during 1993─2012 in Xi’an City
[J].
Comparison of impervious surface area and normalized difference vegetation index as indicators of surface urban heat island effects in Landsat imagery
[J].DOI:10.1016/j.rse.2006.09.003 URL [本文引用: 2]
北京市城、郊气候要素对比研究
[J].
Study on characteristics of climate elements in Beijing
[J]
西安城市热岛的时空分布特征
[J].选取1959-2008年西安市常规气象站和城区加密自动站逐小时气温资料,采用城、郊气温对比法研究西安城市热岛效应的时间变化和空间分布。结果表明:西安城市热岛效应逐年增加,具有明显的季节变化特征;热岛强度日变化呈现双峰分布,两个峰值分别出现在05时和21时左右,最低值出现在11时左右。在西安市城区一直存在一个强城市强热岛中心和一个弱热岛中心;秋冬季西安市出现了多个热岛中心。
Distributive characters of urban heat island effect in Xi’an City
[J].
Numerical study of the urban heat island over Athens (Greece) with the WRF model
[J].
DOI:10.1016/j.atmosenv.2013.02.055
URL
[本文引用: 1]

In this study, the Weather Research and Forecasting (WRF) model coupled with the Noah land surface model was tested over the city of Athens, Greece, during two selected days. Model results were compared against observations, revealing a satisfactory performance of the modeling system. According to the numerical simulation, the city of Athens exhibits higher air temperatures than its surroundings during the night (>402°C), whereas the temperature contrast is less evident in early morning and mid-day hours. The minimum and maximum intensity of the canopy-layer heat island were found to occur in early morning and during the night, respectively. The simulations, in agreement with concurrent observations, showed that the intensity of the canopy-layer heat island has a typical diurnal cycle, characterized by high nighttime values, an abrupt decrease following sunrise, and an increase following sunset. The examination of the spatial patterns of the land surface temperature revealed the existence of a surface urban heat sink during the day. In the nighttime, the city surface temperature was found to be higher than its surroundings. Finally, a simple data assimilation algorithm for satellite-retrieved land surface temperature was evaluated. The ingestion of the land surface temperature data into the model resulted to a small reduction in the temperature bias, generally less than 0.202°C, which was only evident during the first 4–502h following the assimilation.
Temporal characteristics of thermal satellite images for urban heat stress and heat island mapping
[J].DOI:10.1016/j.isprsjprs.2012.09.007 URL [本文引用: 1]
北京市1989—2010年地表温度时空分异特征分析
[J].以3S技术为支持,采用TM数据、应用单窗算法对1989-2010年间北京市五环内地表温度(land surface temperature,LST)进行反演,并采用同步的MODIS 温度产品对反演结果进行对比验证。在此基础上,利用距平值分析和剖面线分析等方法揭示了20多a来北京市地表温度的时空分异总体特征;基于归一化水汽指数(normalized difference moisture index,NDMI)和归一化建筑指数(normalized difference building index,NDBI)分析了研究区内地表温度的时空变化特征,定量揭示并阐述了地表温度和NDMI及NDBI的相关关系。研究结果表明:反演温度可较为真实地反映研究区地表热量的空间差异;北京地表温度时空变化特征明显,同一时段、不同土地覆盖类型的地表温度差异较为显著,热岛效应明显;地表温度和NDBI呈显著的正相关,与NDMI则呈显著的负相关,NDMI和NDBI在表征地表热特征方面均是较好的指标。该结果为监测北京地表温度变化及其时空分布特征提供了依据。
A temporal-spatial variation analysis of land surface temperature in Beijing
[J].
沈阳等6城市热岛效应卫星监测研究
[J].
Estimation of long term low resolution surface urban heat island intensities for tropical cities using MODIS remote sensing data
[J].DOI:10.1016/j.uclim.2016.04.002 URL [本文引用: 1]
基于FY-2C数据的地表温度反演验证——以黄河源区玛曲为例
[J].<p>地表温度是气候、水文和生态等研究领域的基本参数,在地表水量和能量平衡的研究和应用中发挥着十分重要的作用。强烈的异质性是地表温度反演精度不高的主要原因之一。该文以黄河源区玛曲为研究区,评估FY-2C数据的地表温度反演精度,为将来温度反演算法和产品的进一步发展提供依据。首先,以与FY-2C相同空间分辨率的MODIS地表温度产品(MOD11B1)为地表温度真值,对反演的地表温度进行了验证; 然后,利用研究区内20个采样点的土壤温度(5 cm)实测数据对反演结果进行验证。结果表明,FY-2C地表温度与MODIS温度产品具有较好的相关性,相关系数在0.72~0.95之间,均方根误差在0.44~3.87 K之间,平均均方根误差为1.90 K; 反演结果和实测数据的相关系数为0.69。</p>
Validation of FY-2C derived land surface temperature over the source region of the Yellow River:A case study of Maqu County
[J].
Assessment of urban heat island based on the relationship between land surface temperature and land use/ land cover in Tehran
[J].DOI:10.1016/j.scs.2016.03.009 URL [本文引用: 1]
基于Landsat TM的地表温度分解算法对比
[J].如何综合可见光波段信息提高地表温度的空间分辨率一直是热红外遥感应用研究的重要方向。以北京市Landsat TM图像为数据源,对比分析了SUTM和E-DisTrad模型地表温度分解的空间特征差异性和适用范围。结果表明: 在植被覆盖较低、地表温度较高的中心城区,SUTM模型的地表温度分解效果更佳,最小均方根误差和平均绝对误差分别为1.522 K和1.191 K; 在植被覆盖较高、地表温度较低的郊区,E-DisTrad模型的地表温度分解效果更好,最小均方根误差和平均绝对误差分别为1.768 K和1.173 K。2种模型都能有效地提高地表温度的空间分辨率,但是在植被覆盖不同的地区分解结果呈现一定的差异性。
Comparison of two models for decomposition of land surface temperature image using Landsat TM data
[J].
南京市地表参数变化与热岛效应时空分析
[J].利用南京市1989年TM和2001年、2010年ETM<sup>+</sup>卫星遥感数据,提取了3个时期的归一化植被指数(normalized difference vegetation index,NDVI)、改进的归一化水体指数(modified normalized difference water index,MNDWI)、归一化建筑指数(normalized difference build-up index,NDBI)和归一化不透水面指数(normalized difference impervious surface index,NDISI)等地表参数;利用热红外波段遥感数据反演地表温度,并从时间维对比分析了3个时期各个参数的变化和产生的原因;利用回归分析方法探讨了上述地表参数变化与城市地表温度之间的关系,即地表温度与NDISI和NDBI呈正相关,与NDVI呈负相关。进一步分析表明,南京市最近20 a来不透水面和建筑面积大幅增大,植被覆盖范围减少,城市热岛效应加剧,不透水面、建筑指数与地表温度的变化趋势和城市扩张趋势一致。该研究成果对于揭示南京市热岛效应、优化土地配置和推进生态城市建设具有一定的参考意义。
Spatial-temporal analysis of urban heat island effect and surface parameters variation in Nanjing City
[J].
The use of NOAA AVHRR data for assessment of the urban heat island effect
[J].
DOI:10.1175/1520-0450(1993)032<0899:TUONAD>2.0.CO;2
URL
[本文引用: 1]
A vegetation index and a radiative surface temperature were derived from satellite data acquired at approximately 1330 LST for each of 37 cities and for their respective nearby rural regions from 28 June through 8 August 1991. Urban-rural differences for the vegetation index and the surface temperatures were computed and then compared to observed urban-rural differences in minimum air temperatures. The purpose of these comparisons was to evaluate the use of satellite data to assess the influence of the urban environment on observed minimum air temperatures (the urban heat island effect). The temporal consistency of the data, from daily data to weekly, biweekly, and monthly intervals, was also evaluated. The satellite-derived normalized difference (ND) vegetation-index data, sampled over urban and rural regions composed of a variety of land surface environments, were linearly related to the difference in observed urban and rural minimum temperatures. The relationship between the ND index and observed differences in minimum temperature was improved when analyses were restricted by elevation differences between the sample locations and when biweekly or monthly intervals were utilized. The difference in the ND index between urban and rural regions appears to be an indicator of the difference in surface properties (evaporation and heat storage capacity) between the two environments that are responsible for differences in urban and rural minimum temperatures. The urban and rural differences in the ND index explain a great amount of the variation observed in minimum temperature differences than past analyses that utilized urban population data. The use of satellite data may contribute to a globally consistent method for analysis for urban heat island bias.
The investigation of urbanization and urban heat island in Beijing based on remote sensing
[J].
DOI:10.1016/j.sbspro.2015.12.019
URL
[本文引用: 2]
As the capital of China, Beijing has become a world city after decades of development. It is necessary and meaningful to have a comprehensive investigation of the urban situation in Beijing. In addition, with the development and widely applied in urban studies, the remote sensing technology was put into use as a significant tool in this study which including DMSP-OLS and Landsat TM/ETM. This study was made up with two aspects: the urbanization investigation and the urban heat island effect survey. For the first part, the investigation was carried out by the correlation analysis with the official statistics and the night time light times series images from DMSP-OLS. Another aspect is the urban heat island effect survey, the Landsat TM/ETM data in 1995 and 2009 were processed to provide the NDVI and LST in the study region. By using the correlation analysis and regression analysis, the comprehensive understanding of the phenomenon of urban heat island in Beijing can be got.
Spatial and temporal variations of urban heat island effect and the effect of percentage impervious surface area and elevation on land surface temperature:Study of Chandigarh City,India
[J].DOI:10.1016/j.scs.2016.06.018 URL [本文引用: 1]
Long-term and fine-scale satellite monitoring of the urban heat island effect by the fusion of multi-temporal and multi-sensor remote sensed data:A 26-year case study of the city of Wuhan in China
[J].DOI:10.1016/j.rse.2015.11.005 URL [本文引用: 2]
“白屋顶计划”对缓解城市热岛效应的有效性评价
[J].<p>为评价“白屋顶计划”对缓解城市热岛效应的有效性,以上海市城区为例进行了研究。首先,对研究区域TM图像进行大气校正获取地表反照率;然后,用Hottel模型模拟了晴天逐时太阳辐照度,并对城市屋顶在不同反射率下吸收太阳辐射过程进行了模拟;最后,经过回归建模估算出“白屋顶计划”在夏季午间高温时段能使热岛温度降低1.32℃,并估算出夏季白屋顶室内空调节能效率可达12.60%。</p>
Evaluation of the “white roof plan” for alleviating heat island effect
[J].
Correlation analysis of the urban heat island effect and the spatial and temporal distribution of atmospheric particulates using TM images in Beijing
[J].DOI:10.1016/j.envpol.2013.03.006 URL [本文引用: 1]
Urban thermal environment dynamics and associated landscape pattern factors:A case study in the Beijing metropolitan region
[J].DOI:10.1016/j.rse.2015.11.027 URL [本文引用: 1]
Response of urban heat island to future urban expansion over the Beijing-Tianjin-Hebei metropolitan area
[J].DOI:10.1016/j.apgeog.2016.02.010 URL [本文引用: 1]
城市不透水面及地表温度的遥感估算
[J].基于植被-不透水面-土壤模型和全约束最小二乘法混合像元分解模型,从探索城市热岛效应和城市不透水面关系出发,利用TM数据对北京市海淀区的城市不透水面丰度和地表温度进行估算,并在此基础上对二者之间的相关性进行定性分析和定量评价。研究表明:城市不透水面的空间分布和变化趋势与地表温度之间存在明显的一致性,二者相关系数达到0.752 5,这说明城市不透水面信息可以很好地反映城市热环境的空间分布状况。
Remote sensing estimating of urban impervious surface area and land surface temperature
[J].
转型期的石景山区规划
[J].
DOI:10.3969/j.issn.1003-627X.2007.02.036
URL
[本文引用: 1]
正在北京市区的几个行政区中,石景山区一直是不太引人注意的,人们提起它一般会联想到“重工业、污染、边缘地区”等词汇,即便是近几年热闹了一阵的环球嘉年华,也没有从根本上改变几十年来人们对石景山区的认识。然而,处于大众视野
