1. Shaanxi Earthquake Agency, Xi’an 710068, China; 2. National Engineering Research Center for Information Technology in Agriculture, Beijing 100097, China 3. Key Laboratory of Agri-informatics, Ministry of Agriculture, Beijing 100097, China 4. Beijing Engineering Research Center of Agricultural Internet of Things, Beijing 100097, China 5. Xi’an Zhongtianweidi Surveying & Mapping Technology Co.,Ltd., Xi’an 710054, China; 6. College of Geomatics, Xi’an University of Science and Technology, Xi’an 710054, China; 7. Xi’an Aerospace Tian Painted Data Technology Co., Ltd., Xi’an 710054, China;
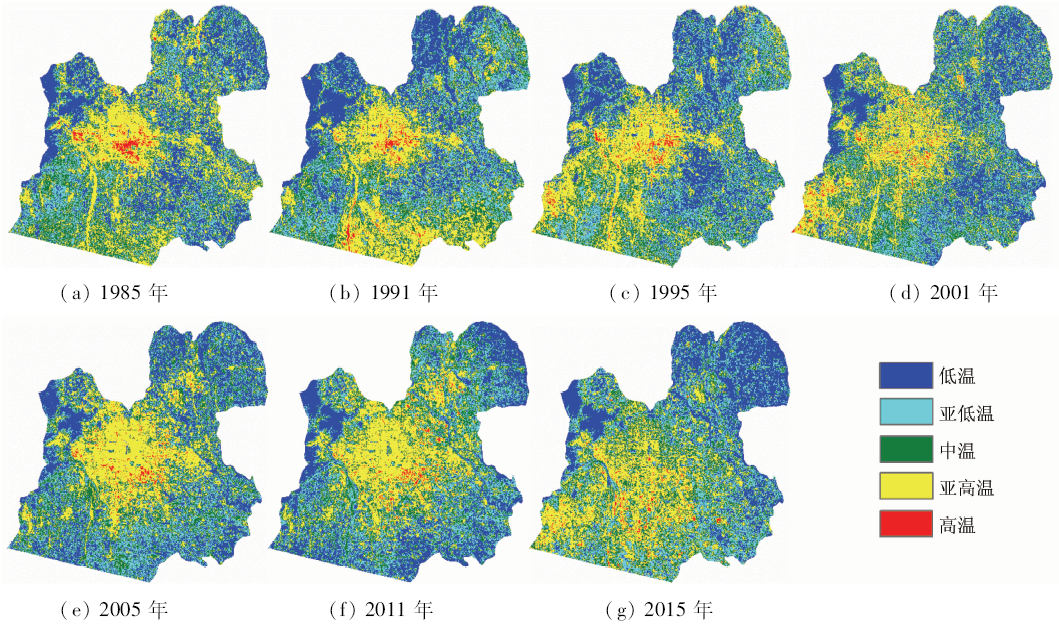
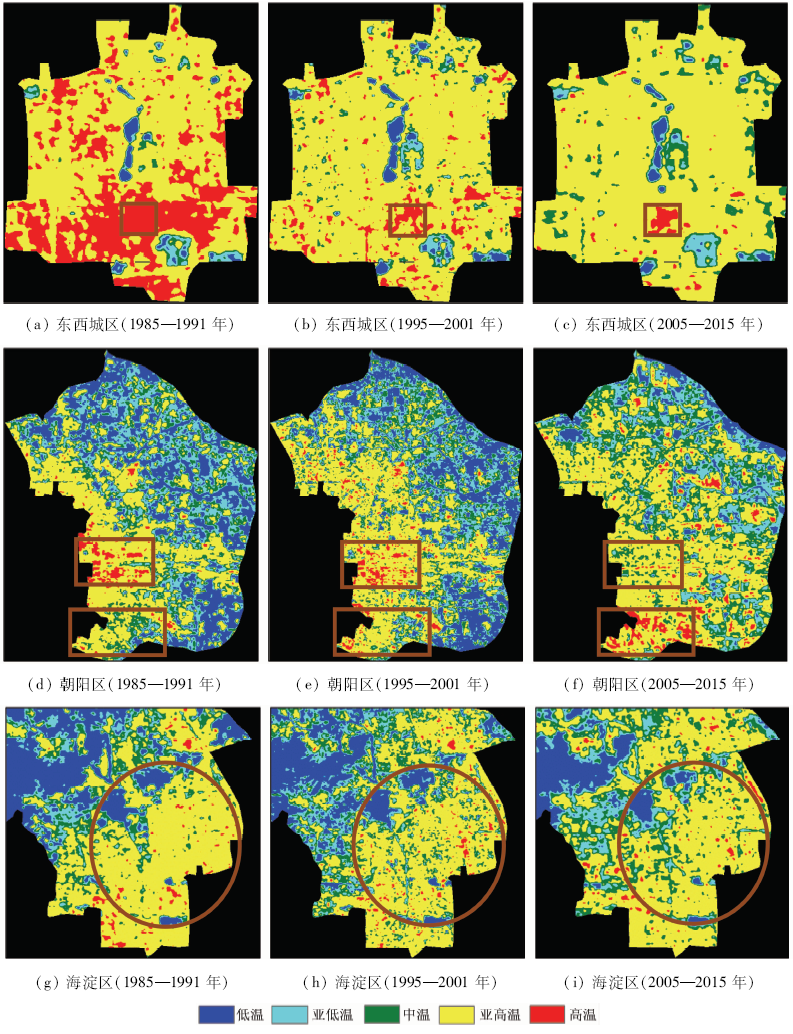
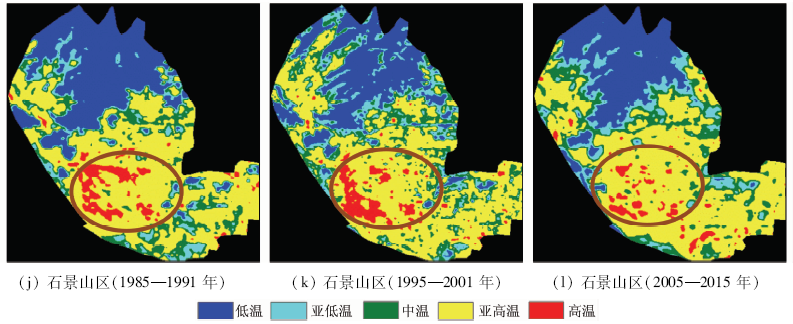
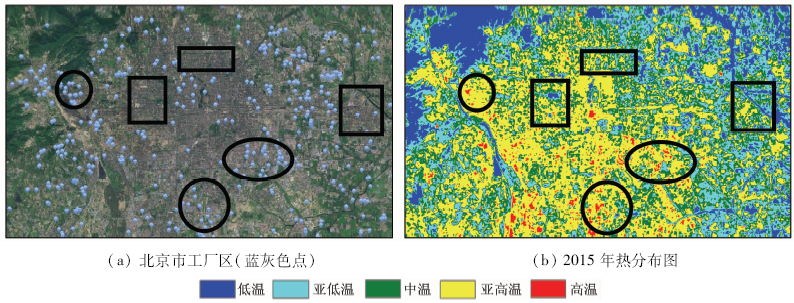
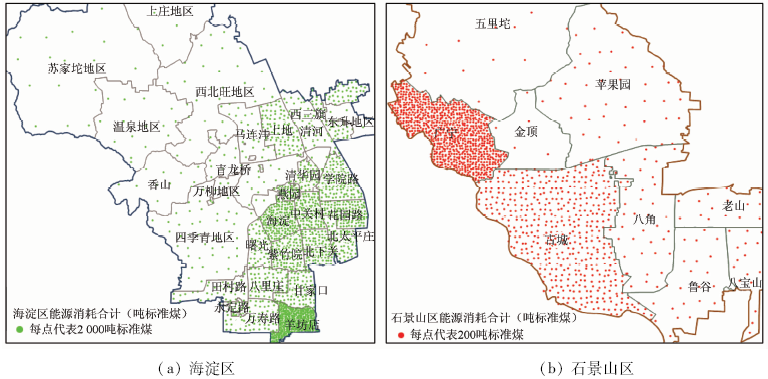
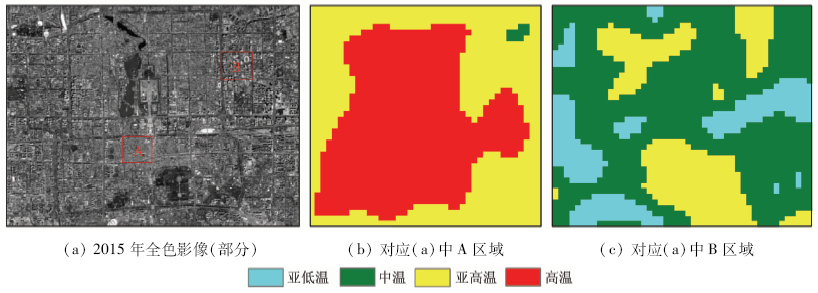
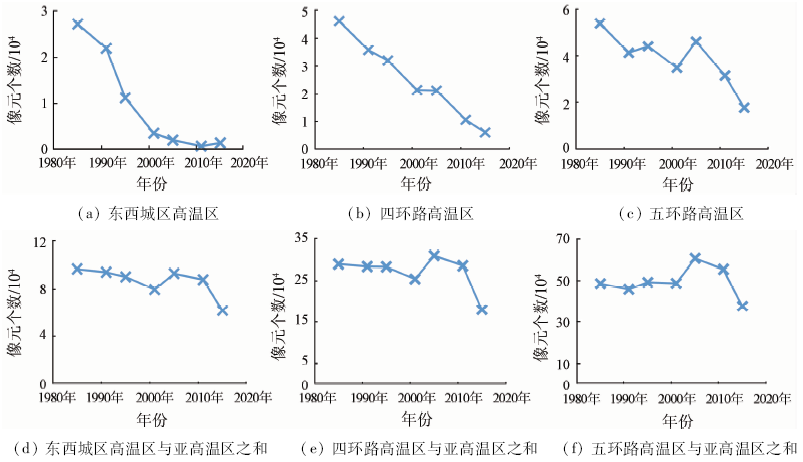
In order to study the temporal-spatial variation of the urban heat island effect over Beijing since 1985, the authors utilized the 7 phases of Landsat TM/ETM+/TIRS images in summer to perform retrieval of the land surface brightness temperature so as to replace the true land surface temperature(LST). And the LST data were used for a series of qualitative and quantitative analysis of urban heat island effect to reveal Beijing heat distribution and the characteristics of urban heat island effect. Some conclusions have been reached: ① The high-temperature regions and sub-high temperature regions are continuously centralized to the urban area, but the high-temperature regions in Dongcheng District and Xicheng District show a significant downward trend, and the large scale of heat island is replaced by the small heat islands;② The influence of industrial estate on the urban heat island effect in Beijing is much higher than that of the residential district in Beijing;③ The temperature of the areas with low-rise and dense buildings and low vegetation coverage are much higher than the temperature of the areas with tall and sparse buildings and high vegetation coverage. The results of the study would play an important role in urban planning in that they provide the reference frame for the government departments to reduce the impact of urban heat island effect based on rational planning of the distribution of water, green land,industrial estate and residential areas.
Wang J F . Research of Xixian New Area Land Surface Temperature Retrieval and Its Changes Based on Remote Sensing Images[D]. Chongqing:Southwest University, 2015.
[3]
Li X M, Zhou W Q, Ouyang Z Y . Relationship between land surface temperature and spatial pattern of greenspace:What are the effects of spatial resolution?[J]. Landscape and Urban Planning, 2013,114:1-8.
doi: 10.1016/j.landurbplan.2013.02.005
Liu Y F, Yuan Z H, Kong W , et al. The changing trend of heat island intensity and main influencing factors during 1993─2012 in Xi’an City[J]. Journal of Natural Resources, 2015,30(6):974-985.
[5]
Yuan F, Bauer M E . Comparison of impervious surface area and normalized difference vegetation index as indicators of surface urban heat island effects in Landsat imagery[J]. Remote Sensing of Environment, 2007,106(3):375-386.
doi: 10.1016/j.rse.2006.09.003
Dong Y, Li X M, Yang Y C , et al. Distributive characters of urban heat island effect in Xi’an City[J]. Journal of Arid Land Resources and Environment, 2011,25(8):107-112.
[8]
Giannaros T M, Melas D, Daglis I A , et al. Numerical study of the urban heat island over Athens (Greece) with the WRF model[J]. Atmospheric Environment, 2013,73:103-111.
doi: 10.1016/j.atmosenv.2013.02.055
[9]
Nichol J E, Hang T P . Temporal characteristics of thermal satellite images for urban heat stress and heat island mapping[J]. ISPRS Journal of Photogrammetry and Remote Sensing, 2012,74:153-162.
doi: 10.1016/j.isprsjprs.2012.09.007
Wang Y H, Xiao Y . A temporal-spatial variation analysis of land surface temperature in Beijing[J]. Remote Sensing for Land and Resources, 2014,26(3):146-152.doi: 10.6046/gtzyyg.2014.03.24.
Ji R P, Zhang X M, Li G . Study on satellite monitoring of urban heat island effect in 6 cities[J].Liaoning Meteorology, 2000(4):22-23.
[12]
Flores R J L, Filho A J P, Karam H A . Estimation of long term low resolution surface urban heat island intensities for tropical cities using MODIS remote sensing data[J]. Urban Climate, 2016,17:32-66.
doi: 10.1016/j.uclim.2016.04.002
Wang Y W, Song X N, Tang B H , et al. Validation of FY-2C derived land surface temperature over the source region of the Yellow River:A case study of Maqu County[J]. Remote Sensing for Land and Resources, 2015,27(4):68-72.doi: 10.6046/gtzyyg.2015.04.11.
[14]
Bokaie M, Zarkesh M K, Arasteh P D , et al. Assessment of urban heat island based on the relationship between land surface temperature and land use/ land cover in Tehran[J]. Sustainable Cities and Society, 2016,23:94-104.
doi: 10.1016/j.scs.2016.03.009
Song C Y, Qin Z H, Wang F . Comparison of two models for decomposition of land surface temperature image using Landsat TM data[J]. Remote Sensing for Land and Resources, 2015,27(1):172-177.doi: 10.6046/gtzyyg.2015.01.27.
Li X Y, Du P J, Alim S . Spatial-temporal analysis of urban heat island effect and surface parameters variation in Nanjing City[J]. Remote Sensing for Land and Resources, 2014,26(2):177-183.doi: 10.6046/gtzyyg.2014.02.28.
[17]
Gallo K P, Mcnab A L, Karl T R , et al. The use of NOAA AVHRR data for assessment of the urban heat island effect[J]. Journal of Applied Meteorology, 1993,32(5):899-908.
doi: 10.1175/1520-0450(1993)032<0899:TUONAD>2.0.CO;2
[18]
Chen W, Zhang Y, Gao W J , et al. The investigation of urbanization and urban heat island in Beijing based on remote sensing[J]. Procedia-Social and Behavioral Sciences, 2016,216:141-150.
doi: 10.1016/j.sbspro.2015.12.019
[19]
Mathew A, Khandelwal S, Kaul N . Spatial and temporal variations of urban heat island effect and the effect of percentage impervious surface area and elevation on land surface temperature:Study of Chandigarh City,India[J]. Sustainable Cities and Society, 2016,26:264-277.
doi: 10.1016/j.scs.2016.06.018
[20]
Shen H F, Huang L W, Zhang L P , et al. Long-term and fine-scale satellite monitoring of the urban heat island effect by the fusion of multi-temporal and multi-sensor remote sensed data:A 26-year case study of the city of Wuhan in China[J]. Remote Sensing of Environment, 2016,172:109-125.
doi: 10.1016/j.rse.2015.11.005
Xu F, Zhang X H, Li D , et al. Evaluation of the “white roof plan” for alleviating heat island effect[J]. Remote Sensing for Land and Resources, 2014,26(1):90-96.doi: 10.6046/gtzyyg.2014.01.16.
[22]
Xu L Y, Xie X D, Li S . Correlation analysis of the urban heat island effect and the spatial and temporal distribution of atmospheric particulates using TM images in Beijing[J]. Environmental Pollution, 2013,178:102-114.
doi: 10.1016/j.envpol.2013.03.006
[23]
Peng J, Xie P, Liu Y X , et al. Urban thermal environment dynamics and associated landscape pattern factors:A case study in the Beijing metropolitan region[J]. Remote Sensing of Environment, 2016,173:145-155.
doi: 10.1016/j.rse.2015.11.027
[24]
Wang J, Huang B, Fu D J , et al. Response of urban heat island to future urban expansion over the Beijing-Tianjin-Hebei metropolitan area[J]. Applied Geography, 2016,70:26-36.
doi: 10.1016/j.apgeog.2016.02.010
Yang K M, Zhou Y J, Qi J W , et al. Remote sensing estimating of urban impervious surface area and land surface temperature[J]. Remote Sensing for Land and Resources, 2014,26(2):134-139.doi: 10.6046/gtzyyg.2014.02.22.
[26]
北京市统计局.人口[EB/OL].( 2015- 11- 09)[2016-12-09]. .
[27]
NASA.Landsat 7 Science Data Users Handbook[EB/OL].( 2016 -08)[2016-12-09].
 2018, Vol. 30
  ), 王艳杰2,3,4, 张勇峰5, 张智宏6, 孙晨红7