

0 引言
本文以北京市密云区首云铁矿为研究区,利用无人机摄影测量技术(UAV structure from motion,SfM)获取不同时相的高精度数字地表模型(digital surface model,DSM),快速准确计算矿山动用储量,从而实现对储量的动态监控。与传统方法相比,该方法具有准确、快速、性价比高的特点,对于中小范围地区的矿山监测具有重要的推广价值。
1 研究区概况
首云铁矿属于密云铁矿的一部分,位于北京市密云区巨各庄镇境内,距北京80 km,属于较典型的丘陵地带。首云铁矿始建于1959年,1970年建成投产,是集采矿、选矿、竖炉焙烧连续生产工艺为一体的国有中型冶金矿山企业,曾隶属于北京市冶金局和首钢总公司,是原首钢铁矿冶金部重点矿山企业之一。
首云铁矿为露天开采,该矿区开采面积大约为1.5 km2,平均海拔为200 m,矿区植被稀少(图1),这些条件都为UAV遥感调查提供了良好的环境。在2014年8月—2016年10月期间,该矿山一直处于露天开采状态,并且该矿山矿石体重和矿石品位比较均匀,通过计算地表体积变化即可计算出矿山动用储量,这为UAV进行矿山储量监测提供了前提条件。
图1
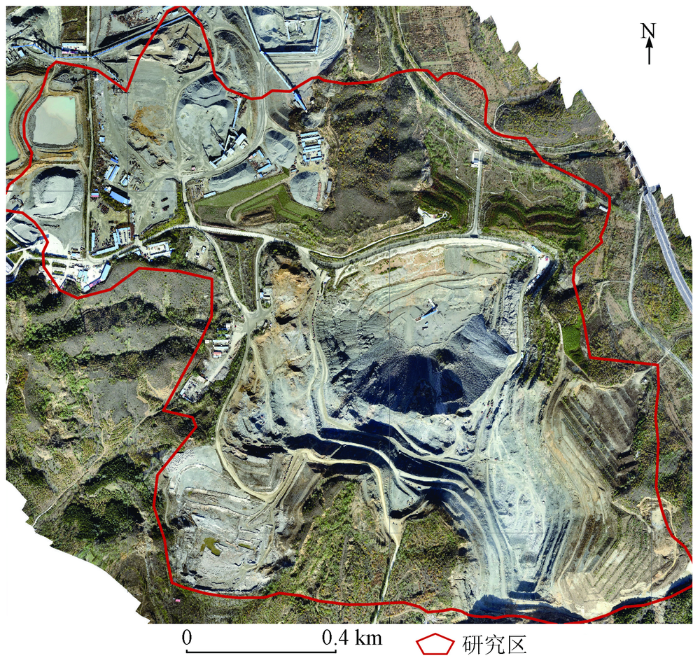
图1
北京市密云区首云铁矿位置
Fig.1
Location of Shouyun iron mine in Miyun district, Beijing
2 UAV数据获取与处理
2.1 UAV数据获取
本次工作分别于2014年8月和2016年10月对首云铁矿进行了UAV野外调查。2次UAV野外调查期间的天气晴朗无风,非常适合UAV飞行。另外,尽量选择正午期间进行飞行,减少了山体影像对结果的影响。2次UAV调查都采用台湾观天科技生产的X5型小型电动固定翼UAV,该UAV翼展为1.2 m,起飞重量为1.5 kg,有效载荷为300 g,续航时间可达40 min。UAV搭载的自驾仪和GPS可以实现按照规划航线自动飞行和定时、定距拍照; 机载POS系统可同步记录拍照时UAV姿态以用于数据后续处理; 搭载的相机为Sony QX100镜头,其基本参数如表1。
表1 UAV搭载数码相机基本参数
Tab.1
| 型号 | 重量/g | 空间分辨 率/ m | 焦距 /mm | 传感器尺 寸/mm | 数据大小/ 像素×像素 |
|---|---|---|---|---|---|
| Sony QX100 | 179 | 20.9 | 10.4~37.1 | 13.2 × 8.8 | 5 472 × 3 648 |
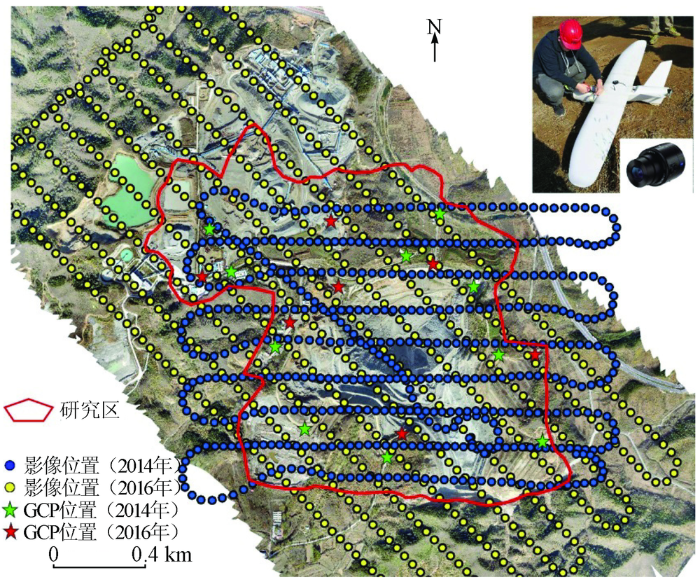
2次UAV调查飞行高度都设定为海拔450 m,设定航向重叠率80%,旁向重叠率60%。2014年8月的调查中获取了499张带POS信息的高清影像,实际航向重叠率81%,旁向重叠率62%; 2016年10月的调查过程中获取了674张带POS信息的高清影像,实际航向重叠率80%,旁向重叠率45%,并利用DGPS在特征明显且无变化的区域测定了7个控制点(ground control point,GCP)。UAV飞行航线如图2所示。
图2
2.2 UAV数据处理
UAV数据处理主要是为了得到高精度的DSM和高空间分辨率的数字正射影像图(digital orthophoto map,DOM)。近年来市场上涌现了一大批UAV遥感影像处理软件,如国内的DPGrid,PixelGrid和DPMatrix等,国外的PhotoScan,Pix4Dmapper和Inpho等[6]。
本次DOM的获取采用PhotoScan V1.2.5进行流程化处理,生成了高清的DOM。为方便后续计算,DSM获取采用如下步骤: ①在PhotoScan V1.2.5中预处理,其过程包括添加影像—加载POS点信息—对齐影像—生成网格—添加GCP—优化相机对齐方式—建立密集点云—生成点云数据; ②将导出的点云数据导入到cloud compare中,去除掉植被或一些噪声点; ③将处理好的点云数据导入到ArcGIS中,采用自然邻域法进行插值,生成空间分辨率为1 m的DSM [7]。
要进行地表变化的计算,2期DSM之间的配准极为重要,因为它会直接影响最后的研究精度。为此,本文首先利用DGPS测量的7个GCP数据,在ArcGIS中对2016年数据进行配准; 其次,对比2014年与2016年的DOM,在已配准完成的2016年数据上,选取特征明显且没有发生改变的点作为2014年的GCP; 最后,利用选取出的10个GCP配准2014年数据。采用这种方法不仅很好地解决了2014年控制点缺失的问题,也使得2期数据互相匹配,提高了后期地表变化计算的精度。
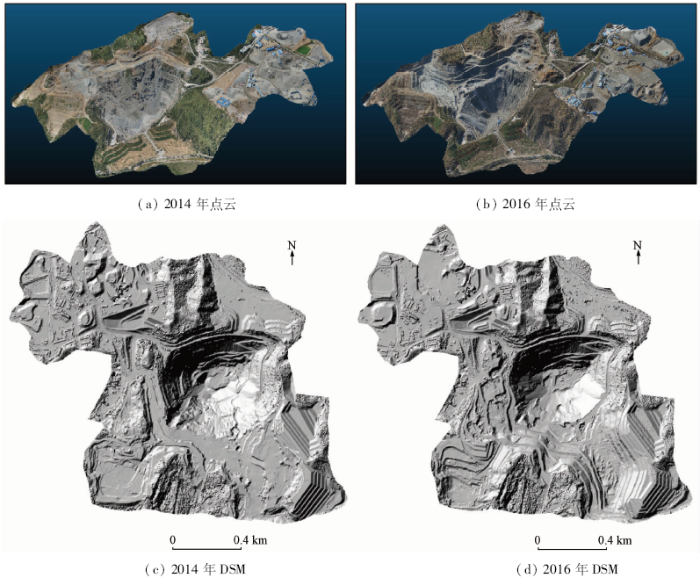
2014年和2016年2期UAV摄影测量获取的点云及DSM如图3所示。
图3
通过以上处理过程,获得了2期高清DOM与配准过后的1 m空间分辨率DSM。2016年DSM误差采用已经测定的7个GCP来计算均方根误差(root mean square error,RMSE)得到。由于2014年没有测量GCP,因此基于配准完成的2016年数据,在没有发现变化的稳定区域挑选出10个GCP来计算DSM误差。2014年8月DOM的空间分辨率可达到0.081 m, 获得的DSM误差为0.44 m; 2016年10月DOM的空间分辨率达到0.072 m,获得的DSM误差为0.24 m。2期DSM的误差都属于亚m级,能满足进行矿山储量估算的精度要求。
3 动用储量计算
但是,当用DSM来表示实际的地表模型时存在不确定性
式中:
2003年英国地貌学家Brasington等对于传播误差
式中:
为了更加准确地计算矿山动用储量,消除传播误差对于DoD结果的影响显得尤为重要,本文采用了最小检出限法和转换概率法2种方法进行计算。
3.1 最小检出限法
图4
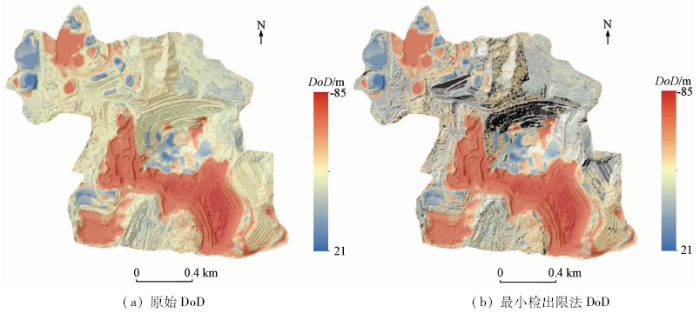
图4
最小检出限法计算地形变化结果
Fig.4
Results of DSM of difference by using the limit of detection method
通过对比图4(a)和(b)可以看出,最小检出限法所摒弃的信息主要分布在矿区中部和北部。从DOM上可以清晰地看到,该区域主要是道路与厂房,确实属于稳定非开采区域。矿山的主采区分布在矿坑南缘,尤其是中南部区域,开采造成的高程变化达到了80余m。矿山的堆积区主要分布在矿坑中部以及西北部,高程变化在20 m左右。
3.2 转换概率法
式中
图5
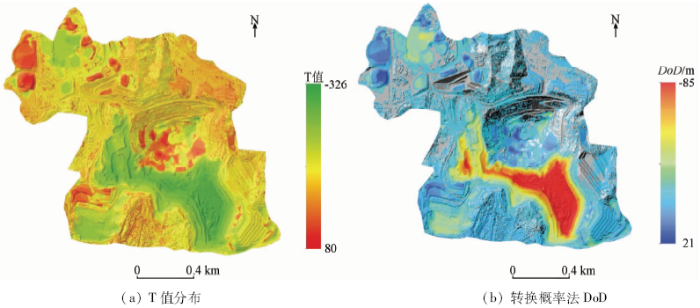
图5
转换概率法计算地形变化结果
Fig.5
Results of DSM of difference by using the converted probability method
图5结果可以看出,其主采区和堆积区分布与最小检出限法结果相同,摒弃的信息也主要分布在道路与厂房区域。但是,转换概率法摒弃了更多的信息量,其空值区域范围较大。
为了定量对比2种改进方法与原始DoD的计算结果,除了对比体积变化,还通过查询首云铁矿2014年8月—2016年10月间的开采报告,该地区铁矿石平均密度大约为4.8 t/m3,平均含矿率约为10%,矿石平均品位约为30%。将2种方法所计算得到的总体积变化分别乘以平均密度、平均含矿率和矿石平均品位即可估算出动用储量,计算结果如表2所示。
表2 不同方法计算储量变化结果对比
Tab.2
| 方法 | 堆积/m3 | 开挖/m3 | 总体积变化/m3 | 储量变化/t |
|---|---|---|---|---|
| 原始DoD | 1 325 479 | -14 633 968 | -13 308 489 | -1 916 422 |
| 最小检出限法(0.5 m) | 1 264 146 | -14 559 008 | -13 294 862 | -1 914 460 |
| 最小检出限法摒弃量 | 61 333 | -74 960 | -13 627 | -1 962 |
| 转换概率法(95%) | 1 262 525 | -14 556 857 | -13 294 332 | -1 914 384 |
| 转换概率法摒弃量 | 62 954 | -77 111 | -14 157 | -2 039 |
通过表2可以看到,储量体积变化比较接近(13 294 332~13 294 862 m3),并且都在一定程度上排除了误差对于体积变化的干扰(13 627~14 157 m3); 转换概率法采用95%作为置信区间所摒弃的信息,要大于最小检出限法以0.5 m为检出限所摒弃的信息。查询实际开采资料发现,2014年8月—2016年10月期间,首云铁矿的实际开采量约为180万t,本次研究2种方法的计算结果与矿山实际开采量都非常接近,其误差约为6.4%。
4 结论
本文将无人机摄影测量的方法运用于露天矿的储量动态监测中,以获取多时相、高空间分辨率的DSM为基础,利用最新的地形变化算法快速计算出矿山的体积变化,进而估算出矿山动用储量,为实现矿山科学管理提供了新的思路。主要结论如下:
1)通过2种地形变化算法计算出的动用储量体积,通过乘以该矿山平均含矿率、矿石平均体重以及矿石平均品位,估算的该期间动用储量与矿山实际开采量较为接近,误差仅为6.4%,证实了该方法的实用性。
2)由于金属矿产的品位、含矿率和密度具有一定的差异性,该方法的精度还有待进一步提高,目前更加适用于露天开采的煤矿或各类非金属矿产。另外,由于无人机续航能力的限制,该方法比较适合中小范围矿山的持续监测。
3)无人机不仅可以获得高空间分辨的DSM,还能方便快速地获取高清的DOM,基于DOM与DSM,还能进行矿山环境监测、灾害巡查、矿山施工管理和边坡设计与监测等。无人机摄影测量技术的运用为矿山监测和科学管理提供了全新的思路。
参考文献
无人机遥感系统的研究进展与应用前景
[J].
DOI:10.13203/j.whugis20140045
URL
Magsci
[本文引用: 1]

<b>目的</b>阐述了无人机遥感兴起的背景。从无人飞行平台、飞行姿态控制与导航、数据传输与存储、数据处理、传感器技术、空域使用政策等方面探讨了发展无人机遥感系统的基础、问题、研究进展和趋势。通过描述无人机遥感系统在大量相关行业领域的应用与实践,点出了发展无人机遥感系统的必要性与意义所在。最后,从科技、政策等方面给出了发展无人机遥感技术和产业的建议。
Research advance and application prospect of unmanned aerial vehicle remote sensing system
[J].
无人机遥感影像中农村房屋信息快速提取
[J].<p>针对无人机遥感技术应用中信息提取自动化、智能化不足的问题,提出了一种基于面向对象分割的农村房屋信息提取方法。该方法首先利用双边滤波器滤掉影像中的噪声,然后利用移动均值算法分割影像,最后根据分割后房屋对象的特征建立提取规则,对房屋信息进行提取。实验结果表明,该方法可有效提取无人机遥感影像中的农村房屋信息,平均提取精度约为92%。</p>
Rural residential area extraction from UAV remote sensing imagery
[J].
无人机影像局部增强方法及其在影像匹配中的应用
[J].<p>无人机影像的质量与成像时的光线、成像角度及所拍摄地物的特征有着密切关系。很多影像都存在着视觉对比度差、影像畸变大及分辨率低等缺点,给后续影像匹配和正射纠正带来困难。为了提高无人机影像的匹配效果,首先利用原始影像的离散灰度信息计算每个像元灰度值与整个影像灰度平均值的离散程度,并把影像划分为不同区域; 然后利用距离加权插值方法计算的变换函数对各区域影像进行不同程度的增强处理,对增强后影像的直方图进行修正; 最后利用核线约束法对影像进行匹配和均匀度检验。研究结果表明,由于增强后影像的灰度梯度差变大,在畸变较大及灰度变化较小的林地分布区域,影像的匹配成功率和均匀度都有一定程度的提高。</p>
Local enhancement method and its applications to UAV image matching
[J].
RS在矿山动态监测中的应用——以新疆稀有金属矿集区为例
[J].
DOI:10.11873/j.issn.1004-0323.2008.2.189
URL
Magsci
[本文引用: 1]
<p>研究了利用遥感技术开展矿山动态监测的方法与技术路线,即通过遥感图像的信息提取、解译,结合实地调查,对矿山开发状况和矿山生态环境进行客观的反映。通过对比分析不同时相遥感数据的解译结果,指出工作区存在部分违规采矿行为,很好地实现了对本区采矿行为及影像的动态监测。</p>
Application of remote sensing in the dynamic inspection of the mining:An example in the rare metal ore concentration area of Xinjiang
[J].
无人机摄影测量技术在新疆矿山储量动态监测中的应用
[J].
面向地质灾害调查的无人机遥感影像处理软件比较
[J].<p>为了给地质灾害调查中无人机(unmanned aerial vehicle,UAV)遥感影像处理软件的选择提供参考,对国内外使用较多的DPGrid,PixelGrid,DPMatrix和Inpho等4款软件进行了评价。以固定翼无人机搭载的Cannon 5D MARK Ⅱ相机获取的江西省龙南县丘陵地区1个架次644张无人机影像作为实验数据,由同一操作者在同一实验环境下分别使用上述4款软件进行了影像预处理、空三平差、数字高程模型(digital elevation model,DEM)生产及数字正射影像图(digital orthophoto map,DOM)生产等实验,从软件功能、效率、成果质量及操作流程等方面进行了对比分析。研究结果表明:4款软件都具有完整的无人机遥感影像处理功能。在利用原始数据生成正射影像的处理效率方面,从高到低依次是Inpho,DPMatrix,DPGrid和PixelGrid;在地质灾害应急调查方面,比较适宜使用DPGrid和DPMatrix进行快速拼图,而对于地质灾害详查,4款软件都能满足需要,其中DPGrid和PixelGrid更方便进行精度控制;在数据处理方面,影像匀光匀色适宜使用Inpho和DPGrid,DEM和DOM成果编辑适宜使用DPGrid。</p>
Comparison of UAV remote sensing imagery processing software for geological disasters monitoring
[J].
Open-pit mining geomorphic feature characterisation
[J].
DOI:10.1016/j.jag.2015.05.001
URL
[本文引用: 1]
Among the anthropogenic topographic signatures on Earth, open-pit mines are of great importance. Mining is of interest to geomorphologists and environmental researchers because of its implication in geomorphic hazards and processes. In addition, open-pit mines and quarries are considered the most dangerous industrial sector, with injuries and accidents occurring in numerous countries. Their fast, accurate and low-cost investigation, therefore, represents a challenge for the Earth science community. The purpose of this work is to characterise the open-pit mining features using high-resolution topography and a recently published landscape metric, the Slope Local Length of Auto-Correlation (SLLAC) (Sofia et al., 2014). As novel steps, aside from the correlation length, the terrace orientation is also calculated, and a simple empirical model to derive the percentage of artificial surfaces is tested. The research focuses on two main case studies of iron mines, both located in the Beijing district (P.R. China). The main topographic information (Digital Surface Models, DSMs) was derived using an Unmanned Aerial Vehicle (UAV) and the Structure from Motion (SfM) photogrammetric technique. The results underline the effectiveness of the adopted methodologies and survey techniques in the characterisation of the main mine geomorphic features. Thanks to the SLLAC, the terraced area given by open-cast/open-pit mining for iron extraction is automatically depicted, thus, allowing researchers to quickly estimate the surface covered by the open-pit. This information could be used as a starting point for future research (i) given the availability of multi-temporal surveys to track the changes in the extent of the mine; (ii) to relate the extent of the mines to the amount of processes in the area (e.g. pollution, erosion, etc.), and to (iii) combine the two points, and analyse the effects of the change related to changes in erosion. The analysis of the correlation length orientation also allows researchers to identify the terrace鈥檚 orientation and to understand the shape of the open-pit area. The tectonic environment and history, or inheritance, of a given slope can determine if and how it fails, and the orientation of the topographic surface or excavation face, with respect to geologic features, is of major significance. Therefore, the proposed approach can provide a basis for a large-scale and low-cost topographic survey for sustainable environmental planning and, for example, for the mitigation of environmental anthropogenic impacts due to mining.
Developments in monitoring and modelling small-scale river bed topography
[J].
DOI:10.1002/esp.3290190406
URL
[本文引用: 2]
Recent research in fluvial geomorphology has emphasized the spatially distributed feedbacks amongst river channel topography, flow hydraulics and sediment transport. Although understanding of the behaviour of dynamic river channels has been increased markedly through detailed within-channel process studies, less attention has been given to the accurate monitoring and terrain modelling of river channel form using three-dimensional measurements. However, such information is useful in two distinct senses. Firstly, it is one of the necessary boundary conditions for a physically based, deterministic modelling approach in which three-dimensional topography and river discharge drive within-channel flow hydraulics and ultimately spatial patterns of erosion and deposition and therefore channel change. Secondly, research has shown that an alternative means of estimating the medium-term bedload transport rate can be based upon monitoring spatial patterns of erosion and deposition within the river channel. This paper presents a detailed assessment of the distributed monitoring and terrain modelling of river bed topography using a technique that combines rigorous analytical photogrammetry with rapid ground survey. The availability of increasingly sophisticated terrain modelling packages developed for civil engineering application allows the representation of topographic information as a landform surface. Intercomparison of landform surfaces allows visualization and quantification of spatial patterns of erosion and deposition. A detailed assessment is undertaken of the quality of the morphological information acquired. This allow some general comments to be made concerning the use of more traditional methods to monitor and represent small-scale river channel morphology.
Accounting for uncertainty in DEMs from repeat topographic surveys:Improved sediment budgets
[J].
DOI:10.1002/esp.1886
URL
[本文引用: 1]
Repeat topographic surveys are increasingly becoming more affordable, and possible at higher spatial resolutions and over greater spatial extents. Digital elevation models (DEMs) built from such surveys can be used to produce DEM of Difference (DoD) maps and estimate the net change in storage terms for morphological sediment budgets. While these products are extremely useful for monitoring and geomorphic interpretation, data and model uncertainties render them prone to misinterpretation. Two new methods are presented, which allow for more robust and spatially variable estimation of DEM uncertainties and propagate these forward to evaluate the consequences for estimates of geomorphic change. The first relies on a fuzzy inference system to estimate the spatial variability of elevation uncertainty in individual DEMs while the second approach modifies this estimate on the basis of the spatial coherence of erosion and deposition units. Both techniques allow for probabilistic representation of uncertainty on a cell-by-cell basis and thresholding of the sediment budget at a user-specified confidence interval. The application of these new techniques is illustrated with 5 years of high resolution survey data from a 1 km long braided reach of the River Feshie in the Highlands of Scotland. The reach was found to be consistently degradational, with between 570 and 1970 m3 of net erosion per annum, despite the fact that spatially, deposition covered more surface area than erosion. In the two wetter periods with extensive braid-plain inundation, the uncertainty analysis thresholded at a 95% confidence interval resulted in a larger percentage (57% for 2004-2005 and 59% for 2006-2007) of volumetric change being excluded from the budget than the drier years (24% for 2003-2004 and 31% for 2005-2006). For these data, the new uncertainty analysis is generally more conservative volumetrically than a standard spatially-uniform minimum level of detection analysis, but also produces more plausible and physically meaningful results. The tools are packaged in a wizard-driven Matlab software application available for download with this paper, and can be calibrated and extended for application to any topographic point cloud (x,y,z). Copyright 漏 2009 John Wiley & Sons, Ltd.
Methodological sensitivity of morphometric estimates of coarse fluvial sediment transport
[J].
DOI:10.1016/S0169-555X(02)00320-3
URL
[本文引用: 2]
The estimation of fluvial sediment transport rate from measurements of morphological change has received growing recent interest. The revival of the ‘morphological method’ reflects continuing concern over traditional methods of rate determination but also the availability of new survey methods capable of high-precision, high-resolution topographic monitoring. Remote sensing of river channels through aerial digital photogrammetry is a potentially attractive alternative to labour intensive ground surveys. However, while photogrammetry presents the opportunity to acquire survey data over large areas, data precision and accuracy, particularly in the vertical dimension are lower than in traditional ground survey methods. This paper presents results of recent research in which digital elevation models (DEMs) have been developed for a reach of a large braided gravel-bed river in Scotland using both digital photogrammetry and high-resolution RTK GPS ground surveys. A statistical level of change detection is assessed by comparing surfaces with independent check points. The methodological sensitivity of the annual channel sediment budget (1999–2000) to the threshold is presented. Results suggest that while the remote survey methods employed here can be used to develop qualitatively convincing, moderate precision DEMs of channel topography (RMSE=±0.21 m), the remaining errors imply significant limits on reliable change detection which lead to important information losses. Tests at a 95% confidence interval for change detection show that over 60% of channel deposition and 40% of erosion may be obscured by the lower level of precision associated with photogrammetric monitoring when compared to ground survey measurements. This bias reflects the difficulty of detecting the topographic signature of widespread, but shallow deposition on bar tops.
Estimation of erosion and deposition volumes in a large,gravel-bed, braided river using synoptic remote sensing
[J].DOI:10.1002/(ISSN)1096-9837 URL [本文引用: 1]
