
0 引言
土壤湿度是土壤的重要组成成分,通过改变陆地表面与大气间的物质和能量平衡而影响气候变化,是气象学、水文学等科学研究中的关键参数之一。常规的土壤湿度站点观测虽然精度高,但耗时费力且观测站点稀疏,获取的土壤湿度数据只能代表站点附近小范围的土壤湿度,空间代表性较差。随着遥感技术的快速发展,卫星遥感为获取大范围、长期实时的土壤湿度数据提供了有力的技术支持,具有速度快、效率高的特点。目前,全球尺度的土壤湿度来源主要是主动、被动微波遥感以及模型模拟。通过被动微波遥感中卫星亮温数据反演或主动微波遥感中后向散射系数处理可快速获取大范围的土壤湿度数据,但受观测仪器噪声和反演模型的不确定性影响而含有较大的误差。为了有效利用遥感土壤湿度数据,需要了解其观测误差大小,但现实中缺少大范围、长时间的土壤湿度真值,因而无法直接对遥感土壤湿度数据误差进行估计。
传统获取土壤湿度误差特征的方法依赖于卫星反演资料与地面实际观测的验证,但是该方法有3个缺点[1]: 一是土壤湿度地面站点观测被限制在有限的空间范围内,获取的土壤湿度数据时间范围有限,甚至因为仪器故障等原因而时间不连续; 二是由于遥感数据中代表性误差和尺度转换误差的存在使遥感土壤湿度误差估计复杂化; 三是该方法被限制在估计两个土壤湿度数据间的差异大小,不能同时得到两者的误差估计。误差估计的另一个方法依赖于土壤湿度反演模型与误差传播途径,通过模型输入数据的误差得到模型模拟土壤湿度的误差估计[2,3],其优点是可以得到每个独立观测数据的误差估计,但是该方法得到的土壤湿度不确定性只能解释模型输入变量中的随机误差,并不能说明模型本身是否正确,因此不同的反演模型得到的土壤湿度不确定性很难作定量化比较。
国外对遥感土壤湿度数据的误差分析研究取得了一定的进展。TC是1998年由Stoffelen最早应用于海洋学科评估风和浪高观测[4],后来被引入遥感土壤湿度观测误差估计和遥感土壤湿度数据同化误差方差计算中。K Scipal[5]等利用TRMM微波辐射计、主动微波散射计ERS-2土壤湿度反演数据和ERA-Interim土壤湿度再分析资料,采用TC方法得到3种数据各自的误差方差估计; K Scipal[1]等利用ASCAT,AMSR-E和ERA-Interim再分析资料,通过TC方法得到3个数据各自全球范围的误差估计,实验结果表明TC方法具有稳健性并能生成客观的误差估计; D J Leroux[6]等使用TC方法对SMOS,AMSR-E(LPRM)和ASCAT全球尺度的土壤湿度数据误差进行估计,分析比较了SMOS土壤湿度数据与已存在的土壤湿度数据间的差异; M Tugrul Yilmaz[7]等基于TC方法,使用ASCAT,AMSR-E土壤湿度反演数据和NOAH模型土壤湿度模拟数据,探讨了TC方法中土壤湿度误差与真值独立,以及三者土壤湿度误差间相互独立这两个前提假设对TC结果的影响,结果表明这两个假设导致TC结果被低估,土壤湿度误差间相互独立的假设比土壤湿度误差与真值独立的假设对结果有更大的影响; WA Dorigo[8]等探讨了TC方法中主被动微波遥感数据的选择、被动微波遥感不同频率(C波段、X波段和Ku波段)选择以及参考数据选择对结果的影响; L J Renzullo[9]等采用集合卡尔曼滤波的同化方法,利用AWRA-L模型模拟以及AMSR-E,ASCAT土壤湿度数据,使用TC方法估计了澳大利亚研究区域AMSR-E和ASCAT土壤湿度的误差方差并在土壤湿度数据同化中使用,获得了良好的同化结果。
本文首先对TC方法进行了推导,然后利用TC方法对研究区域内ASCAT,AMSR-E遥感反演土壤湿度数据及ERA-Interim土壤湿度再分析资料的误差方差和信噪比进行估计,并对TC结果进行了分析,通过MODIS土地覆盖类型数据分析了3种土壤湿度数据误差与土地覆盖类型的关系,并以此说明TC结果的合理性。
1 TC方法
假设对未知的土壤湿度真值
式中,εASCAT,εAMSR-E和εERA代表均值为0的加性噪声,根据假设③,εASCAT,εAMSR-E和εERA相互独立,即它们相互之间的协方差为0; αASCAT,αAMSR-E和αERA表示3组数据相对于真值
根据文献[10],TC方法可分为做差法和求协方差法2种求解方法。做差法须事先从3个数据集中任选一个作为参考数据,将另外2个数据采用比例转换的方法转换到参考数据空间,这表明后面的计算都是在参考数据空间中进行的。此处推导中选取θASCAT为参考数据,将θAMSR-E和θERA采用式(2)比例变换的方法转换到θASCAT参考空间,记为
记
注意到3个数据集各自的误差均值为0且相互独立,因此<
将式(1)和式(4)带入式(2),经过比例转换后的
对上式两两做差相乘并取时间序列均值,得到式(6)。
记
虽然该方法误差方差估计是在
求协方差法与做差法的不同之处在于无须事先选择参考数据以及对数据进行比例转换。真值
由前文假设(3)和(4)可将式(8)简化为
由上式可得最终结果,即
Yilmaz[11]提到做差法对于一些实际应用(如数据同化)并不理想,值得注意的是求协方差法不仅可以得到3个数据的误差方差估计,还可以得到式(10),
实验采用求协方差法估计研究区域内ASCAT,AMSR-E和ERA-Interim土壤湿度数据的误差方差和信噪比(signal to noise ratio, SNR),并使用式(12)将3个土壤湿度数据的信噪比(fMSE)标准化至[0,1],即
计算结果
2 研究数据与方法
本文实验区域的位置为15°N~55°N,73°E~135°E,选取了2010年4月1日至2011年4月30日ASCAT,AMSR-E和ERA-Interim3种土壤湿度数据,ASCAT和AMSR-E土壤湿度的数值范围均为0~100,单位是百分数(%)。ERA-Interim土壤湿度单位是土壤体积含水量(mm3/mm3),将其采用最值线性变换的方法转换到百分数单位(%),即公式为
式中:
AMSR-E(Advanced Microwave Scanning Radiometer Earth Observing System)是改进型的多频段、双极化的被动微波辐射计,搭载于AQUA卫星在2002年5月发射升空,分为上午星(降轨)和下午星(升轨)。实验中使用的是阿姆斯特丹自由大学和NASA共同研发的土壤湿度反演产品,含C波段和X波段两种土壤湿度估算产品,反演模型是LPRM模型[15]。由土壤发射的微波信号波长越小越容易被植被冠层吸收,与X波段相比C波段对土壤湿度更为敏感,因此实验选取了C波段土壤湿度数据[8],空间分辨率为0.25°。需要注意的是,反演产品中除土壤湿度外还有植被含水量估计,实验中使用的AMSR-E数据是指地表0~1 cm的土壤湿度,不包含地表上层植被含水量。
ERA-Interim是欧洲中期天气预报中心第三代再分析资料,提供自1979年以来的全球再分析资料,并实时更新。与第二代ERA-40再分析资料的数据同化模型相比,ERA-Interim采用了四维变分分析(4D-Var),同化了包括浮标、卫星高度计等数据在内的大量观测数据,实现了再分析资料质量的提升[16]。其土壤湿度数据将土壤分为4层,分别为[0,7) cm,[7,28) cm,[28,100) cm和[100,289] cm,实验中选取了ERA表层0~7 cm的土壤湿度数据。
图1
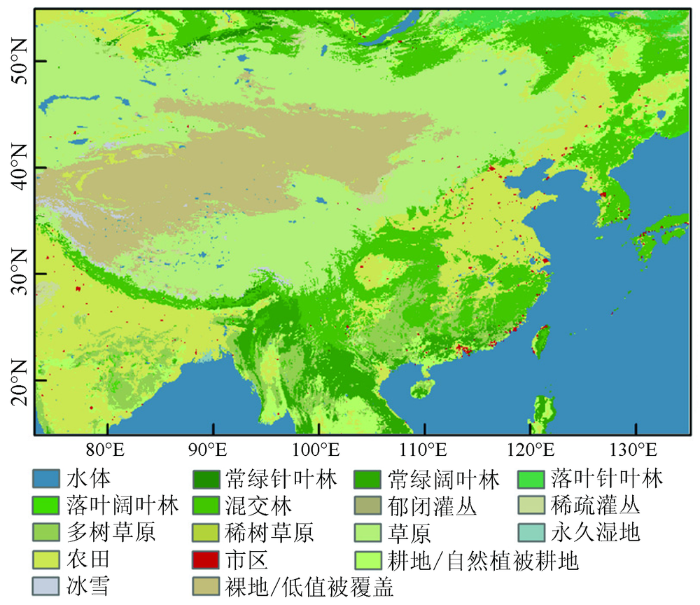
图1
2010年研究区域MODIS土地覆盖类型
Fig.1
2010 MODIS land cover type classification in study area
3 结果与分析
根据ASCAT,AMSR-E和ERA土壤湿度数据间的相关性判断是否对该地使用TC方法估计其误差方差和信噪比,因此首先分析了3种土壤湿度数据间的相关性。图2表示研究区域ASCAT,ERA和AMSR-E这3种土壤湿度数据相互间的相关系数。
图2
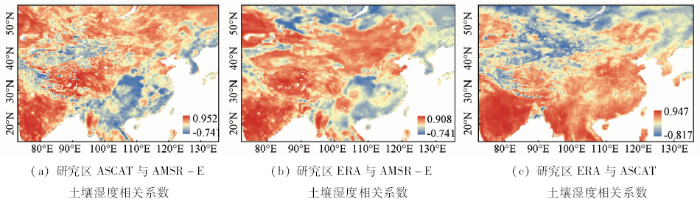
图2
研究区ERA,ASCAT及AMSR-E土壤湿度数据间相关系数
Fig.2
Correlation coefficient between ASCAT ,AMSR-E and ERA soil moisture in study area
可以看到ASCAT和AMSR-E在中国中部、新疆塔里木盆地和南部沿海区域土壤湿度的相关性差,在中国的青藏高原和印度的德干高原地区两者具有较高的相关性,研究区北部蒙古国地区两者的相关性也较好。ERA和AMSR-E土壤湿度在在中国中部、东南沿海以及研究区北部俄罗斯地区的相关性低,在其他地区的相关性较好。ERA和ASCAT土壤湿度在中国东南部以及中部地区相关性较高,在研究区北部俄罗斯和蒙古国地区、中国西北地区的相关性差,如中国新疆塔里木盆地的相关性甚至为负。
图3(a)(c)(e)分别表示研究区ERA、ASCAT和AMSR-E土壤湿度误差
图3
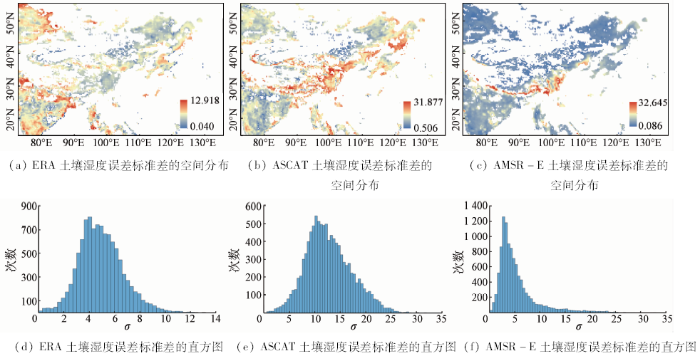
图3
研究区ERA,ASCAT和AMSR-E土壤湿度误差σ的空间分布及对应的直方图
Fig.3
The σ spatial distributions of ERA, ASCAT, AMSR-E soil moisture error and the corresponding histograms in study area
表1是ERA,ASCAT和AMSR-E土壤湿度误差的正态分布参数及置信区间估计(
表1
ERA,ASCAT和AMSR-E土壤湿度误差的正态分布参数及区间估计(
Tab.1
| 参数 | ||||
|---|---|---|---|---|
| ERA | 4.920 9 | [4.888 0, 4.953 9] | 1.727 6 | [1.704 6, 1.751 2] |
| ASCAT | 12.728 9 | [12.6437, 12.81 4] | 4.468 4 | [4.409 0, 4.529 4] |
| AMSR-E | 5.214 6 | [5.141 5, 5.287 7] | 3.834 5 | [3.783 6, 3.886 9] |
图4
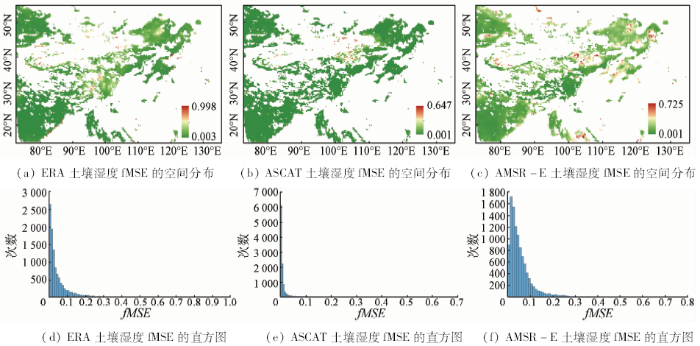
图4
研究区ERA,ASCAT和AMSR-E土壤湿度fMSE空间分布及对应的直方图
Fig.4
fMSE spatial distributions of ERA, ASCAT, AMSR-E soil moisture and corresponding histograms in study area
由图4可知3种土壤湿度数据的fMSE绝大部分数值较小,这说明观测信号中噪声信息较少。ASCAT土壤湿度的fMSE最小,说明其信噪比最高,除了在中国内蒙古高原西部和蒙古国中部地区的fMSE值较高外,ASCAT在其他地区的fMSE的值都普遍较低。ERA的fMSE高值集中在沿海地区,如中国渤海湾和山东半岛南部沿海地区、印度的德干高原东部沿海区,有的甚至达到了0.998,说明这些地区观测信号中掺杂了比例很高的噪声,这可能是ERA再分析资料处理海洋—陆地交界处的土壤湿度过程中由重采样等过程因素造成的。AMSR-E土壤湿度的fMSE较大值空间分布较为分散,仍可观察到中国内蒙古高原西部、松嫩平原附近以及泰国、老挝少部分地区fMSE值较高。
ASCAT是微波散射计,以主动方式发射连续的或脉冲形式的电磁波并接受散射回波, 而AMSR-E是微波辐射计,以被动方式接收来自地物目标的电磁辐射,虽然两者接受的观测信号中均会有地表覆盖植被电磁辐射的噪声影响,但是从理论上讲ASCAT比AMSR-E观测到更多的地物目标信息,因此ASCAT的信噪比理论上讲应比AMSR-E高,这与实验结果是相符的。
表2表示ERA,ASCAT和AMSR-E这3种土壤湿度数据误差
表2 土地覆盖类型与ERA,ASCAT和AMSR-E土壤湿度误差σ
Tab.2
| 类型 | ERA | ASCAT | AMSR-E | ||||||
|---|---|---|---|---|---|---|---|---|---|
| min~Q1① | Q1~Q3 | Q3~max | min~Q1 | Q1~Q3 | Q3~max | min~Q1 | Q1~Q3 | Q3~max | |
| 常绿阔叶林 | 65 | 51 | 19 | 18 | 79 | 38 | 0 | 25 | 110 |
| 混交林 | 147 | 148 | 68 | 33 | 129 | 201 | 1 | 40 | 322 |
| 稀疏灌丛 | 17 | 50 | 36 | 31 | 49 | 23 | 32 | 70 | 1 |
| 多树草原 | 199 | 306 | 77 | 180 | 311 | 91 | 4 | 278 | 300 |
| 草原 | 1 207 | 2 639 | 789 | 792 | 2 483 | 1 360 | 1 862 | 2 055 | 718 |
| 农田 | 433 | 1 412 | 1 354 | 954 | 1 641 | 604 | 178 | 2 022 | 999 |
| 耕地/自然植被镶嵌 | 77 | 242 | 192 | 105 | 296 | 110 | 29 | 350 | 132 |
| 裸地/低植被覆盖 | 477 | 416 | 92 | 515 | 272 | 198 | 535 | 421 | 29 |
①Q1指较小四分位数,Q3指较大四分位数,min指数据最小值,max指数据最大值。
4 结论
本文基于TC方法,使用ERA-Interim土壤湿度再分析资料、ASCAT和AMSR-E土壤湿度反演数据得到研究区域(15°N~55°N,73°E~135°E)内3种土壤湿度数据的误差方差和信噪比估计,结合MODIS土地覆盖类型数据对3种土壤湿度数据的误差方差进行了分析,主要结论如下:
1)植被覆盖会影响遥感土壤湿度的TC误差方差估计。研究区内东南亚、中国东南和中部地区植被覆盖较为茂盛,导致土壤湿度遥感观测具有较大误差,3种土壤湿度间的相关性较差,致使TC方法无法准确估计这些地区的土壤湿度误差方差和信噪比。
2)从TC误差方差估计值来看,ERA土壤湿度误差的均值和方差最低,精度最高, AMSR-E土壤湿度精度低于ERA高于ASCAT,ASCAT土壤湿度数据精度最低。但需要注意的是,这里的比较是依据TC结果判断的,TC结果并没有覆盖全部研究区域。
3)TC方法得到的3种土壤湿度数据的fMSE均较小,这表明ERA,ASCAT和AMSR-E土壤湿度观测数据中噪声所占比例很低。从观测到的信号来看,ASCAT的fMSE值相对较低,信噪比最高; ERA的fMSE高于ASCAT低于AMSR-E,ERA土壤湿度的fMSE高值集中在海洋—陆地交界区域,这可能是ERA再分析资料重采样等过程因素造成的; AMSR-E的信噪比最低,观测信号中噪声相对ASCAT和ERA来说较高。主动微波ASCAT从理论上讲信噪比高于被动微波AMSR-E,与实验结果一致。
4)通过MODIS土地覆盖类型数据与TC结果的分析可知,TC方法得到的研究区域土壤湿度误差估计多分布在草原、农田和裸地,TC方法能够得到较为真实客观的土壤湿度误差方差估计。
需要注意的是,本实验中3种土壤湿度数据的观测深度以及观测时间并不完全一致,这会对实验结果有一定影响; TC方法假设观测误差在一定时间内是恒定的,这并不符合实际的情况; TC方法以每个像元为处理单元,这就表示TC方法的土壤湿度误差方差估计结果没有考虑不同像元土壤湿度的空间相关性。如何对TC方法中这些缺陷进行改进是我们下一步的工作内容。
参考文献
Triple collocation:A new tool to determine the error structure of global soil moisture products
[C]//
An improved soil moisture retrieval algorithm for ERS and METOP scatterometer observations
[J].DOI:10.1109/TGRS.2008.2011617 URL [本文引用: 1]
Meesters A G C A,Liu Y Y,et al.Error estimates for near-real-time satellite soil moisture as derived from the land parameter retrieval model
[J].DOI:10.1109/LGRS.2011.2114872 URL [本文引用: 1]
Toward the true near-surface wind speed:Error modeling and calibration using triple collocation
[J].DOI:10.1029/97JC03180 URL [本文引用: 1]
A possible solution for the problem of estimating the error structure of global soil moisture data sets
[J].
Estimating SMOS error structure using triple collocation
[C]//
Evaluation of assumptions in soil moisture triple collocation analysis
[J].
DOI:10.1175/JHM-D-13-0158.1
URL
[本文引用: 1]

Triple collocation analysis (TCA) enables estimation of error variances for three or more products that retrieve or estimate the same geophysical variable using mutually-independent methods. Several statistical assumptions regarding the statistical nature of errors (e.g., mutual independence and orthogonality with respect to the truth) are required for TCA estimates to be unbiased. Even though soil moisture studies commonly acknowledge that these assumptions are required for an un-biased TCA, no study has specifically investigated the degree to which errors in existing soil moisture datasets conform to these assumptions. Here we evaluate these assumptions both analytically and numerically over four extensively-instrumented watershed sites using soil moisture products derived from active microwave remote sensing, passive microwave remote sensing, and a land surface model. Results demonstrate that non-orthogonal and error-cross-covariance terms represent a significant fraction of the total variance of these products. However, the overall impact of error cross-correlation on TCA is found to be significantly larger than the impact of non-orthogonal errors. Due to the impact of cross-correlated errors, TCA error estimates generally underestimate the true random error of soil moisture products.
Error characterisation of global active and passive microwave soil moisture data sets
[J].
DOI:10.5194/hess-14-2605-2010
URL
[本文引用: 2]
Understanding the error structures of remotely sensed soil moisture products is essential for correctly interpreting observed variations and trends in the data or assimilating them in hydrological or numerical weather prediction models. Nevertheless, a spatially coherent assessment of the quality of the various globally available data sets is often hampered by the limited availability over space and time of reliable in-situ measurements. This study explores the triple collocation error estimation technique for assessing the relative quality of several globally available soil moisture products from active (ASCAT) and passive (AMSR-E and SSM/I) microwave sensors. The triple collocation technique is a powerful tool to estimate the root mean square error while simultaneously solving for systematic differences in the climatologies of a set of three independent data sources. In addition to the scatterometer and radiometer data sets, we used the ERA-Interim and GLDAS-NOAH reanalysis soil moisture data sets as a third, independent reference. The prime objective is to reveal trends in uncertainty related to different observation principles (passive versus active), the use of different frequencies (C-, X-, and Ku-band) for passive microwave observations, and the choice of the independent reference data set (ERA-Interim versus GLDAS-NOAH). The results suggest that the triple collocation method provides realistic error estimates. Observed spatial trends agree well with the existing theory and studies on the performance of different observation principles and frequencies with respect to land cover and vegetation density. In addition, if all theoretical prerequisites are fulfilled (e.g. a sufficiently large number of common observations is available and errors of the different data sets are uncorrelated) the errors estimated for the remote sensing products are hardly influenced by the choice of the third independent data set. The results obtained in this study can help us in developing adequate strategies for the combined use of various scatterometer and radiometer-based soil moisture data sets, e.g. for improved flood forecast modelling or the generation of superior multi-mission long-term soil moisture data sets.
Continental satellite soil moisture data assimilation improves root-zone moisture analysis for water resources assessment
[J].DOI:10.1016/j.jhydrol.2014.08.008 URL [本文引用: 1]
Recent advances in(soil moisture) triple collocation analysis
[J].
DOI:10.1016/j.jag.2015.09.002
URL
[本文引用: 2]
To date, triple collocation (TC) analysis is one of the most important methods for the global-scale evaluation of remotely sensed soil moisture data sets. In this study we review existing implementations of soil moisture TC analysis as well as investigations of the assumptions underlying the method. Different notations that are used to formulate the TC problem are shown to be mathematically identical. While many studies have investigated issues related to possible violations of the underlying assumptions, only few TC modifications have been proposed to mitigate the impact of these violations. Moreover, assumptions, which are often understood as a limitation that is unique to TC analysis are shown to be common also to other conventional performance metrics. Noteworthy advances in TC analysis have been made in the way error estimates are being presented by moving from the investigation of absolute error variance estimates to the investigation of signal-to-noise ratio (SNR) metrics. Here we review existing error presentations and propose the combined investigation of the SNR (expressed in logarithmic units), the unscaled error variances, and the soil moisture sensitivities of the data sets as an optimal strategy for the evaluation of remotely-sensed soil moisture data sets.
The optimality of potential rescaling approaches in land data assimilation
[J].
DOI:10.1175/JHM-D-12-052.1
URL
[本文引用: 1]
It is well-known that systematic differences exist between modeled and observed realizations of hydrological variables like soil moisture. Prior to data assimilation, these differences must be removed in order to obtain an optimal analysis. A number of rescaling approaches have been proposed for removing systematic dfferences between models and observations. These methods include rescaling techniques based on: matching sampled temporal statistics (i.e. variance), minimizing the least-squares distance between observations and models, and the application of triple collocation. Here we evaluate the optimality and relative performances of these rescaling methods both analytically and numerically and find that a triple collocation-based rescaling method results in an optimal solution whereas variance matching- and least squares-regression approaches result in only approximations to this optimal solution.
Chapter 17: Scaling and Filtering Approaches for the use of Satellite Soil Moisture Observations
[M] //
ASCAT soil moisture:An assessment of the data quality and consistency with the ERS scatterometer heritage
[J].DOI:10.1175/2008JHM1051.1 URL [本文引用: 1]
The ASCAT soil moisture product:A review of its specifications,validation results, and emerging applications
[J].DOI:10.1127/0941-2948/2013/0399 URL [本文引用: 1]
Multisensor historical climatology of satellite-derived global land surface moisture
[J].
DOI:10.1029/2007JF000769
URL
[本文引用: 1]
[1] A historical climatology of continuous satellite-derived global land surface soil moisture is being developed. The data consist of surface soil moisture retrievals derived from all available historical and active satellite microwave sensors, including Nimbus-7 Scanning Multichannel Microwave Radiometer, Defense Meteorological Satellites Program Special Sensor Microwave Imager, Tropical Rainfall Measuring Mission Microwave Imager, and Aqua Advanced Microwave Scanning Radiometer for EOS, and span the period from November 1978 through the end of 2007. This new data set is a global product and is consistent in its retrieval approach for the entire period of data record. The moisture retrievals are made with a radiative transfer-based land parameter retrieval model. The various sensors have different technical specifications, including primary wavelength, spatial resolution, and temporal frequency of coverage. These sensor specifications and their effect on the data retrievals are discussed. The model is described in detail, and the quality of the data with respect to the different sensors is discussed as well. Examples of the different sensor retrievals illustrating global patterns are presented. Additional validation studies were performed with large-scale observational soil moisture data sets and are also presented. The data will be made available for use by the general science community.
The ERA-interim archive:Version 2.0
[J].[Article in Japanese]
Soil moisture estimation through ASCAT and AMSR-E sensors:An intercomparison and validation study across Europe
[J].DOI:10.1016/j.rse.2011.08.003 URL [本文引用: 1]
From near-surface to root-zone soil moisture using an exponential filter:An assessment of the method based on in-situ observations and model simulations
[J].DOI:10.5194/hess-12-1323-2008 URL [本文引用: 1]
MODIS collection 5 global land cover:Algorithm refinements and characterization of new datasets
[J].
DOI:10.1016/j.rse.2009.08.016
URL
[本文引用: 1]
Information related to land cover is immensely important to global change science. In the past decade, data sources and methodologies for creating global land cover maps from remote sensing have evolved rapidly. Here we describe the datasets and algorithms used to create the Collection 5 MODIS Global Land Cover Type product, which is substantially changed relative to Collection 4. In addition to using updated input data, the algorithm and ancillary datasets used to produce the product have been refined. Most importantly, the Collection 5 product is generated at 500-m spatial resolution, providing a four-fold increase in spatial resolution relative to the previous version. In addition, many components of the classification algorithm have been changed. The training site database has been revised, land surface temperature is now included as an input feature, and ancillary datasets used in post-processing of ensemble decision tree results have been updated. Further, methods used to correct classifier results for bias imposed by training data properties have been refined, techniques used to fuse ancillary data based on spatially varying prior probabilities have been revised, and a variety of methods have been developed to address limitations of the algorithm for the urban, wetland, and deciduous needleleaf classes. Finally, techniques used to stabilize classification results across years have been developed and implemented to reduce year-to-year variation in land cover labels not associated with land cover change. Results from a cross-validation analysis indicate that the overall accuracy of the product is about 75% correctly classified, but that the range in class-specific accuracies is large. Comparison of Collection 5 maps with Collection 4 results show substantial differences arising from increased spatial resolution and changes in the input data and classification algorithm.
