

0 引言
自党的十八大提出“生态文明建设”以来,中央及地方政府高度重视生态环境的保护,逐步开展了生态红线划定的试点工作。生态服务功能评估是生态红线划定的前提与基础,多年来一直是生态学研究领域的热点。1970年,关键环境问题研究(study of critical environmental problems,SCEP)报告中首次提出了“服务功能”的概念[1]; 后来Costanza等[2]对生态服务功能的概念和分类做了详细的介绍,主要分为供给服务、调节服务、文化服务以及维持其他类型服务所必须的支持服务4种类型。我国学者也对生态服务功能定义展开了大量研究,欧阳志云等[3]将生态服务功能定义为“生态系统与生态过程所形成及所维持的人类赖以生存的自然环境条件与效用”; 董全[4]定义生态服务功能为“自然过程所产生和维持的有关环境资源的各种条件和服务”。
近年来,在明确了生态服务功能定义的基础上,涌现了大量生态服务功能评估模型。基于遥感(remote sensing,RS)与地理信息系统(geographic information system,GIS)的评估模型发展最为迅速,RS为生态服务功能评估模型提供了水平、垂直、多光谱、多时段、多尺度的景观信息,减少了大量的野外调查工作[5],在生物多样性评估与监测中应用广泛[6,7,8]; GIS拥有强大的空间分析能力,为生态服务功能可视化和空间相关分析提供有效的解决手段,大量的学者将其应用于水土保持、水源涵养和碳存储功能等定量评估领域[9,10,11,12]。在评估模型研究日渐成熟的基础上,重要生态服务功能区划定成为了研究热点。香宝等[13]运用RS和GIS技术,采用专家打分的综合指标法对成渝区生态服务功能重要性进行分级评价,划定了重要生态服务功能区; 李月臣等[14]在单一服务功能评估结果基础上构建生态服务功能重要性指数,采用自然间断分割法确定了重要生态服务功能区。以往研究中大多只考虑生态服务功能的重要性,或者注重某斑块功能的高低,较少考虑保护的高效性和斑块在区域内的地位。国家原环境保护部2017年颁发的《生态保护红线划定技术指南》中将包含单项生态服务功能评估结果总量50%的区域划定为该项服务功能极重要区,合并叠加各项生态服务功能极重要区组成生态服务功能重要区[15]。鉴于此,本研究以四川省万源市为例,结合山区特殊性,借助RS和GIS技术,对主要生态服务功能,即生物多样性保护功能、水土保持功能和水源涵养功能等进行快速评估,在评估结果基础上计算生态保护效益系数,划定该研究区重要生态服务功能区,为生态保护方案的制定提供科学依据。
1 研究区概况及数据源
1.1 研究区概况
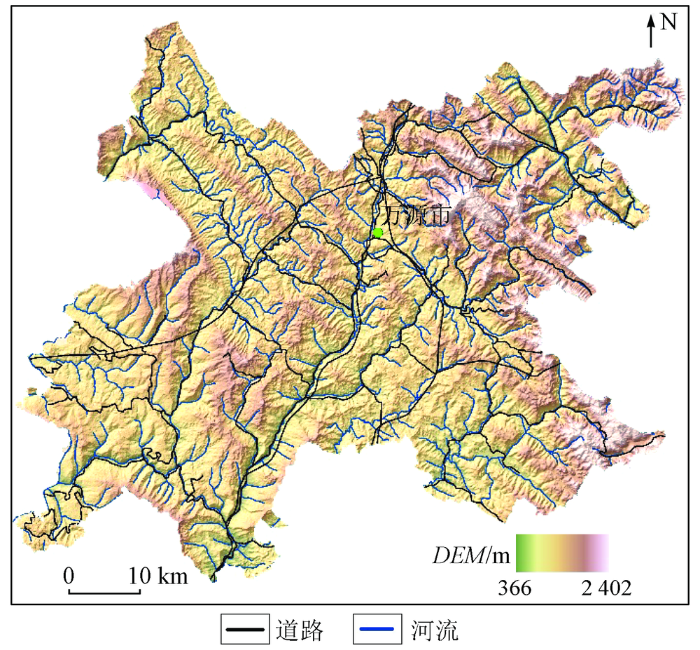
本文研究区万源市为四川省辖县级市,位于川东北大巴山腹心区,位置界于N30°39'~32°20',E107°28'~108°31'之间,下辖12个镇和40个乡,面积约为4 065 km2。研究区地处中国南北气候的分界线和嘉陵江、汉江分水岭地带,且位于川、陕、渝三省(市)的结合部,是进出四川的重要门户,也是连接川陕渝经济、文化、交通的重地,享有“万宝之源”的美誉(图1)。区内地形起伏大,沟壑纵横,潜在水土流失量大,多年平均降雨量为1 169 mm,降雨集中于每年7—8月份。区内物种丰富,拥有岩羊、珙桐和红豆杉等国家一、二级重点保护动植物; 同时拥有丰富的煤矿、石灰石和硒等重要资源。然而,随着国民经济的快速发展,动植物多样性保护与资源开采面临着不可避免的矛盾,因此有必要对辖区进行生态服务功能评估,以辅助资源的合理开发决策。
图1
1.2 数据源
图2
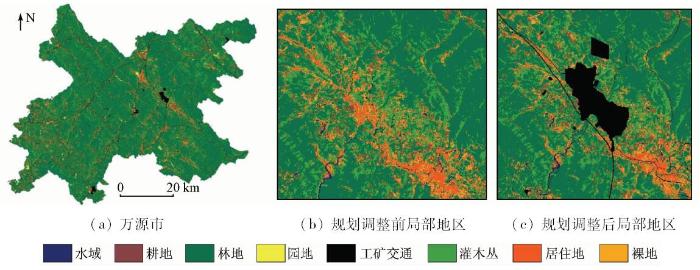
为提高数据的准确性,利用已有的规划数据对解译结果进行了检查与调整,图2(b)—(c)示出部分区域规划调整前后的差异。降雨数据采用四川省127个气象站点的降雨量监测数据,其时间跨度为2010—2015年(分5期),含月降雨量。通过克吕金空间插值,得到全省降雨分布数据,然后计算降雨侵蚀力。数字高程模型(digital elevation model,DEM)来源于中国地理空间数据云,采样间隔为30 m。土壤数据来源于四川省土壤属性数据库,数据包含土壤中各种物质的含量,通过GIS技术转换成了栅格数据格式。
2 生态服务功能区划定方法
2.1 技术路线
中国疆域广阔,自然地理环境复杂,各种典型地貌的重要生态服务功能区划定技术方法仍处于探索研究阶段,暂无统一的技术参考。本研究针对四川省东北部山区的独特地理环境,结合RS和GIS技术优势,基于景观尺度对重要生态服务功能区进行识别研究。划定方法遵循管理的合理性与管理资源最优化分配原则,在功能区划定过程中既保证斑块的高聚集性,又保证在管理成本最小的情况下能达到最优生态效益,以便主管部门进行片区化管理监督与任务下达。总体方法流程如图3。
图3

2.2 生态服务功能评估模型
2.2.1 生物多样性保护功能评估方法
傅伯杰等[17]在郭中伟等[5]研究的基础上进行了大量研究,构建了适用于中国的生物多样性与生态系统服务评估指标体系。该体系以压力、状态和响应3个指标表征生态系统的生物多样性,因此研究通过栖息地及其胁迫源之间的相互作用来模拟栖息地生存环境质量,用该质量作为生物多样性定量评估指标。研究采用生态系统服务功能综合估价和权衡得失评估模型(integrated valuation of environmental services and tradeoffs,InVEST)中的生物多样性评估模块进行生物多样性保护功能的评估,该模型在国内外生态系统服务功能评估中得到了普遍应用,是主流生态评估模型,计算公式为[18]
式中:
则k值等于
式中: ry为像元
式中:
表1 生态胁迫因子
Tab.1
| 胁迫因子 | 最大胁迫距离/km | 权重 | 衰退 |
|---|---|---|---|
| 居住地 | 1.50 | 0.60 | 0 |
| 工矿交通 | 3.00 | 0.75 | 0 |
| 耕地 | 0.50 | 0.35 | 0 |
表2 不同生态系统对胁迫因子的敏感性
Tab.2
| 生态系 统类型 | 适宜生物 栖息分数 | 居住地 | 工矿交通 | 耕地 |
|---|---|---|---|---|
| 林地 | 1.00 | 0.80 | 0.75 | 0.70 |
| 灌木丛 | 0.80 | 0.80 | 0 | 0.20 |
| 园地 | 0.80 | 0.80 | 0 | 0.20 |
| 水域 | 1.00 | 0.90 | 0 | 0.85 |
| 耕地 | 0.40 | 0 | 0 | 0.40 |
| 居住地 | 0 | 0 | 0 | 0 |
| 工矿交通 | 0 | 0 | 0 | 0 |
| 裸地 | 0.10 | 0.20 | 0.40 | 0.10 |
2.2.2 水土保持功能评估方法
水土保持功能评估模型采用改进的通用水土流失方程进行评价,计算公式为[21]
式中:
降雨侵蚀力
式中:
式中
式中:
坡长L与坡度α是水土流失的主控因子之一,地表起伏度变化越大的区域值越大。小尺度研究中可以通过实地测量获得,但万源市属于山区,地形复杂,是典型的大尺度复杂研究区域,因此根据数字高程确定坡长坡度因子LS的计算方法为[26]
2.2.3 水源涵养功能评估方法
水源涵养功能评估采用降水贮存量法,即用生态系统的蓄水效应来衡量其涵养水分的功能[28],具体为
表3 生态系统减少径流的效益系数
Tab.3
| Ⅱ级分类 | Y | Ⅱ级分类 | Y | |
|---|---|---|---|---|
| 林地 | 0.39 | 耕地 | 0.16 | |
| 灌木丛 | 0.273 | 居住地 | 0.12 | |
| 园地 | 0.24 | 工矿交通 | 0.1 | |
| 水域 | 1 | 裸地 | 0.14 |
2.3 生态保护效益系数
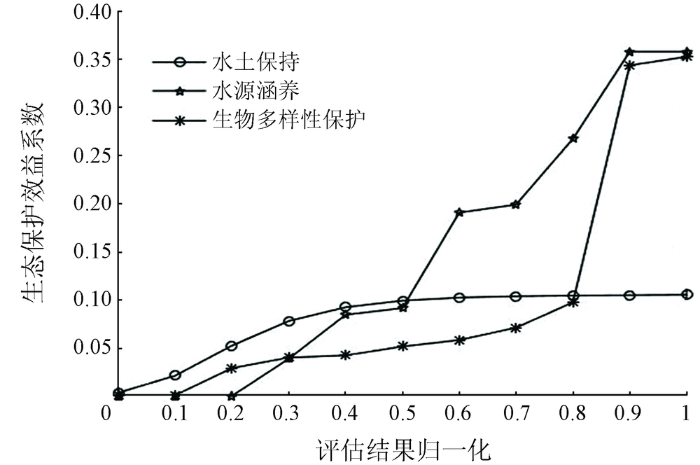
重要生态服务功能区的划定需考虑生态管理部门的工作高效性与管理工作效益最大化原则,本文提出了生态保护效益系数计算方法,根据评估结果设定合理的分割阈值,然后确定相应生态服务功能重要区的备选区域,最后将3个服务功能备选区域合并,对合并结果做小斑块的去除优化处理得到最终重要生态服务功能区。其中分割阈值通过分析生态保护效益系数曲线得到,曲线到达增长拐点时确定最佳分割阈值,生态保护效益系数计算公式为
式中:
3 评估结果分析
3.1 生态服务功能评估结果
图4
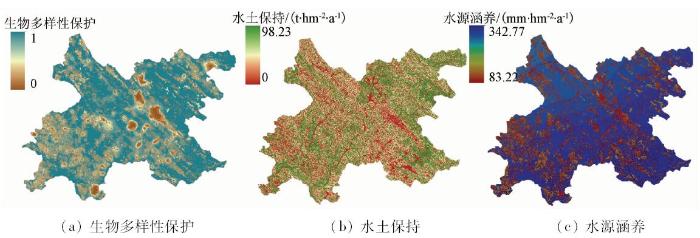
表4 水土保持、水源涵养功能统计
Tab.4
| 生态系统 类型 | 水土保持 量/万t | 占水土保持总 量百分比/% | 水源涵养 量/亿t | 占水源涵养总 量百分比/% |
|---|---|---|---|---|
| 林地 | 737.22 | 71.27 | 8.34 | 71.82 |
| 灌木丛 | 208.68 | 20.17 | 2.17 | 18.70 |
| 园地 | 4.81 | 0.46 | 0.04 | 0.36 |
| 水域 | 5.77 | 0.56 | 0.41 | 3.50 |
| 耕地 | 50.16 | 4.85 | 0.37 | 3.14 |
| 居住地 | 5.80 | 0.56 | 0.07 | 0.60 |
| 工矿交通 | 6.11 | 0.59 | 0.04 | 0.32 |
| 裸地 | 15.91 | 1.54 | 0.18 | 1.56 |
生物多样性指数评估结果表明,在人迹罕见的地方生物多样性保护功能较高,在城镇区域生物物种结构单一,生物多样性保护功能较低。从3种功能综合分析可以看出,万源市生态服务功能较好,符合其实际情况。水源涵养功能最高值和最低值分别为342.77 mm/(hm2∙a)和83.22 mm/(hm2∙a),较低值主要分布在居住地和工矿交通等人工地表区域。水土保持能力方面,万源市土壤保持量普遍偏低,最高为98.23 t/(hm2∙a),主要分布在植被覆盖度较高的林地区域,最低为0 t/(hm2∙a),主要分布在低海拔、地势较平且不发生潜在水土流失的区域和水域。其中万源市西北部的高山区域潜在水土流失量较大,但由于近年来实施的环保政策提高了该区域植被覆盖度,改善了水土保持功能。通过野外实地调查,并用2011年全国第一次水利普查结果验证,评估结果符合实际情况。
评估结果归一化后设定不同的分割阈值从而计算生态保护效益系数,计算结果如图5所示。从图中可知,当生物多样性分割阈值为0.9时,生态保护效益系数最大,此时生物多样性保持功能重要区面积为1 509.76 km2; 水土保持分割阈值为0.4,效益系数增速变缓,得到最大生态保护效益系数,由此水土保持功能重要区面积为1 236.20 km2; 水源涵养分割阈值为0.9,得到最大生态保护效益系数,水源涵养功能重要区面积为1 669.81 km2。
图5
3.2 重要生态服务功能区空间分布特征
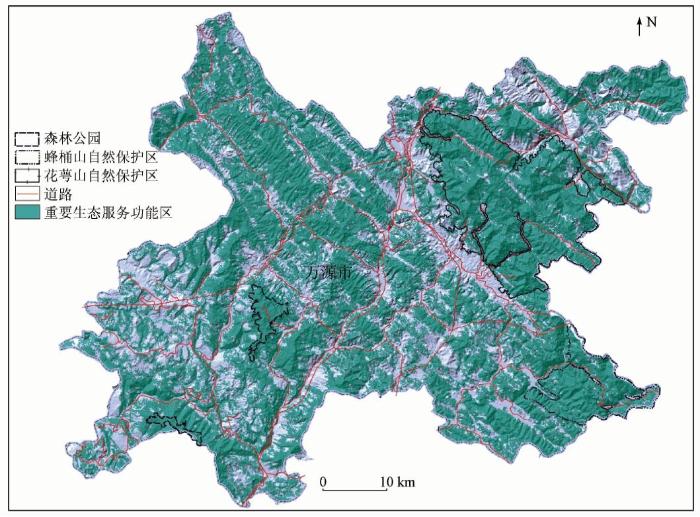
根据生态服务功能评估结果,计算分割阈值得到3种服务功能备选区,合并、优化后得到万源市重要生态服务功能区。将该重要区域与已有自然保护区与森林公园叠加分析,结果表明,花萼山、蜂桶山自然保护区和森林公园被纳入重要区的面积比例分别为88.28%,85.84%和97.61%,与重要生态服务功能区重合度较高(图6)。经过统计得知,重要生态服务功能区总面积为2 651.99 km2,占研究区面积65.4%; 主要分布在海拔800 m以上的区域。该海拔以上的区域植被覆盖度高,人口密度相对较小,许多区域很少有人类活动,未造成原始地表覆盖的破坏,适宜野生动植物的生存; 其次林地、灌木丛等植被根系对水土保持、水源涵养具有较强的保持功能,降低了河流下游发生滑坡、泥石流等地质灾害的风险。
图6
将万源市按平坡、缓坡、斜坡、陡坡、急坡和险坡6种坡地类型统计(表5)。
表5 重要区不同坡地类型面积统计
Tab.5
| 坡地类型 | 坡度范围/(°) | 面积/km2 | 比例/% |
|---|---|---|---|
| 平坡 | <5 | 89.46 | 3.37 |
| 缓坡 | [5,15) | 411.27 | 15.51 |
| 斜坡 | [15,25) | 811.12 | 30.59 |
| 陡坡 | [25,35) | 812.37 | 30.63 |
| 急坡 | [35,45) | 414.95 | 15.65 |
| 险坡 | ≥45 | 112.82 | 4.25 |
其中重要生态服务功能区主要分布在[15°,35°)的斜坡和陡坡区域。该区域地表坡度较大,且地质结构不稳定,沿坡面向下的剪切力较大,在风侵蚀力等外力与暴雨冲刷的作用下极易发生滑坡、泥石流等地质灾害导致水土大量流失。
4 结论
1)RS和GIS技术凭借其快速宏观的优势,可使重要生态服务功能区划定工作量大幅度削减。结合地面验证和以往的研究成果,本文方法应用结果符合研究区内的实际情况,证明该方法可行。
2)通过控制因子参数和GIS缓冲区空间分析方法,可以遵循扰动区对环境破坏随距离增加而衰减的自然规律,从而得到区域内连续的生态服务功能评估值,本文提取的研究区四川省万源市高植被覆盖区域能提供80%以上生态服务功能,对维持生态平衡至关重要。
3)采用生态保护效益系数来控制重要生态服务功能区划定,可以提高生态环境保护过程中人力、财力资源配置的高效性与合理性,有效保障生态环境保护投入产出比。
本研究的重要生态服务功能区划定,基础是遥感技术对生态系统的解译与评估模型因子的参数设定。因此,如何提高因子的合理性与科学性至关重要。今后,需要结合实地生境情况和评估结果对比分析,更合理地调整遥感解译尺度和模型参数,以进一步提高重要生态服务功能区划定的精度。
志谢: 本文研究过程中参考了国家生态红线划定技术指南,评委专家及编辑老师提供了宝贵的修改意见, 在此表示衷心的感谢!
参考文献
Man’s Impact on the Global Environment
[R].
The value of the world’s ecosystem services and natural capital
[J].
DOI:10.1038/387253a0
URL
[本文引用: 1]

The services of ecological systens and the natural capilal stocks that produce them are critical to the functiouing of the Erarth's life-support system.They contribule to human welfare.both direetly and indireetly,and therefore represent part of the totaleeononic value of the planet.We have estimated the eurrent biosphere.the value(most of which is ontside the market)is estimated to be in the range of USS16-54trillion(1012)per year,with an average of USS33 trillion per year.Because of the nature of the uncertainties,this must be considered a mininum estimate.Global gross national produet total is around USS18 trillion per year.
生态系统服务功能及其生态经济价值评价
[J].
DOI:10.1088/0256-307X/15/12/025
URL
[本文引用: 1]
Ecosystem services imply the natural environmental conditions and their effectiveness formed and sustained by ecosystems and ecological processes, on which, human life relies for existence. They not only supply human with the production of ecosystem goods, such as food, forage, timber, fuel, natural fiber and pharmaceuticals, but also perform fundamental life support services, which include the purification of air and water, detoxification and decomposition of wastes, regulation of climate, regeneration of soil fertility, production and maintenance of biodiversity, and mitigation of floods, droughts, and wind and water erosions. It is recognized that ecosystem services are essential to civilization. In recent years, people pay more and more attentions on the research of ecosystem services, and ecologists and economists discuss in succession the connotations and the valuation methods of ecosystem services, which have become the frontier's topics in ecology and ecological economics. In this paper, the research advances and tendencies in ecosystem services, their economic valuation and their relations to sustainable development are literaturally surveyed and discussed.
Ecosystem services and their economic valuation
[J].
生态功益:自然生态过程对人类的贡献
[J].atural ecosystems support life, contribute to human welfare, and provide essential conditions and services for civilization. The contributions and benefits from natural ecological systems to human societies are ecosystem services, which include: production of natural goods, biodiversity maintenance, climate regulation, regulation of hydrological flows and water supply, mitigation of droughts and floods, cycling and moving nutrients, generation and preservation of soils and renewal of their fertility, detoxification and decomposition of wastes, pollination and seed dispersal, pest control, maintenance of conditions for both mental and physical health and healing of human beings, provision of aesthetic, intellectual, and spiritual stimulation. The services flowing from natural ecosystems are enormous and indispensable for economy and welfare, but have been greatly undervalued by society, partly because they are not traded in markets and people are rarely ware of the role and importance of these services. In market-driven societies, the valuation of ecosystem services is useful to support more ecologically conscious decision-making. Identification and monitoring of ecological processes that generate ecosystem services are much needed. Human activities already have altered physical, chemical, biological and geographic attributes of the Earth profoundly and have been impairing the flow of ecosystem services on a large scale. We are facing a great challenge to maintain a sustainable society that is ecologically sound, economically feasible, socially just and peaceful. Ecologists should work closely with public and policy-makers to answer this challenge.
Ecosystem services:The biological conditions and ecological supports necessary for the development of human societies
[J].
森林生态系统生物多样性的遥感评估
[J].
DOI:10.3321/j.issn:1000-0933.2001.08.023
URL
[本文引用: 2]
目前的评估由于方法的原因,常常会遗留下一些含糊不清的地方.遥 感则可以作为一种观察生态系统多样性和单个生态系统中各种结构侧面的重要工具.它提供了一种能够跨越几个不同空间尺度实施评估的手段,并且对于评估生态系 统格局随时间的变化也是必不可少.现在许多不同的遥感技术已经被应用在生态学研究中.大多数工作所用的数据主要是来自机载和星载平台提供的摄影和数字光学 图像,目前则越来越强调激光扫描和合成孔径雷达数据的应用.这些技术手段为从景观到林分规模的不同现象的评估提供了机会.遥感提供了可用于确定森林生态系 统中生物多样性景观尺度的元素的最有效的工具,例如基质和斑块的相对百分比以及它们的配置.在中间尺度,遥感为评价廊道的存在和边界的特性提供了理想的工 具.在林分尺度,遥感技术可用来获取关于森林林分结构属性的信息,例如冠层表面的特性,是否存在冠内分层等等.随着技术的发展,遥感将更广泛地用于生态学 研究.
The assessment of forest ecosystem biodiversity by remote sensing
[J].
Remote sensing for biodiversity monitoring:A review of methods for biodiversity indicator extraction and assessment of progress towards international targets
[J].
DOI:10.1007/s10531-015-0947-z
URL
[本文引用: 1]
Recognizing the imperative need for biodiversity protection, the convention on biological diversity (CBD) has recently established new targets towards 2020, the so-called Aichi targets, and updated...
Monitoring of a national-scale indirect indicator of biodiversity using a long time-series of remotely sensed imagery
[J].
DOI:10.1080/07038992.2014.945826
URL
[本文引用: 1]
Remote sensing provides continuous, large-area coverage that supports synoptic, consistent, and repeatable monitoring of vegetation and, therefore, can be used to derive indirect indicators of biodiversity. We used a 21-year archive of Advanced Very High Resolution Radiometer (AVHRR) (1987 2007) data to assess changes in an indirect indicator of biodiversity, the Dynamic Habitat Index (DHI), which has proven useful in predicting patterns of species richness and abundance at broad spatial scales (>1 km2). The index has 3 components reflecting integrated vegetation greenness, vegetation seasonality, and minimum vegetated cover. We used a Theil en nonparametric rank-based test and computed the proportion of cells with positive or negative DHI trends within both the Canadian protected area network and the Canadian ecoprovinces. In general, the smaller protected and natural areas close to urban development had relatively larger proportions of trending DHI components over the 21-year period, than the larger, more remote protected regions. Most protected areas and ecoprovinces observed an overall increase in integrated greenness and a reduction in vegetation seasonality over the analysis period. We conclude that the ability to derive trends from long time-series of remote sensing data helps focus local biodiversity monitoring programs by guiding actions to areas of the greatest observed change.
中国生态系统服务研究的回顾与展望
[J].
DOI:10.11849/zrzyxb.2009.01.001
URL
[本文引用: 1]
生态系统服务研究是当前国际上科学研究的热点和前沿。近年来我国生态系统服务研究取得了较快进展。为了全面认识与介绍国内生态系统服务研究的状况与成果,促进国际生态系统服务研究的交流与合作,论文首先回顾了我国生态系统服务研究的4个时期,并简要概括了所取得的成就和存在的问题,最后指出,中国生态系统服务的研究应该尽快由当前的概算式研究转向更深层次的研究,尤其要重点关注生态系统功能的基础理论研究、评估指标与方法的标准化、生态服务价值动态评估模型研究、评估结果在决策过程中的应用研究以及生态系统服务的市场化机制研究。
Research on ecosystem services in China:Progress and perspectives
[J].
Integrated use of remote sensing,GIS and precipitation data for the assessment of soil erosion rate in the catchment area of“Yialias” in Cyprus
[J].
DOI:10.1016/j.atmosres.2013.02.013
URL
[本文引用: 1]
The study indicated that using RS and GIS technologies simultaneously with precipitation data resulted to an effective and accurate assessment of soil erosion in considerable short time and low cost for large watersheds.
Identification and classification of structural soil conservation measures based on very high resolution stereo satellite data
[J].
DOI:10.1016/j.jenvman.2017.02.061
URL
PMID:28262422
[本文引用: 1]
Land degradation affects large areas of land around the globe, with grave consequences for those living off the land. Major efforts are being made to implement soil and water conservation measures that counteract soil erosion and help secure vital ecosystem services. However, where and to what extent such measures have been implemented is often not well documented. Knowledge about this could help to identify areas where soil and water conservation measures are successfully supporting sustainable land management, as well as areas requiring urgent rehabilitation of conservation structures such as terraces and bunds. This study explores the potential of the latest satellite-based remote sensing technology for use in assessing and monitoring the extent of existing soil and water conservation structures. We used a set of very high resolution stereo Geoeye-1 satellite data, from which we derived a detailed digital surface model as well as a set of other spectral, terrain, texture, and filtered information layers. We developed and applied an object-based classification approach, working on two segmentation levels. On the coarser level, the aim was to delimit certain landscape zones. Information about these landscape zones is useful in distinguishing different types of soil and water conservation structures, as each zone contains certain specific types of structures. On the finer level, the goal was to extract and identify different types of linear soil and water conservation structures. The classification rules were based mainly on spectral, textural, shape, and topographic properties, and included object relationships. This approach enabled us to identify and separate from other classes the majority (78.5%) of terraces and bunds, as well as most hillside terraces (81.25%). Omission and commission errors are similar to those obtained by the few existing studies focusing on the same research objective but using different types of remotely sensed data. Based on our results, we estimate that the construction of the conservation structures in our study area in Eritrea required over 300,000 person-days of work, which underlines the huge efforts involved in soil and water conservation.
基于GIS和遥感技术的生态系统服务价值评估研究进展
[J].Ecosystem services evaluation is a hot topic in current ecosystem management, and has a close link with human beings welfare. This paper summarized the research progress on the evaluation of ecosystem services based on geographic information system (GIS) and remote sensing (RS) technology, which could be reduced to the following three characters,i.e., ecological economics theory is widely applied as a key method in quantifying ecosystem services, GIS and RS technology play a key role in multi-source data acquisition, spatiotemporal analysis, and integrated platform, and ecosystem mechanism model becomes a powerful tool for understanding the relationships between natural phenomena and human activities. Aiming at the present research status and its inadequacies, this paper put forward an “Assembly Line” framework, which was a distributed one with scalable characteristics, and discussed the future development trend of the integration research on ecosystem services evaluation based on GIS and RS technologies.
Ecosystem services evaluation based on geographic information system and remote sensing technology:A review
[J].
GIS-based multi-criteria evaluation to identify potential sites for soil and water conservation techniques in the Ronquillo watershed, northern Peru
[J].
DOI:10.1016/j.apgeog.2014.04.006
URL
[本文引用: 1]
61The suitability of soil and water conservation techniques (SWCTs) is assessed.61A GIS-based multi-criteria-evaluation (MCE) is applied for suitability modeling.6124% of the catchment area of the Ronquillo River is highly suited for bund systems.6144% of the catchment area is highly suited for the implementation of terraces.61GIS-based MCE is a new approach in the promotion of SWCTs in Peru.
成渝经济区生态系统服务功能重要性评价
[J].The importance of ecosystem services and their regional diversities in the Cheng-Yu Economic Zone were comprehensively assessed based on the analysis of biodiversity protection importance,water resources conservation importance,and soil protection importance. The results show that the area of extreme importance is 19,244.00 km2>/sup>,which accounts for 9.25% of the total area of the economic zone,including core habitats of organisms as well as extremely important water resources conservation areas and soil conservation areas. The area of importance is 46,814.76 km2>/sup>,accounting for 22.56% of the total area. The area of general importance is 141,344.08 km2>/sup>,accounting for 68.19% of the total area.
Assessment of ecosystem service importance in Cheng-Yu economic zone
[J].
三峡库区生态系统服务功能重要性评价
[J].
RS /GIS-based integrated evaluation of the ecosystem services of the Three Gorges Reservoir area (Chongqing section)
[J].
生态保护红线划定技术指南
[M].
Ecological Red Line Technology Guide
[M].
基于遥感技术的全国生态系统分类体系
[J].
DOI:10.5846/stxb201407281527
URL
[本文引用: 1]
随着遥感技术的发展,以遥感数据作为生态系统监测与评价的基础已成为宏观生态学研究的重要手段.遥感数据 要求每一数据集都要有相应的地物分类体系与之匹配,这也造成不同遥感数据及分类体系之间相互独立.虽然体系间多有联系和相似之处,但不同数据集的分类体系 难以直接使用或替换,制约了多元数据在生态系统评价中的使用效果.为尝试解决这一问题,提高多源遥感数据的使用效率,提出了一套基于中分辨率遥感数据的生 态系统分类体系.这套体系共有9个一级类、21个二级类、46个三级类,该体系主要依据类别内生态系统特征的相似性,并考虑了气候、地形等因素.最后以海 南岛、内蒙古和甘肃3个省为例,探讨了以遥感数据为基础的区域生态系统构成分析方法与应用效果.研究表明,该分类体系有较好的生态学依据,可以支持更加深 入的生态系统评估.但分类体系中还存在遥感数据与生态因子数据尺度不匹配、不能满足小尺度研究中对三级类进一步细分的要求以及当前数据质量和模拟技术不足 以完全支持植被覆盖率反演精度要求等问题.
An ecosystem classification system based on remote sensor information in China
[J].
中国生物多样性与生态系统服务评估指标体系
[J].
DOI:10.5846/stxb201611092273
URL
[本文引用: 1]
生物多样性和生态系统服务评估是生态系统管理与决策制定的重要依据,指标体系是开展评估的主要工具。中国在生物多样性与生态系统服务评估指标体系建设方面,由于没有形成统一的指标体系和技术方法,导致不同区域间的评估结果可比性差,区域和国家尺度上的集成研究难以开展。因此,构建一套适用于中国国家尺度的科学化、系统性和规范化的生物多样性和生态系统服务评估指标体系,便成为当前迫切需要研究解决的问题。本文参考国内外生物多样性与生态系统服务评估的主要研究成果,在充分考虑"生物多样性—生态系统结构—过程与功能—服务"级联关系基础上,建立了生物多样性与生态系统服务评估指标体系构建的主要原则,构建了中国生物多样性与生态系统服务评估指标体系。
An indicator system for biodiversity and ecosystem services evaluation in China
[J].
基于InVEST模型的鄱阳湖湿地生物多样性情景分析
[J].
DOI:10.11870/cjlyzyyhj201507006
URL
[本文引用: 1]
Assessment of ecosystem services are more and more applied in natural resource management. In this paper, we applied the FoPIA approch to build different land use/land cover scenarios in Poyang Lake wetlands by 2020. Then, we used the scenario parameters and land use/land cover indexes as input into the Integrated Valuation of Ecosystem Services and Tradeoffs model (InVEST). InVEST has been used to assess a typical village's habitat quality of migratory birds which is the biodiversity index of species in Poyang Lake wetlands. Results showed that: under the conversation scenario, the scale of habitat quality of migratory birds will be increased and the threat of human activities will be decreased obviously, influenced by ecological engineering, all these will making the average of habitat quality of the migratory birds in the typical village of Poyang Lake wetlands reach 0.89, showing an increase of 27.0%. Under the economic developing scenarios, human activities will be expanded and some of the superior quality habitat will be occupied by agriculture lands, therefore, the average habitat quality will decrease to 0.57, showing a decline of 14.0%. Under the nature developing scenarios, human activities will not change so much, and the average habitat quality is 0.66, showing an increase of 1.5%.
Biodiversity simulation of Poyang Lake wetlands by invest model under different scenarios
[J].
InVEST 2.5.6 User’s Guide[Z]
The impact of land use change on ecosystem services,biodiversity and returns to landowners:A case study in the State of Minnesota
[J].
DOI:10.1007/s10640-010-9407-0
URL
[本文引用: 1]
Land-use change has a significant impact on the world ecosystems. Changes in the extent and composition of forests, grasslands, wetlands and other ecosystems have large impacts on the provision of ecosystem services, biodiversity conservation and returns to landowners. While the change in private returns to landowners due to land-use change can often be measured, changes in the supply and value of ecosystem services and the provision of biodiversity conservation have been harder to quantify. In this paper we use a spatially explicit integrated modeling tool (InVEST) to quantify the changes in ecosystem services, habitat for biodiversity, and returns to landowners from land-use change in Minnesota from 1992 to 2001. We evaluate the impact of actual land-use change and a suite of alternative land-use change scenarios. We find a lack of concordance in the ranking of baseline and alternative land-use scenarios in terms of generation of private returns to landowners and net social benefits (private returns plus ecosystem service value). Returns to landowners are highest in a scenario with large-scale agricultural expansion. This scenario, however, generated the lowest net social benefits across all scenarios considered because of large losses in stored carbon and negative impacts on water quality. Further, this scenario resulted in the largest decline in habitat quality for general terrestrial biodiversity and forest songbirds. Our results illustrate the importance of taking ecosystem services into account in land-use and land-management decision-making and linking such decisions to incentives that accurately reflect social returns.
Mapping the soil loss in Marqya basin:Syria using RUSLE model in GIS and RS techniques
[J].
DOI:10.1007/s12665-017-6424-0
URL
[本文引用: 1]
Soil loss by water is the most important eco-environmental threat in Marqya basin without conservation measures. Mapping the soil loss is a useful and necessary in planning and maintenance works in Ma
基于RUSLE的福建省长汀县河田盆地区土壤侵蚀定量研究
[J].
DOI:10.5846/stxb201205130701
URL
[本文引用: 1]
以RS、GIS和RUSLE模型为主要技术,选取典型的土壤侵蚀区福建省长汀县河田盆地区为研究区,通过对模型因子的合理选择,估算了该地区1988年、1998年和2010年的土壤侵蚀量,实现土壤侵蚀状况的定量评价和动态监测.结果表明:在1988年至2010年期间,研究区土壤侵蚀状况得到明显改善,平均土壤侵蚀模数由4259.11 t·km-2·a-1下降为1280.09 t·km-2·a-1,年侵蚀量由252.42万t下降至75.87万t;中度及其以上侵蚀面积由176 km2减少至62.69 km2,微度侵蚀面积由225.85 km2增加至358.9 km2.研究结果说明近22年来针对长汀河田盆地区土壤侵蚀的治理所采取的措施是卓有成效的.长汀河田盆地区水土流失进一步重点治理的区域应集中在盆地中心及其西北部等地区的高程低于400 m、植被覆盖度为20%-50%的地区.
RUSLE-based quantitative study on the soil erosion of the Hetian Basin area in Changting County,Fujian Province,China
[J].
区域尺度海河流域水土流失风险评估
[J].
Regional soil erosion risk assessment in Hai Basin
[J].
USLE/RUSLE模型中植被覆盖管理因子的遥感定量估算研究进展
[J].Soil loss prediction models such as universal soil loss equation (USLE) and its revised universal soil loss equation (RUSLE) are the useful tools for risk assessment of soil erosion and planning of soil conservation at regional scale. To make a rational estimation of vegetation cover and management factor, the most important parameters in USLE or RUSLE, is particularly important for the accurate prediction of soil erosion. The traditional estimation based on field survey and measurement is time-consuming, laborious, and costly, and cannot rapidly extract the vegetation cover and management factor at macro-scale. In recent years, the development of remote sensing technology has provided both data and methods for the estimation of vegetation cover and management factor-over broad geographic areas. This paper summarized the research findings on the quantitative estimation of vegetation cover and management factor by using remote sensing data, and analyzed the advantages and the disadvantages of various methods, aimed to provide reference for the further research and quantitative estimation of vegetation cover and management factor at large scale.
Quantitative estimation of vegetation cover and management factor in USLE and RUSLE models by using remote sensing data:A review
[J].
长江上游地区土壤可蚀性空间分异特征
[J].
Spatial distribution characteristics of soil erodibility K value in the upper Yangtze River
[J].
基于GIS的区域坡度坡长因子提取算法
[J].
DOI:10.3969/j.issn.1000-3428.2010.09.087
URL
[本文引用: 1]
为提高基于地理信息系统的区域土壤侵蚀研究、水土保持环境效应评价、流域水文分析等的应用效率,设计新的坡度坡长(LS)因子算法,利用正向-反向遍历算法取代原累积坡长算法,以获取区域尺度下的LS因子.实验结果表明,在计算精度允许的范围内,新算法使计算机运行效率有较大幅度的提高.
Regional slope length and slope steepness factor extraction algorithm based on GIS
[J].
森林生态系统的水源涵养功能及其计量方法
[J].
为全面认识与正确评价森林生态系统的水源涵养功能,本文探讨了其概念、表现形式及其计量方法,认为:1)森林的水源涵养功能是一个动态、综合的概念,随着人们对森林水文作用认识的不断深入,其内涵不断丰富扩大,因此森林的水源涵养功能概念存在狭义和广义之分;2)森林的水源涵养功能(广义)有多种表现形式,包括拦蓄降水、调节径流、影响降雨和净化水质等,不过其具体表现形式与研究对象、研究目的以及研究尺度有关;3)目前森林拦蓄降水功能的计量方法主要有土壤蓄水能力法、水量平衡法、年径流量法和多因子回归法等8种,不过这些方法都存在一定的局限性,实际应用中需要综合考虑。
Water conservation function and its measurement methods of forest ecosystem
[J].
中国森林生态系统服务功能及其价值评价
[J].
DOI:10.3321/j.issn:1000-3037.2004.04.010
URL
[本文引用: 3]
森林生态系统对维持我国自然生态系统格局、功能和过程具有特殊的生态意义.客观衡量森林生态系统的服务效能,对于森林资源保护及其科学利用具有重要意义.论文在分析森林生态系统服务功能的基础上,根据其提供服务的机制、类型和效用,把森林生态系统的服务功能划分为提供产品、调节功能、文化功能和生命支持功能四大类,建立了由林木产品、林副产品、气候调节、光合固C、涵养水源、土壤保持、净化环境、养分循环、防风固沙、文化多样性、休闲旅游、释放氧气、维持生物多样性13项功能指标构成的森林生态系统评价指标体系,并对其中的10项功能指标以2000年为评价基准年份进行了初步评价.结果表明,森林生态系统10类生态系统服务功能的总生态经济价值为14 060.05×10⁸元/a,其中直接价值和间接价值分别为2 519.45×10⁸元和11540.60×108元,间接价值是直接价值的4.6倍.研究认为,森林生态系统服务功能及其价值评价工作应进一步加强森林生态系统服务功能机制的基础研究和不同尺度下空间数据的耦合和应用方法研究.
Forest ecosystem services and their valuation in China
[J].
