

0 引言
随着我国城镇化的推进,城市规模扩张,人口激增,城市环境的宜居性愈受人们关注。目前,学界对城市宜居性并没有统一的定义[1],在全世界范围内,已经有超过10个评价体系[2],其中大部分系统从环境、经济、社会、文化和发展理念等方面进行评价[3,4,5,6,7,8,9,10,11],侧重点各有不同。比如国外学者Mouratidis[12]从公共交通、城市中心通达性和土地混合利用方面评估城市的宜居性; Leach等[9]从公民福利、资源安全、资源效率与碳排放方面进行城市宜居性评估; Suresh[10]从饮用水安全、空气污染、道路卫生、污水处理、噪声污染、城市基础设施建设和通勤压力等方面构建评估体系。在国内,张文忠[13]就空间的差异性、社会的分异和宏观社会经济3方面总结分析城市的宜居性; 崔凤琪等[14]从舒适水平、便捷水平、幸福水平、发展水平和安全水平5个方面对京津冀地区城市进行评价。
1 研究区概况和数据源
本文研究区北京市地处华北平原北端,属于暖温带半湿润大陆性季风气候区。北京市拥有森林、草地、灌丛等自然生态系统[20],植被覆盖程度不一,且城区内人口密度大,工业集中。城区内地表覆盖类型主要为建筑物、道路、停车场等不透水层,该类型地物比热容小,易吸热升温快。
本文利用2013年和2014年3期(2013-05-01,2013-06-19,2014-11-18)国产高分一号(GF-1)PMS相机的8 m空间分辨率多光谱数据提取研究区生态用地,利用地表温度相近的3期(2013-05-12,2013-09-01,2014-10-06)Landsat8卫星热红外遥感数据反演城市地表温度。
2 城市环境宜居性评价方法与指标体系构建
2.1 评价指标计算方法
式中: ai和Ii分别为第 i 个指标的权重和评分值; N为指标数量。根据EQI取值范围和城市实际情况,将其划分为若干区间,各区间对应不同等级的城市生态质量和人居环境适宜性,从而实现城市环境宜居性的综合评价。本文的主要研究技术路线如图1所示。
图1
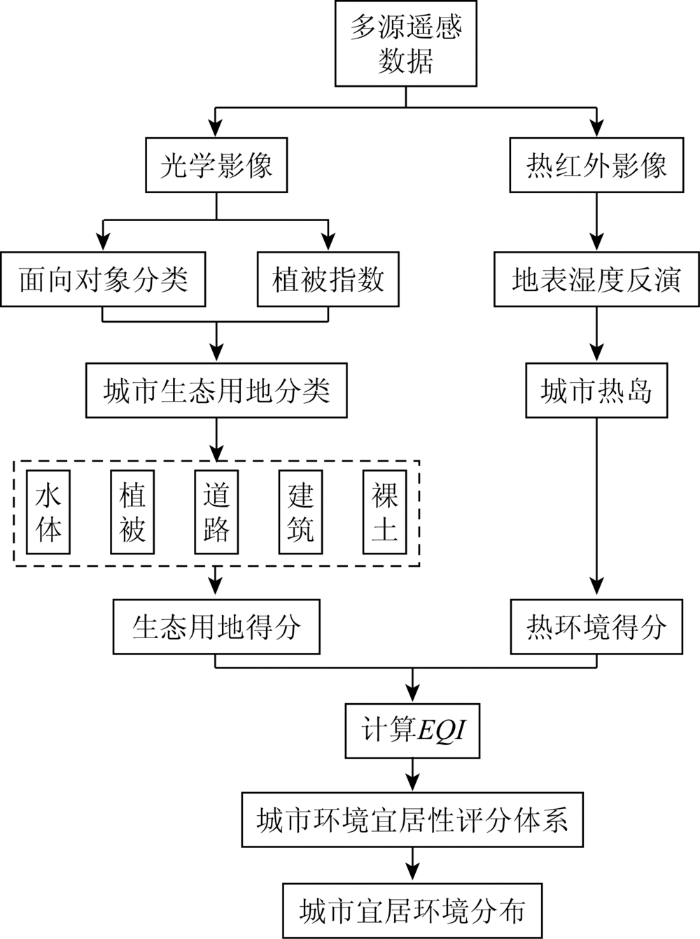
图1
城市环境宜居性评价研究技术路线
Fig.1
Flowchart for the evaluation of the livability of urban environment
2.1.1 城市生态用地指标提取
表1 各地物类型对应的分类规则集
Tab.1
| 地类 | 指数 | 公式 | 说明 |
|---|---|---|---|
| 水体 | 归一化差值水体指数(normalized difference water index, NDWI) | 式中 | |
| 植被 | 归一化差值植被指数(normalized difference vegetation index, NDVI) | 式中 | |
| 道路 | 长宽比指数(R) | 式中: L为图斑对象长度; W为图斑对象宽度。设置阈值R≥3,L≥170像元为道路[30] | |
| 建筑用地 | 灰度最大差值与亮度的比值(Diffmax); 形状指数(K); 灰度共生矩阵熵(Ent) | 式中: | |
| 裸土 | 紧凑度(C) | 式中: C为紧凑度; n为影像对象的宽; m为对象的长度; b为对象内的像素数[31] |
在提取城市各种生态用地类型的基础上,基于式(1)的方式构建各个生态用地类型对城市环境宜居性的评分标准,见表2,此评分模块用Iland_cover表示。
表2 城市生态用地类型对城市环境宜居性的单因子评分
Tab.2
| 地类 | 单因子 评分 | 说明 |
|---|---|---|
| 植被区 | 100 | 植被区作为理论上的最佳居住区 |
| 建筑用地 | 90 | 已经作为居住区,默认为较适合于居住或办公 |
| 裸土 | 80 | 裸土种类较多,在城市的裸土可能是潜在的建筑用地和绿地 |
| 水体 | — | 不直接参与评分,水源作为其他像元生态环境的参考 |
| 道路 | — | 不直接参与评分,道路作为其他像元交通通达性的参考 |
尽管不透水层(主要指建筑物)的生态功能较差,但作为居住区,可认为较适合于居住和办公。由于不透水层还包括其他硬化地面,所以其分值应低于植被区。城市裸土种类较多,随着城市发展,裸土逐渐转化为绿地或建筑用地,因此其潜在人居适宜性较大。水体和道路作为固定市政设施,基本无法进行土地利用类型调整,因此在城市人居环境评分模块将不把二者纳入评价,但可作为其他地类的参考进行评分。
表3 城市NDVI对城市人居适宜性单因子评分
Tab.3
| NDVI | 单因子评分 | 说明 |
|---|---|---|
| [0.5,1] | 100 | 浓密植被 |
| [0.4,0.5) | 90 | 较浓密植被 |
| [0.3,0.4) | 80 | 部分植被覆盖 |
| [0.15,0.3) | 70 | 稀疏植被 |
| [-0.2,0.15) | 60 | 裸土,但不包括水体 |
表4 城市水体辐射距离对城市环境适宜性的单因子评分
Tab.4
| 与水体的距离/m | 单因子 评分 | 说明 |
|---|---|---|
| <200 | 100 | 在水体(例如公园、湿地等)周围 |
| [200,500) | 90 | 直接受水体环境影响大 |
| [500,1 000) | 80 | 水体辐射范围可能受其他建筑的影响 |
| [1 000,1 500) | 70 | 水体辐射范围受其他建筑的影响,常常需要乘坐交通工具才能到达 |
| ≥1 500 | 60 | 距离水体较远,需要乘坐交通工具才能达到 |
表5 城市道路辐射距离对城市人居适宜性单因子评分
Tab.5
| 与主干道 的距离/m | 单因子 评分 | 说明 |
|---|---|---|
| <20 | 100 | 方便自驾或乘公交 |
| [20,50) | 90 | 比较方便自驾或乘公交 |
| [50,200) | 80 | 要绕过1~2栋建筑物才能到主干道 |
| [200,500) | 70 | 需要步行才能到主干道 |
| ≥500 | 60 | 比较偏离主干道 |
2.1.2 热环境指标计算
城市热环境是影响城市人居适宜性的重要因素,其中最为突出的是城市热岛效应。城市热岛是一个相对概念,反映城市与周围郊区的温度差异,本文采用如下公式计算热岛效应强度[33]:
式中: UHI为热岛效应强度; LSTavg为选择区域的平均温度; LSTp为像元的地表温度,本文采用Du等[34]提出的劈窗算法从Landsat8观测的热红外数据反演得到。根据UHI的数值范围可将城市热岛强度分为4个等级,即强热岛效应(UHI>0.2)、一般热岛效应(0.1<UHI≤0.2)、弱热岛效应(0.05<UHI≤0.1)和无热岛效应(UHI≤0.05)。
表6 夏季城市热环境对城市人居适宜性单因子评分
Tab.6
| 热岛效应强度累 积直方图比例 | 单因子 评分 | 说明 |
|---|---|---|
| [95%,100%] | 60 | 高温,酷热,必须借助降温设施 |
| [80%,95%) | 70 | 温度较高,需要借助降温设施 |
| [60%,80%) | 80 | 温度高,但不影响正常生活 |
| [40%,60%) | 90 | 温度合适 |
| [0,40%) | 100 | 温度低,夏季凉爽 |
表7 冬季城市热环境对城市人居适宜性单因子评分
Tab.7
| 热岛效应强度累 积直方图比例 | 单因子 评分 | 说明 |
|---|---|---|
| [95%,100%] | 60 | 工业高温区,影响正常生活 |
| [85%,95%) | 70 | 温度较高 |
| [75%,85%) | 80 | 温度高 |
| [60%,75%) | 90 | 温度一般 |
| [45%,60%) | 100 | 温度适中 |
| [35%,45%) | 90 | 温度低 |
| [25%,35%) | 80 | 温度较低,需要保暖措施 |
| [15%,25%) | 70 | 温度低,必须要保暖措施 |
| [0,15%) | 60 | 温度非常低,冰雪覆盖等,需要加强防寒保暖等措施 |
2.2 整体评分指标
以上各表给出了城市环境宜居性单因子评分体系,利用式(1)的权重系数形成城市人居适宜性综合评分体系。由于城市地表分类决定了城市用地的生态功能,因此其占有的权重相对较高,而植被与城市热岛效应是城市环境的重要影响因素,因此二者的作用也较为重要。经过综合考虑,本文给出了各个评价指标的权重,如表8所示。
表8 城市环境宜居性各个单因子权重
Tab.8
| 累积直方图比例 | 权重 | 说明 |
|---|---|---|
| Iland_cover | 0.4 | 具有决定性作用 |
| Iwater_dist | 0.1 | 一般影响 |
| Iroad_dist | 0.1 | 一般影响 |
| INDVI | 0.2 | 重要影响 |
| IUHI | 0.2 | 重要影响 |
表9 EQI划分区间与城市环境宜居性等级
Tab.9
| EQI | 等级 | 说明 |
|---|---|---|
| [90,100] | 宜居 | 居住环境很好 |
| [80,90) | 较宜居 | 居住环境好 |
| [70,80) | 一般宜居 | 居住环境一般 |
| [60,70) | 较不宜居 | 居住环境差 |
| [0,60) | 不宜居 | 居住环境很差 |
3 结果与分析
3.1 城市生态用地与热环境提取结果
3.1.1 城市生态用地提取
图2显示了北京城区的GF-1城市生态用地分类结果图,由于数据缺少,2013-05-01的影像的左下角存在无值区。
图2
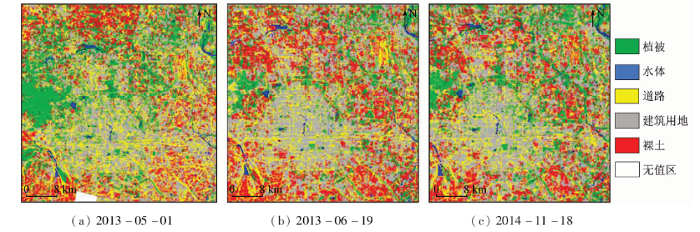
图2
北京市3个日期的高分影像城市生态用地分布
Fig.2
Urban ecological land covers images in Beijing on three dates
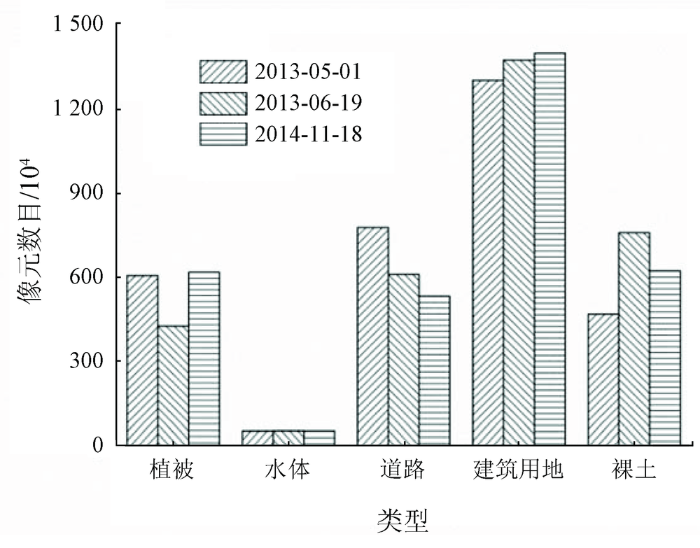
在对不同时间段北京城区地物类型信息提取的基础上,对提取结果进行了相关统计分析,形成了如图3所示的直方图。可以看出,建筑用地的像元数最多(>1.2×10⁷),与实际情况几乎一致。植被、道路、裸土的像元数位居其后。北京城区的植被主要是以公园树林以及行道植被为主,但是比较分散; 道路则是以环路为主,剩余的道路则是区间路,反映了北京道路密集,交通发达,因此在影像中道路的像元数占到一定的比例; 北京城区的裸土主要集中在城市郊区,而城市中心区几乎没有裸土存在。研究区覆盖面接近北京六环,裸土覆盖面积由中心向边缘逐渐增加,从而导致整个研究区裸土的像元数与植被、道路的像元数相当。水体的像元数则最少(<1.0×10⁶),这与实际地表覆盖情况基本一致。在研究区域内,北京城区的水体主要是一些小河流与水库,未包括诸如密云水库、官厅水库之类的大型水体。总体上,图2显示北京地区城市生态用地提取结果与实际地物覆盖情况基本一致。由于3个日期的相差最长不超过1.5 a,因此城市用地类型随时间变化并不明显。
图3
3.1.2 城市热环境信息提取
图4
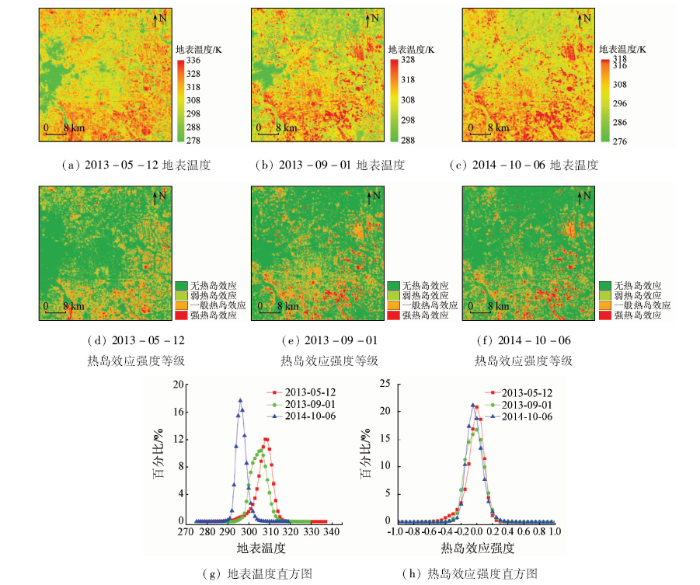
图4
北京市3个日期地表温度与城市热岛强度分布及其直方图
Fig.4
Map of land surface temperature and UHI in Beijing and the histograms
3.2 城市环境宜居性评价
基于上述提取的城市生态用地、城市地表温度,结合植被指数水网和路网等信息,利用权值法计算北京城区的EQI,并根据表8对EQI进行划分,获得北京城区在3个时期的人居适宜性分布情况,如图5所示。从图5中可以看出,3个时相的城市适宜性各个等级像元数没有发生明显变化,基本保持了动态平衡状态。这充分说明一个城市的生态环境适宜性的改变是一个长期发展的过程。宜居的像元数约为6.0×10⁶,距离植被覆盖区越近,人居适宜性等级越好。但在2013年6月19日这一时期的像元数略有减小,出现了一定的变动。较宜居的像元数最多(9.0×10⁶),说明北京城区的较适宜区域面积最大。一般宜居、不宜居与宜居的像元数相当,不宜居的像元数在减小,说明随着城市的发展,不适宜居住区域则在不断地减小; 而较不宜居像元数最少(1.0×10⁶),说明北京市城区较不适宜居住区域面积最小。2013年6月19日和2013年11月18日遥感影像获得较不宜居分布较为一致,但与2013年5月1日相差较大,主要原因可能在于使用的不同日期的地表温度数据。随着时间的推移,不宜居的区域会逐渐转变为较不宜居,同时不宜居的区域会逐渐减小。需要注意的是,如上文所述,由于道路和水体像元不能作为人居住所,所以直接将二者作为不宜居处理,从而增加了城市不适宜的像元个数。但总的来说,图5所示的城市生态适应性评价指标选择具有一定的可靠性,可以为城市居民选择居住地点提供一些参考。
图5
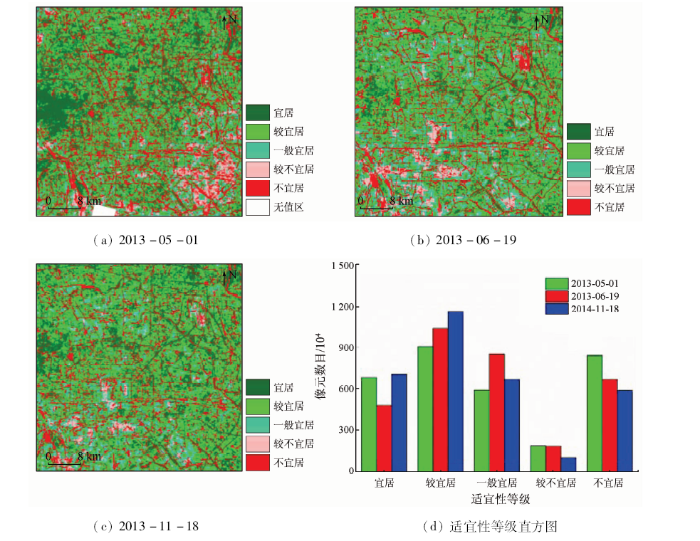
图5
北京市3个时相城市人居适宜性评价结果
Fig.5
Livability of urban environment in Beijing on three dates
4 结论与讨论
基于具有高空间分辨率特点的GF-1卫星数据,本文利用面向对象方法进行城市生态用地分类; 基于Landsat8热红外数据进行地表温度反演,并计算城市热岛效应强度; 在此基础上初步建立了一套基于多源遥感要素的城市人居环境适宜性评价指标体系; 以北京为研究对象,开展了不同时期城市生态用地分类、城市热环境提取与城市人居环境宜居性评价。结果表明,在研究时间段内北京市生态用地面积基本稳定,未发生重大变化,城市热岛效应不明显,绝大部分区域适宜或者基本适宜居住。城市生态用地遥感监测结果及城市人居环境适宜性评价结果与实际情况相符,提出的研究方法具有较高的可靠性。
但本文还存在以下不足: 首先,所使用的GF-1与Landsat8数据观测日期有一定差异,使城市生态用地与城市热环境在时间上存在一定的不匹配现象,从而在一定程度上影响了最终城市人居适宜性评价的结果; 其次,由于采集数据的有限性,本文未能使用城市热环境最明显的7—9月间的热红外数据; 再则,本文提出的各个评价指标的合理性以及权重分级还需要通过实地采访、抽样等方式进行验证。
参考文献
国外宜居城市研究的理论与方法
[J].
Theories and methods of livable cities abroad
[J].
宜居社区环境评价体系的研究进展
[J].
Research progress on environmental assessment system of livable community
[J].
The four qualities of life ordering concepts and measures of the good life
[M].
The quality of urban life and the perception of livability:A case study of neighbourhoods in Benin City,Nigeria
[J].DOI:10.1007/BF00302336 URL [本文引用: 1]
Smart growth:A prescription for livable cities
[J].DOI:10.2105/ajph.93.9.1410 URL PMID:12948954 [本文引用: 1]
Slow cities:Sustainable places in a fast world
[J].DOI:10.1111/j.1467-9906.2006.00298.x URL [本文引用: 1]
City life:Rankings (livability) versus perceptions (satisfaction)
[J].DOI:10.1007/s11205-011-9939-x URL [本文引用: 1]
The assessment of cities’ livability integrating human wellbeing and environmental impact
[J].DOI:10.1007/s10479-014-1666-7 URL [本文引用: 1]
Dataset of the livability performance of the city of Birmingham,UK,as measured by its citizen wellbeing,resource security,resource efficiency and carbon emissions
[J].
What works to make cities good for living?
[J].DOI:10.1177/0972063416651564 URL [本文引用: 2]
The spatial analysis of the livability of 22 districts of Tehran Metropolis using multi-criteria decision making approaches
[J].DOI:10.1016/j.scs.2018.01.018 URL [本文引用: 1]
Is compact city livable? The impact of compact versus sprawled neighbourhoods on neighbourhood satisfaction
[J].DOI:10.1177/0042098017729109 URL [本文引用: 1]
中国宜居城市建设的理论研究及实践思考
[J].
Theoretical research and practical thinking on the construction of livable cities in China
[J].DOI:10.22217/upi URL [本文引用: 1]
京津冀地区城市宜居性评价及影响因素分析:基于2010—2016年面板数据的实证研究
[J].
Evaluation of urban livability in Beijing-Tianjin-Hebei region and analysis of influencing factors:An empirical study based on panel data from 2010 to 2016
[J].
城市气象研究动向的思考
[J].
Reflections on the trend of urban meteorological research
[J].
Heat stress and public health:A critical review
[J].DOI:10.1146/annurev.publhealth.29.020907.090843 URL [本文引用: 1]
Satellite evidence of phenological differences between urbanized and rural areas of the eastern united states deciduous broadleaf forest
[J].
DOI:10.1007/s10021-001-0070-8
URL
[本文引用: 1]

We used a 10-year record (1990–99) of composited and cloud-screened reflectances from the Advanced Very High Resolution Radiometer (AVHRR) to test for phenological differences between urban and rural areas in the eastern United States deciduous broadleaf forest (DBF). We hypothesized that well-documented urban heat island effects would be associated with alterations in temperature-sensitive vegetation phenology. Our objectives were thus (a) to investigate possible differences in the start of the growing season (SOS) and end of the growing season (EOS) between the urban and DBF land covers, (b) to investigate related differences in greenness amplitude and fractional cover, and (c) to develop a generalized additive model (GAM) to predict the spatial variation of observed differences. By analyzing individual 1° latitude by 1° longitude blocks, we found that, on average, urbanization is associated with a growing season expansion of 7.6 days. Most of this effect is caused by an earlier SOS in urban areas. In all cases, urban regions had lower fractional cover and greenness amplitude. The GAM model failed to produce a viable model for differences in EOS, probably because it is dominated by photoperiod controls with only a minor temperature impact. SOS differences were predicted with an accuracy of about 2.4 days, with a GAM consisting of smoothed functions of mean annual average temperature, urban fractional cover, and the urban vs DBF greenness amplitude difference. We speculate that evidence of a phenological response to warming indicates that global warming, without reduction in DBF vegetation cover and greenness amplitude, may increase carbon sequestration in mesic deciduous forests.]]>
Global change and the ecology of cities
[J].
Cool surfaces and shade trees to reduce energy use and improve air quality in urban areas
[J].DOI:10.1016/S0038-092X(00)00089-X URL [本文引用: 1]
基于最小累积阻力模型的北京市生态用地规划研究
[J].
DOI:10.5846/stxb201606121121
URL
[本文引用: 1]
2,占市域总面积的60.20%;生态用地的适宜规模为12417 km2,占市域总面积的75.67%,其中,平原区生态用地的适宜规模为2944 km2,占平原区总面积的46.45%,主要分布于建成区的外围过渡地带;山区生态用地的适宜规模为9473 km2,占山区总面积的94.05%。]]>
Study on ecological land planning in Beijing based on the minimum cumulative resistance model
[J].
The livable urban landscape:GIS and remote sensing extracted land use assessment for urban livability in Changchun Proper,China
[J].DOI:10.1016/j.landusepol.2019.104048 URL [本文引用: 1]
How do modern transportation projects impact on development of impervious surfaces via new urban area and urban intensification? Evidence from Hangzhou Bay bridge,China
[J].DOI:10.1016/j.landusepol.2018.05.059 URL [本文引用: 1]
干旱内陆河流域人居环境适宜性评价——以石羊河流域为例
[J].
DOI:10.11849/zrzyxb.2012.11.013
URL
[本文引用: 1]
HEI),利用GIS的叠置分析、 缓冲区分析、 密度分析等空间分析技术对石羊河流域人居环境适宜性进行了定量综合评价分析。评价结果表明,石羊河流域人居环境指数介于17.13~84.32之间,整体分布格局为:从西南方向到东北方向适宜性依次降低,适宜、 较适宜居住区主要分布在中游和中下游地区,不适宜人类居住区占研究区面积的比例很大。石羊河流域人居环境适宜区主要以带状和斑块状分布在石羊河各支流周围,其他区域只有零星分布,与流域内居民点分布的空间格局相吻合。石羊河流域人居环境状况与人口密度呈对数关系,确定系数达到0.851 2,与经济发展水平呈现较明显的正相关性,人居环境评价值与单位面积GDP确定系数达到0.845 4,与道路网密度关系不显著,受道路制约程度较小。一些居民点分布在人居环境恶劣区域,一些村镇分布在靠近沙漠区域内,地形复杂,气候多变,水资源短缺,经济发展滞后,结合新农村建设规划和当地土地利用规划,这部分村落需要异地搬迁以便改善人居环境状况。]]>
Evaluation on the suitability of human settlements in arid inland river basin:A case study of Shiyang River basin
[J].
DOI:10.11849/zrzyxb.2012.11.013
URL
[本文引用: 1]
(HEI) model to evaluate the environment suitability for human settlements in Shiyang River Basin. Through using spatial analysis technique of GIS such as spatial overlay analysis, buffer analysis and density analysis to establish the spatial situation of nature suitability and spatial pattern for human settlement. The results showed that: the index of nature suitability for human settlement in the Shiyang River Basin was between 17.13 and 84.32. In general, nature suitability for human settlement decreased from southwest to northeast. Considering area, the suitable region was mainly distributed in Minqin oasis, Wuwei oasis and Changning basin, which accounted for about 1080.01 km2, 2.59% of the total area. Comparatively suitable region was mainly distributed around the county in Gulang, Yongchang and north of Tianzhu County, which accounted for about 1100.30 km2. The common suitable region was mainly distributed outside of the county in Yongchang, Jinchuan and most part of Minqin county, which accounted for about 23328.04 km2, 56.08% of the total area. The non-suitable region was mainly distributed upstream and north of the river, which accounted for about 9937.60 km2, 23.89% of the total area. Meanwhile, the most non-suitable region was distributed around the Qilian Mountain which covered by snow and cold desert and the intersecting area between Tengger Desert and Badain Jaran Desert. The total area was about 6154.05 km2, which accounted for 14.79% of the total area. Suitable regions for human inhabitance were distributed mainly around rivers in the form of ribbons and batches, while others are scattered. Their distribution was identical with the residential spatial pattern. There was a clear logarithm correlation between situation of residential environment and population, that is, the coefficient of determination between evaluation value of residential environment and population density reached 0.851 2. There was also positive correlation between situation of residential environment and economics, which reached 0.845 4 between evaluation value of residential environment and GDP. Result also shows the environment is difficult to support the existing population in the Shiyang River Basin. Spatial distribution of population was profoundly affected by severe environment such as the expanded deserts, the wavy terrains, and the changeful climate. Surface water shortage and slow economic growth was the bottleneck of nature suitability for human settlement in the Shiyang River Basin. So according to these problems and various planning, some of the residential parts need to relocate in order to improve situation of residential environment.]]>
高空间分辨率遥感影像分割方法研究综述
[J].Abstract:Remote sensing imagery segmentation is a process of dividing an image into different regions such that each region is,but the union of any two adjacent regions is not,homogeneous.It is one of the key techniques in the object-oriented remote sensing imagery data mining and its application,also quite essential in remote sensing image processing engineering.In this paper,we have a thorough survey on different methods of high spatial resolution remote sensing imagery segmentation,categorizing them into four groups according to the gray or color informationthey are exploiting.The disadvantage of current methods and the proper progress which can be obtained in the near future are pointed out at the end of this essay.]]>
Review of the method of segmentation of remote sensing images with high spatial resolution
[J].
面向对象遥感影像分类方法及其应用研究
[D].
Object-oriented remote sensing image classification method and application
[D].
高光谱遥感影像分类方法综述
[J].
Overview of classification methods of hyperspectral remote sensing images
[J].
The use of the normalized difference water index (NDWI) in the delineation of open water features
[J].DOI:10.1080/01431169608948714 URL [本文引用: 1]
Monitoring vegetation systems in the Great Plains with ERTS
[J].
一种基于形状特征进行高分辨率遥感影像道路提取方法
[J].
A road extraction method based on shape features for high-resolution remote sensing images
[J].
超高分辨率遥感影像城市建筑物和道路分类研究
[D].
Study on classification of urban buildings and roads in ultra-high resolution remote sensing images
[D].
利用灰度共生矩阵纹理特征识别空心村损毁建筑物的方法
[J].
Method of identifying damaged buildings in hollow villages by using the texture features of gray scale symbiotic matrix
[J].
北京市热岛效应时空变化的HJ-1B监测分析
[J].
DOI:10.3724/SP.J.1047.2012.00474
URL
[本文引用: 1]
本文利用2008-2011年HJ-1B/CCD可见光-近红外数据,以及HJ-1B/IRS热红外数据,采用遥感算法反演北京市地表温度,并用MODIS地表温度产品对反演结果进行了初步验证。同时分析了北京市热岛效应的年际、年内变化趋势。另利用热场变异指数分析其空间分布特征,以及NDVI、NDBI与城市下垫面对热岛效应的影响。结果表明:(1)2008-2010年北京市热岛强度总体呈上升趋势,2011年有所缓解,4年热岛强度分别为:5.2℃、5.2℃、9.2℃、8.2℃;(2)北京市2010年四季存在明显热岛现象,夏季最强,春、秋次之,冬季最弱,四季热岛强度分别为8.2℃、9.4℃、9.2℃、4.3℃;(3)2008-2011年北京市热岛空间分布特征表明,房山区和大兴区的南部热岛效应逐年缓解,2011年昌平区热岛效应比前3年明显,植被和水体形成城市冷岛;(4)地表温度与NDVI呈明显负相关,与NDBI呈正相关,城市热岛效应与下垫面类型存在明显相关性。
HJ-1B monitoring and analysis of temporal and spatial variation of heat island effect in Beijing
[J].
A practical split-window algorithm for estimating land surface temperature from Landsat8 data
[J].DOI:10.3390/rs70100647 URL [本文引用: 1]
