

0 引言
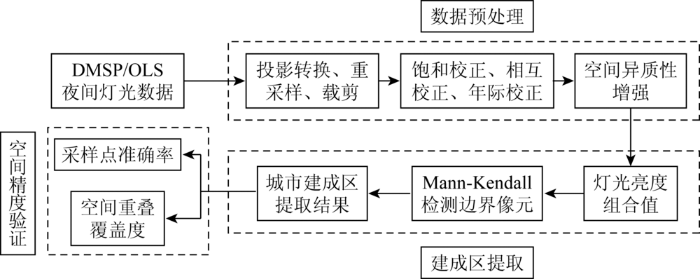
但由于DMSP/OLS数据存在“灯光饱和”现象和“灯光溢出”效应[21],无法真实表征人类活动强度,导致部分非城市建成区会被错分为城市建成区,制约建成区提取精度。为此,本文结合影像的灯光亮度与灯光亮度起伏度特征,构建灯光亮度组合值指数,利用Mann-Kendall非参数检验法确定城市建成区与非城市建成区的灯光亮度组合值突变点,将其作为边界像元,最后以广州市、深圳市、武汉市、南京市为研究区进行实验验证,从面积、混淆矩阵和景观指数等方面分析了建成区提取精度。
1 研究区概况及数据源
选取广州市、深圳市、武汉市和南京市4个城市作为研究区域。广州市作为改革开放的前沿阵地,是珠江三角洲城市群的中心城市,城市扩张十分迅速; 深圳市是中国第一个全部城镇化的城市; 武汉市是中国中部六省的特大城市; 南京市是长三角地区的国家重要门户城市,也是长三角及华东地区的特大城市。
同时,使用同年Google Earth高空间分辨率影像数据进行空间精度验证和混淆矩阵计算。为了验证不同方法的建成区提取效果,选取2010年30 m空间分辨率的Landsat ETM+影像中的城市建成区范围进行对比,该数据使用之前需要进行去条带等预处理。最后使用2010年城市建成区统计年鉴数据和GlobeLand30-2010地表覆盖数据分别用于面积误差统计和景观指数分析。GlobeLand30-2010地表覆盖数据空间分辨率为30 m,其总体分类精度为83.51%,Kappa系数为0.78,是目前可免费获得的总体分类精度最高的地表覆盖数据。
2 建成区提取方法
2.1 建成区研究方法
图1
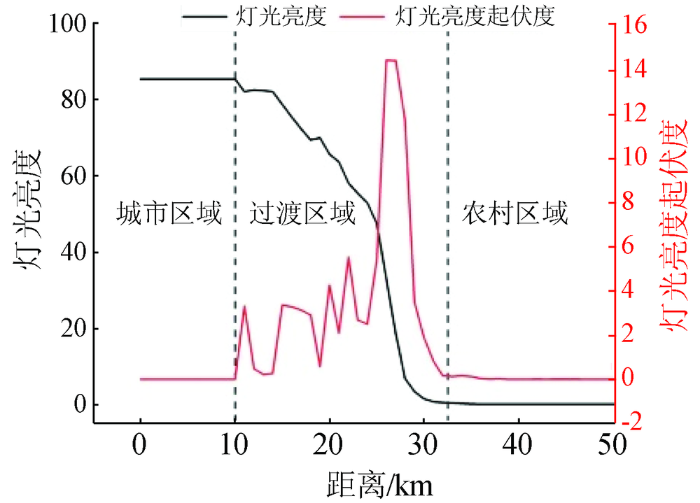
图2
2.1.1 灯光亮度组合值
灯光亮度起伏度反映了灯光亮度的相对差值,可描述灯光亮度的宏观性特征,即
式中: R为灯光亮度起伏度;
利用灯光亮度与灯光亮度起伏度构建灯光亮度组合值指数,即
式中:
以广州市为例,获取灯光亮度组合值如图3所示。对比分析图3(a)和图3(b)中红色矩形框和红色椭圆框位置影像可知,相比原始DMSP/OLS影像,灯光亮度起伏度影像凸显了城市建成区与非城市建成区之间的过渡带,可以反映出城市建成区轮廓,但是过渡带边缘比较模糊,无法清晰识别到城市建成区与非城市建成区的边界像元,确定精确的建成区范围。对比图3(b)和图3(c)中红色矩形框位置影像可知,相比灯光亮度起伏度影像,灯光亮度组合值影像有效增大了城市建成区与非城市建成区的灯光亮度差异,边界位置更为清楚明朗,有利于下一步确定边界像元。同时根据图中红色方框和红色椭圆框位置影像可知,灯光亮度组合值在一定程度上抑制“灯光溢出”效应,显示出真正的城市建成区范围。
图3
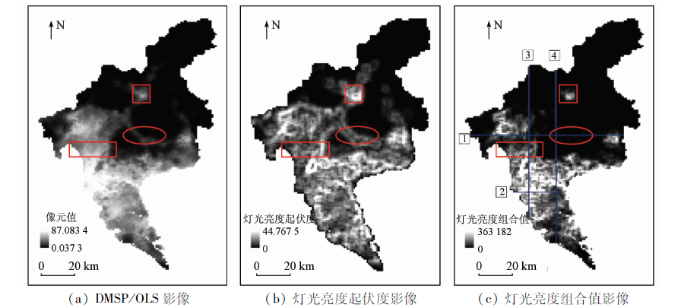
图3
广州市原始影像、灯光亮度起伏度和灯光亮度组合值影像对比
Fig.3
Comparison of original image, fluctuation of lighting intensity and light brightness combination image of Guangzhou City
2.1.2 Mann-Kendall非参数检验确定边界像元
图4
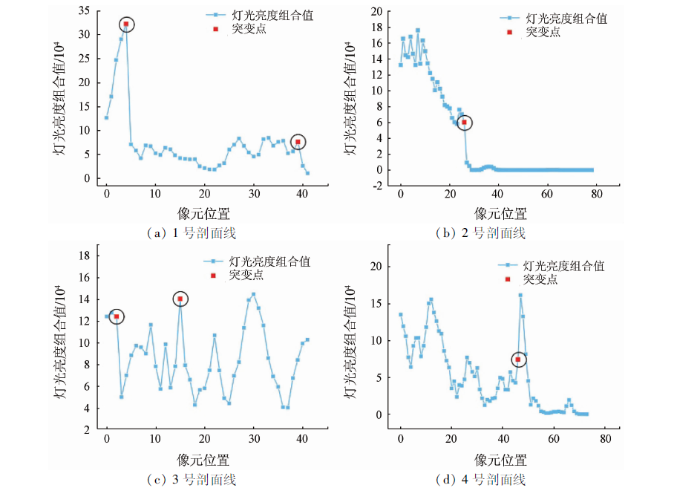
图4
横纵方向的灯光亮度组合值剖面
Fig.4
Profile image of light brightness combined value of the horizontal and vertical direction
Mann-Kendall非参数检验法假设随机独立序列为
Sk的均值E[Sk]和方差V[Sk]分别为:
将
将此过程应用到反序列中,使
图5
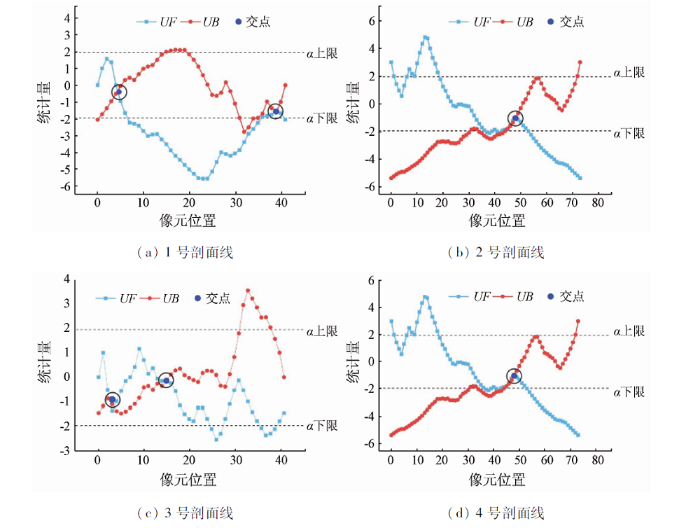
图5
横纵方向灯光亮度值Mann-Kendall突变检验示意图
Fig.5
Image of Mann-Kendall mutation test for the horizontal and vertical direction
逐行逐列地读取整幅影像的灯光亮度组合值后,利用Mann-Kendall非参数检验法获得所有突变点位置的像元,将其依次连接起来,剔除质量较差的像元,即可得到完整的城市建成区与非城市建成区边界线。
2.2 空间精度验证
为检验本文方法提取城市建成区结果的空间准确性,分别采用采样点准确率和空间重叠覆盖率2个指标进行精度验证。首先,通过目视解译在Google Earth影像上分别选择城市建成区与非城市建成区采样点,形成正负值点对[28],且保证点对落在相邻的栅格单元内; 然后,将点对叠加到本文方法提取的城市建成区。正值点落在城市建成区,负值点落在非城市建成区内即为符合要求,将符合要求的点对数量占点对总数量的比例作为采样点准确率。同时,将本文方法提取的城市建成区与Google Earth影像目视解译出的真实建成区进行叠加,获得空间重叠覆盖率。
2.3 不同建成区提取方法对比
为了进一步验证本文方法是否有效提高了城市建成区的提取精度,分别使用阈值法、邻域统计分析法(neighborhood statistics analysis,NSA)和特征组合值法提取研究区建成区范围进行比较,并从面积、混淆矩阵和景观指数等方面定量分析了建成区提取精度。其中,阈值法是通过不断的调整分割阈值,直到某一阈值下的城市建成区面积更接近于统计数据的数值[29]。NSA则根据灯光亮度起伏度与地形起伏度的相似性,利用邻域统计工具识别城乡过渡带以区分城市与农村[25]。特征组合值法结合DMSP/OLS数据的灯光亮度与灯光起伏度,构建了指数C,将影像归一到[0,1]之间,进而区分城市建成区与非城市建成区[24]。
在定量评价指标方面,面积误差和混淆矩阵常用于衡量图像提取和分类精度,分别将建成区统计年鉴数据和高空间分辨率Google Earth影像提取出的城市建成区作为真值,计算研究区4种方法的面积误差和混淆矩阵。另外,景观指数可以反映景观类型的空间形状及分布特征,因此通过检验提取结果与真实地表情况的一致性也是判断提取方法优劣的一种标准。土地覆盖是进行景观指数计算的基础数据。本文将GlobeLand30-2010人造地表数据作为对照样本,选取景观形状指数(landscape shape index,LSI)、周长面积比(perimeter area ratios,PARA)和聚集指数(contiguity index,CONTIG)3个指数进行景观指数一致性分析,从而定量对比不同方法的提取效果。
3 结果与分析
3.1 城市建成区提取结果
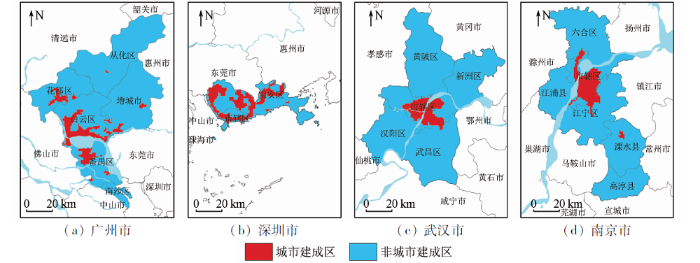
4个城市建成区提取结果如图6所示。结合当地的行政区划,广州市的城市建成区主要集中在白云区、花都区和番禺区,由于向西约束于行政边界线,向北为广花平原,地势低洼,向南被珠江阻隔,而向东地势平缓,交通发达,因此城市主要向东进行扩张,并与东莞市相接。深圳市的城市化程度较高,建成区面积占全市土地总面积比例较大,主要集中在宝安区,后经过行政区划调整,宝安区被划分为多个区,因此,如今城市建成区主要分布在西部的光明区、宝安区,中部的福田区、罗湖区和中北部的龙岗区,呈现多核心式发展,城市建成区分布相对松散,紧凑度较低。武汉市的城市建成区表现为典型的从城市中心向外圈层递减式分布,以江汉路为核心,依托河流分布,集聚效应明显。南京市南北狭长的城市形态使得城市发展具有明显的沿长江和南北交通走廊轴向发展的特征,表现为以江南主城区为中心,东北和西南方向沿江进行外延式扩张,南北方向沿交通轴线扩张,整体呈“摊大饼”式蔓延模式。
图6
3.2 精度验证结果
图7
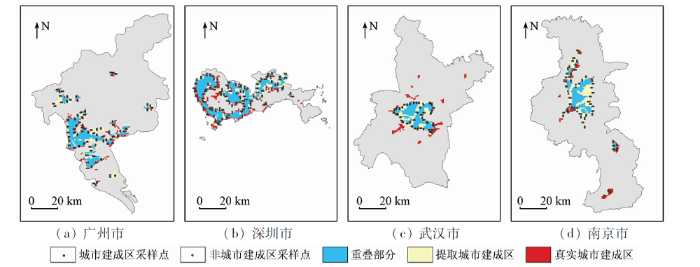
图7
采样点叠加及空间重叠覆盖示意图
Fig.7
Overlay map of sample point and space overlap coverage
表1 城市建成区与非城市建成区的空间分布准确率
Tab.1
| 指标 | 广州市 | 深圳市 | 武汉市 | 南京市 | 平均值 |
|---|---|---|---|---|---|
| 采样点准确率 | 91.25 | 92.23 | 86.36 | 89.10 | 89.74 |
| 空间重叠覆盖率 | 88.68 | 86.90 | 83.79 | 80.36 | 84.93 |
由表1可知,本文方法提取城市建成区与非城市建成区的采样点准确率平均值为89.74%,空间重叠覆盖率平均值为84.93%,表明本文方法的提取结果位置精度较高,空间分布形态与真实建成区也较为一致。
3.3 不同方法对比结果
研究区不同方法提取的城市建成区结果如图8所示。对比发现,DMSP/OLS影像中的亮区面积远大于Landsat ETM+影像中的城市建成区范围,4种方法均能有效提取出城市建成区的大致范围。其中NSA和特征组合值法易将亮区边缘划分为城市建成区,导致提取面积较大; 阈值法提取的城市建成区与Landsat ETM+影像中的城市建成区范围较为吻合。但是这3种方法均无法有效识别出城市建成区内部的非城市建成区,而本文方法不仅可以保证城市建成区的整体形态,还可以剔除城市建成区中非城市建成区的影响,效果较为理想。
图8
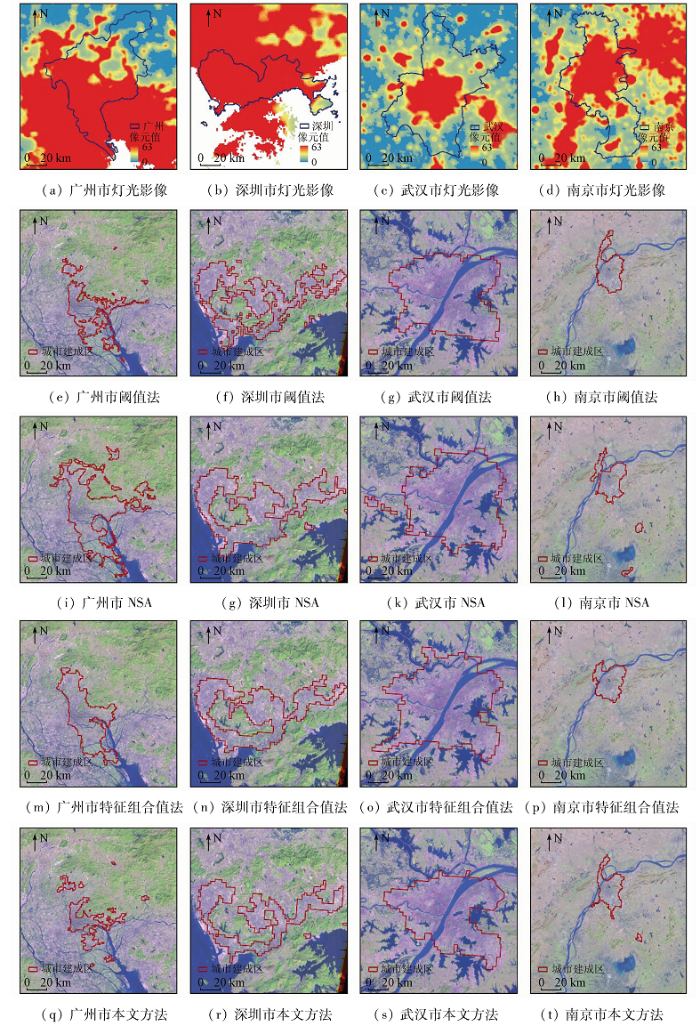
图8
4种方法城市建成区提取结果对比
Fig.8
Comparison of the extraction results of the four methods
3.3.1 面积精度
统计研究区4种方法提取的城市建成区面积,结果见表2。从面积误差来看,4种方法的提取精度由高到低依次为本文方法、阈值法、特征组合值法和NSA。本文方法提取的建成区面积与统计数据最为接近,平均相对误差仅为10.89%,明显低于其他3种方法。
表2 城市建成区提取结果面积误差
Tab.2
| 城市 | 统计数据 | 阈值法 | NSA | 特征组合值法 | 本文方法 | ||||
|---|---|---|---|---|---|---|---|---|---|
| 提取面积 | 面积误差 | 提取面积 | 面积误差 | 提取面积 | 面积误差 | 提取面积 | 面积误差 | ||
| 广州市 | 952.04 | 1 090 | 137.96 | 1 198 | 245.96 | 1 148 | 195.96 | 897 | -55.04 |
| 深圳市 | 661 | 754 | 93 | 778 | 117 | 761 | 100 | 708 | 47 |
| 武汉市 | 500 | 651 | 151 | 704 | 204 | 689 | 189 | 597 | 97 |
| 南京市 | 513 | 583 | 70 | 636 | 123 | 614 | 101 | 571 | 58 |
3.3.2 混淆矩阵精度评价
研究区4种方法的混淆矩阵结果见表3,阈值法、NSA、特征组合值法和本文方法的平均总体精度分别为87.98%,81.77%,83.06%和91.68%,平均Kappa系数分别为0.804 5,0.735 4,0.749 9和0.863 0。本文方法的总体精度和Kappa系数均高于其他3种方法,其Kappa系数在0.81~1之间,表明本文方法的城市建成区提取结果与真实城市建成区分布具有高度一致性,分类精度较高。同时,特征组合值法的总体精度和Kappa系数高于NSA,阈值法的总体精度和Kappa系数又高于特征组合值法。
表3 混淆矩阵评价不同方法的城市建成区提取结果
Tab.3
| 城市 | 方法 | 总体精度/% | Kappa系数 | 城市 | 方法 | 总体精度/% | Kappa系数 |
|---|---|---|---|---|---|---|---|
| 广州市 | 阈值法 | 86.400 1 | 0.727 4 | 武汉市 | 阈值法 | 90.697 7 | 0.807 7 |
| NSA | 80.800 0 | 0.719 2 | NSA | 86.046 5 | 0.776 7 | ||
| 特征组合值法 | 77.610 3 | 0.643 2 | 特征组合值法 | 87.127 0 | 0.790 2 | ||
| 本文方法 | 91.401 2 | 0.827 4 | 本文方法 | 93.385 6 | 0.875 6 | ||
| 深圳市 | 阈值法 | 88.123 3 | 0.908 0 | 南京市 | 阈值法 | 86.719 3 | 0.769 5 |
| NSA | 79.767 6 | 0.715 4 | NSA | 80.473 7 | 0.730 3 | ||
| 特征组合值法 | 83.202 1 | 0.886 7 | 特征组合值法 | 84.324 5 | 0.679 5 | ||
| 本文方法 | 91.030 1 | 0.936 7 | 本文方法 | 90.899 2 | 0.812 1 |
3.3.3 景观指数分析
将研究区4种方法的景观指数一致性分析结果绘制成分组柱状图,如图9所示,并计算不同指数的平均误差,结果见表4。由图9可知,本文方法提取的城市建成区,可以反映城市建成区内部的非城市建设用地,导致城市建成区斑块数量较多,边缘形状复杂,LSI和PARA值较大,CONTIG值较小。阈值法根据设定的阈值进行城市建成区提取,使得集中连片的城市建成区中存在很多小孔洞,因此PARA值高于其他方法,CONTIG值大于本文方法,小于NSA和特征组合值法。NSA和特征组合值法提取的城市建成区,形状规整,紧凑度较高,致使CONTIG值较大,LSI值较小,NSA提取的城市建成区由高DN值区域和散落在边缘亮区中的部分城市建成区组成,特征组合值法将边缘亮区靠近高DN值区域的一侧全部划分为城市建成区,因此,NSA提取的城市建成区边缘形状较特征组合值法复杂,LSI和PARA值大于特征组合值法,CONTIG值小于特征组合值法。由表4可知,本文方法的景观指数平均误差明显小于阈值法、NSA和特征组合值法,表明本文方法提取的城市建成区与GlobeLand30-2010人造地表数据呈现高度的景观一致性。
图9
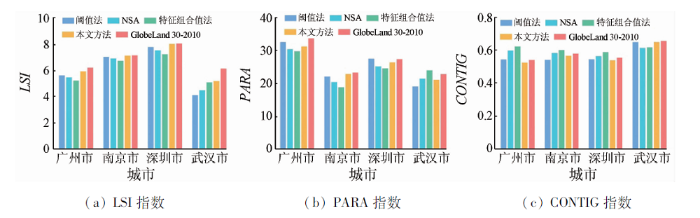
表4 不同方法的景观指数平均误差
Tab.4
| 方法 | LSI平均误差 | PARA平均误差 | CONTIG平均误差 |
|---|---|---|---|
| 阈值法 | 0.648 1 | 1.324 4 | 0.028 3 |
| NSA | 0.823 4 | 2.062 7 | 0.030 9 |
| 特征组合值法 | 0.713 8 | 2.777 3 | 0.043 2 |
| 本文方法 | 0.239 0 | 1.075 5 | 0.028 1 |
4 结论
1)本文提出了一种高效准确的城市建成区提取方法。首先,利用DMSP/OLS影像的灯光亮度和灯光亮度起伏度构建灯光亮度组合值指数,增大城市建成区与非城市建成区的亮度差异; 然后,利用Mann-Kendall非参数检验法确定相邻像元灯光亮度组合值的突变点,将其作为城市建成区与非城市建成区的边界像元。
2)与阈值法、NSA和特征组合值法相比,该方法具有更高的提取精度,其面积误差仅为10.89%,空间重叠覆盖率为84.93%,Kappa系数为0.863 0,总体精度为91.68%,与GlobeLand30-2010人造地表数据的高度景观指数一致性,进一步表明该方法提取的城市建成区在空间分布形态上具有更高的精度。
3)本文方法不仅弥补了现有文献对夜间灯光强度方面研究的不足,在不增加计算复杂度的情况下,有效提高了城市建成区的提取精度,且将Mann-Kendall非参数检验法应用到夜间灯光影像中,大大提高了检测边界像元的工作效率,自动化程度较高,使得该方法适用于大中尺度的研究区域。
4)尽管夜间灯光影像已被广泛应用于城市建成区的提取,但随着遥感技术的发展和夜间灯光影像的深入应用,如何与其他遥感数据相结合,并开展城市扩张格局及驱动力分析则是今后有待深入研究的内容。
参考文献
基于Landsat数据和DMSP/OLS夜间灯光数据的山东省城市扩张探讨
[D].
Urban expansion in Shandong Province based on Landsat data and DMSP/OLS night lighting data
[D].
Extraction of urban built-up areas from nighttime lights using artificial neural network
[J].
基于EVI指数的DMSP/OLS夜间灯光数据去饱和方法
[J].
DOI:10.11821/dlxb201508012
URL
[本文引用: 1]

DMSP/OLS夜间灯光数据被广泛应用于表征人类活动强度及其生态环境影响的诸多研究中,但因OLS传感器设计的局限,在用电强度较高的城市中心,灯光信号存在明显的饱和,这一不足可能影响到一些基于夜间灯光数据研究成果的可靠性。针对这一问题,NOAA-NGDC研发了辐射定标算法,但因缺乏星上定标系统,算法较为复杂,且受较多条件限制等原因,目前只有部分时期的辐射定标数据产品(RCNTL)。近期有学者提出一种基于植被指数NDVI构建的城市灯光指数VANUI,为灯光数据去饱和研究提供了一个操作简单且结果良好的方法,但该方法在一些城市效果不佳。基于此,本文综合利用夜间灯光与EVI指数信息,通过对VANUI指数构建方法进行改进,建立了一个新的缓解夜间灯光强度饱和的EANTLI指数。为了评价指数的效果,将EANTLI与VANUI从三个方面进行比较:① 区分、识别饱和区内地物的能力;② 与RCNTL的拟合程度;③ 对用电量估算的效果。结果表明:EANTLI在三个方面均表现出优势,在潜在饱和区内对特征地物具有更高的可区分性,与RCNTL的线性相关程度更高,与用电量的相关性相比于NTL、VANUI亦明显提高。因此可以认为EANTLI在指数的设计上较为合理,不仅易于计算,而且能达到较好的缓解灯光强度饱和、凸现城市内部差异的目的,在用于反演城市发展指标时能获得更为准确的结果,因此具有较高的应用价值。
An EVI-based method to reduce saturation of DMSP/OLS nighttime light data
[J].
Night-time lights of the world:1994—1995
[J].DOI:10.1016/S0924-2716(01)00040-5 URL [本文引用: 1]
基于ArcGIS的DMSP/OLS夜间灯光影像校正模型的构建
[J].
Construction of DMSP/OLS nighttime light image correction model based on ArcGIS
[J].
Satellite inventory of human settlements using nocturnal radiation emissions:A contribution for the global toolchest
[J].DOI:10.1046/j.1365-2486.1997.00115.x URL [本文引用: 1]
The night light development index (NLDI):A spatially explicit measure of human development from satellite data
[J].DOI:10.5194/sg-7-23-2012 URL [本文引用: 1]
Spatial analysis of global urban extent from DMSP-OLS night lights
[J].DOI:10.1016/j.rse.2005.02.002 URL [本文引用: 1]
Extracting the dynamics of urban expansion in China using DMSP-OLS nighttime light data from 1992 to 2008
[J].
DOI:10.1016/j.landurbplan.2012.02.013
URL
[本文引用: 1]
Timely and accurate information about the dynamics of urban expansion is vital to reveal the relationships between urban expansion and the ecosystem, to optimize land use patterns, and to promote the effective development of cities in China. Nighttime stable light data from the Defense Meteorological Satellite Program's Operational Line-scan System (DMSP-OLS) Nighttime Lights Time Series dataset provide a new source of information that can quickly reveal the dynamics of urban expansion. However, the DMSP-OLS sensor has no on-board calibration, which makes it difficult to directly compare time series data from multiple satellites. This study developed a new method for systematically correcting multi-year multi-satellite nighttime stable lights data and rapidly extracting the dynamics of urban expansion based on this corrected data for China from 1992 to 2008. The results revealed that the proposed method effectively reduced abnormal discrepancy within the nighttime stable light data and improved continuity and comparability. The dynamics of urban expansion in China from 1992 to 2008 were extracted with an average overall accuracy of 82.74% and an average Kappa of 0.40. (C) 2012 Elsevier B.V.
A cluster-based method to map urban area from DMSP/OLS nightlights
[J].
DOI:10.1016/j.rse.2014.03.004
URL
[本文引用: 1]
Accurate information on urban areas at regional and global scales is important for both the science and policy-making communities. The Defense Meteorological Satellite Program/Operational Linescan System (DMSP/OLS) nighttime stable light data (NTL) provide a potential way to map the extent and dynamics of urban areas in an economic and timely manner. In this study, we developed a cluster-based method to estimate optimal thresholds and map urban extent from the DMSP/OLS Nil data in five major steps, including data preprocessing, urban cluster segmentation, logistic model development, threshold estimation, and urban extent delineation. In our method the optimal thresholds vary by clusters and are estimated based on cluster size and overall nightlight magnitude. The United States and China, two large countries with different urbanization patterns, were selected to test the proposed method. Our results indicate that the urbanized area occupies about 2% of total land area in the US, ranging from lower than 0.5% to higher than 10% at the state level, and less than 1% in China, ranging from lower than 0.1% to about 5% at the province level with some municipalities as high as 10%. The derived thresholds and urban extent were evaluated using a validation sub-sample of high-resolution land cover data at the cluster and regional levels. It was found that our method can map urban areas in both countries efficiently and accurately. The sensitivity analysis indicates that the derived optimal thresholds are not highly sensitive to the parameter choices in the logistic model. Our method reduces the over- and under-estimation issues often associated with previous fixed-threshold techniques when mapping urban extent over a large area. More importantly, our method shows potential to map global urban extent and temporal dynamics using the DMSP/OLS NTL data in a timely, cost-effective way. (C) 2014 Elsevier Inc.
Mapping urbanization dynamics at regional and global scales using multi-temporal DMSP/OLS nighttime light data
[J].
DOI:10.1016/j.rse.2011.04.032
URL
[本文引用: 1]
Urban areas concentrate people, economic activity, and the built environment. As such, urbanization is simultaneously a demographic, economic, and land-use change phenomenon. Historically, the remote sensing community has used optical remote sensing data to map urban areas and the expansion of urban land-cover for individual cities, with little research focused on regional and global scale patterns of urban change. However, recent research indicates that urbanization at regional scales is growing in importance for economics, policy, land use planning, and conservation. Therefore, there is an urgent need to understand and monitor urbanization dynamics at regional and global scales. Here, we illustrate the use of multi-temporal nighttime light (NTL) data from the U.S Air Force Defense Meteorological Satellites Program/Operational Linescan System (DMSP/OLS) to monitor urban change at regional and global scales. We use independently derived data on population, land use and land cover to test the ability of multi-temporal NTL data to measure regional and global urban growth over time. We apply an iterative unsupervised classification method on multi-temporal NTL data from 1992 to 2008 to map urbanization dynamics in India, China, Japan, and the United States. For two-year intervals between 1992 and 2000, India consistently experienced higher rates of urban growth than China, and both countries exceeded the urban growth rates of the United States and Japan. This is not surprising given that the populations of India and China were growing faster than those of the U.S. and Japan during those periods. For two-year intervals between 2000 and 2008, China experienced higher rates of urban growth than India. Results show that the multi-temporal NTL provides a regional and potentially global measure of the spatial and temporal changes in urbanization dynamics for countries at certain levels of GDP and population-driven growth. (C) 2011 Elsevier Inc.
Updating urban extents with nighttime light imagery by using an object-based thresholding method
[J].DOI:10.1016/j.rse.2016.10.002 URL [本文引用: 1]
Quantitative estimation of urbanization dynamics using time series of DMSP/OLS nighttime light data:A comparative case study from China’s cities
[J].
DOI:10.1016/j.rse.2012.04.018
URL
[本文引用: 1]
Urbanization process involving increased population size, spatially extended land cover and intensified economic activity plays a substantial role in anthropogenic environment changes. Remotely sensed nighttime lights datasets derived from the Defense Meteorological Satellite Program's Operational Linescan System (DMSP/OLS) provide a consistent measure for characterizing trends in urban sprawl over time (Sutton, 2003). The utility of DMSP/OLS imagery for monitoring dynamics in human settlement and economic activity at regional to global scales has been widely verified in previous studies through statistical correlations between nighttime light brightness and demographic and economic variables (Elvidge et al., 2001; Ghosh et al.. 2010). The quantitative relationship between long-term nighttime light signals and urbanization variables. required for extensive application of DMSP/OLS data for estimating and projecting the trajectory of urban development, however, are not well addressed for individual cities at a local scale. We here present analysis results concerning quantitative responses of stable nighttime lights derived from time series of DMSP/OLS imagery to changes in urbanization variables during 1994-2009 for more than 200 prefectural-level cities and municipalities in China. To identify the best-fitting model for nighttime lights-based measurement of urbanization processes with different development patterns, we comparatively use three regression models: linear, power-law and exponential functions to quantify the long-term relationships between nighttime weighted light area and four urbanization variables: population, gross domestic product (GDP), built-up area and electric power consumption. Our results suggest that nighttime light brightness could be an explanatory indicator for estimating urbanization dynamics at the city level. Various quantitative relationships between urban nighttime lights and urbanization variables may indicate diverse responses of DMSP/OLS nighttime light signals to anthropogenic dynamics in urbanization process in terms of demographic and economic variables. At the city level, growth in weighted lit area may take either a linear, concave (exponential) or convex (power law) form responsive to expanding human population and economic activities during urbanization. Therefore, in practice, quantitative models for using DMSP/OLS data to estimate urbanization dynamics should vary with different patterns of urban development, particularly for cities experiencing rapid urban growth at a local scale. (c) 2012 Elsevier Inc.
These lit areas are undeveloped:Delimiting China’s urban extents from thresholded nighttime light imagery
[J].DOI:10.1016/j.jag.2016.02.011 URL [本文引用: 1]
基于夜间灯光数据的城市建成区提取方法评价与应用
[J].DMSP/OLS夜间灯光数据已被广泛应用于城市建成区的提取。目前主要存在4类提取方法:经验阈值法、突变检测法、统计数据法和较高分辨率影像数据空间比较法。以上海为例,在2000年、2003年、2006年夜间灯光数据的基础上,利用4种方法完成了城市建成区的提取。通过对不同年份数据提取结果的比较,证明了相同的灰度分割阈值对不同年份的夜间灯光数据中不存在通用性;在对2003年夜间灯光数据的提取中,4类方法所得结果精确度从高到低依次为统计数据法、突变检测法、经验阈值法和较高分辨率影像数据空间比较法,相对误差分别为1.3%、2.1%、5.1%和11.2%,在对4种方法的便捷性和可实现性进行分析与评价后,使用突变检测法完成了上海市2000~2006年城市建成区的提取。
Evaluation and application of urban built-up area extraction method based on night lighting data
[J].
利用夜间灯光数据的武汉城市空间格局演化
[J].
Evolution of urban spatial pattern in Wuhan using night light data
[J].
Mapping sub-pixel urban expansion in China using MODIS and DMSP/OLS nighttime lights
[J].DOI:10.1016/j.rse.2015.12.042 URL [本文引用: 1]
Optimized sample selection in SVM classification by combining with DMSP-OLS,Landsat NDVI and GlobeLand30 products for extracting urban built-up areas
[J].DOI:10.3390/rs9030236 URL [本文引用: 1]
A technique for using composite DMSP/OLS “City Lights” satellite data to map urban area
[J].DOI:10.1016/S0034-4257(97)00046-1 URL [本文引用: 1]
Regional mapping of human settlements in Southeastern China with multi-sensor remotely sensed data
[J].DOI:10.1016/j.rse.2008.05.009 URL [本文引用: 1]
Correcting incompatible DN values and geometric errors in nighttime lights time-series images
[J].DOI:10.1109/TGRS.2014.2352598 URL [本文引用: 1]
DMSP/OLS夜间灯光影像中国区域的校正及应用
[J].
DOI:10.3724/SP.J.1047.2015.01092
URL
[本文引用: 1]
美国国防气象卫星搭载的业务型线扫描传感器(DMSP/OLS)获取的夜间灯光影像,可客观地反映人类开发建设活动强度,其广泛应用于城市遥感的多个领域。但该数据缺少星上的辐射校正,下载的原始影像数据集不能直接用于研究,需进行区域校正。长时间序列的DMSP/OLS夜间灯光影像数据集主要存在2个问题需在校正过程中解决:(1)原始影像数据集中的影像是非连续性的;(2)数据集中的每一期影像都存在着像元DN值饱和的现象。针对这2个问题,本文提出了一种不变目标区域法的影像校正方法,对提取出来的每一期中国区域的夜间灯光影像进行了校正,该校正方法包括相互校正、饱和校正和影像间的连续性校正。最后,为了检验校正方法的合理性与可靠性,本文将校正前后中国夜间灯光影像与GDP和电力消耗值,分别进行回归分析评价表明,校正后的影像更客观合理地反映区域经济发展的差异。
Correction and application of DMSP/OLS night lighting image in China
[J].
Assessing spatiotemporal characteristics of urbanization dynamics in Southeast Asia using time series of DMSP/OLS nighttime light data
[J].DOI:10.3390/rs10010047 URL [本文引用: 1]
基于DMSP/OLS夜间灯光数据的城乡结合部空间识别研究——以重庆市主城区为例
[J].
Research on spatial recognition of urban-rural junction based on DMSP/OLS night light data:Take the main urban area of Chongqing as an example
[J].
A new method for extracting built-up urban areas using DMSP-OLS nighttime stable lights:A case study in the Pearl River Delta,southern China
[J].
Mann-Kendall检验法在Excel中的实现与应用
[EB/OL].
Mann-Kendall implementation and application of test method in Excel
[EB/OL].
时间序列趋势分析及其在预防性维修中的应用
[D].
Time series trend analysis and its application in preventive maintenance
[D].
基于夜晚灯光数据和Google Earth的城市建成区提取分析
[J].
DOI:10.3724/SP.J.1047.2015.00750
URL
[本文引用: 1]
夜晚灯光数据已被广泛应用于提取城市建成区的研究, 由于灯光具有溢出特性, 因此确定最佳灯光阈值成为研究热点。本研究中总结4种常用最佳阈值确定方法的特点, 并使用Google Earth影像空间比较法, 确定夜晚灯光数据提取城市建成区的最佳阈值。由于地形、交通等因素影响城市形态, 城市形态影响夜晚灯光数据提取城市建成区的最佳阈值大小, 因此, 根据城市形态将阈值结果分为2类, 并得到块状城市和带状城市建成区的最佳灯光阈值分别为43和 47。Google Earth影像空间比较法与其他方法相比具有不受统计数据限制, 以及简易操作等优势, 且从形态上对城市建成区提取结果进行空间比较;其次, 根据城市形态对最佳阈值结果分类, 使不同类型的城市建成区提取结果更准确。该方法适用于在地形复杂、形态多样的大尺度空间中提取城市建成区。
Extraction and analysis of urban built-up areas based on night lighting data and Google Earth
[J].
基于DMSP/OLS夜间灯光数据和统计数据的中国大陆20世纪90年代城市化空间过程重建研究
[J].
DOI:10.1360/972004-300
URL
[本文引用: 1]
中国大陆目前以行政单元为基础的城镇用地面积统计数据缺乏足够的空间信息, 难以满足大尺度城市化空间格局和变化过程研究的需要. 文中首先提出了一种以现有统计数据为基础, 借助DMSP/OLS夜间灯光遥感数据, 快速恢复和提取中国大陆城镇用地空间信息, 弥补现有统计资料不足的新方法. 进而以该方法为基础, 利用 1992, 1996和1998年的3期DMSP/OLS夜间灯光数据, 重建了中国大陆20世纪90年代的城市化空间过程. 利用统计数据对该方法提取结果的面积总量评估表明, 二者在全中国大陆尺度上的面积相对误差在1992年小于2%, 1996年和1998年则均小于1%, 在省级尺度, 相对误差最大的省份也没有超过10%, 大部分省份的相对误差小于3%. 同时利用高分辨率Landsat TM数据对该方法提取结果的城市空间格局特征分析也表明, 利用DMSP/OLS 提取的城市格局特征与Landsat TM提取的城市格局特征基本上是吻合的, 两者的相似程度在80%左右. 这说明利用该方法重建的中国大陆20世纪90年代城市空间过程, 基本上可以反映当时中国大陆城市发展的实际状况, 具有一定的可信性, 可以在一定程度上为中国大陆宏观城市空间格局和变化过程研究提供帮助.
Research on the spatial process reconstruction of urbanization in mainland China in 1990s based on DMSP/OLS night lighting data and statistical data
[J].
