

0 引言
城市化是城市区域向周边扩张的一个动态变化过程[1,2,3],总是伴随着城市建设用地的空间扩张,导致景观格局发生变化[4,5,6]。目前,使用卫星遥感技术在城镇空间扩张方面有大量研究,通过提取建设用地进行时空特征分析已经取得许多成果。提取建设用地的经典方法主要有: ①线性光谱分析[7,8,9]和归一化差值不透水面指数[10]、Fuzzy ARTMAP算法[11]和基于规则的算法[12]以及非线性微分法、灰度形态学法和标记分水岭分割法[13]; ②分类回归树(classification and regression tree,CART)[14,15]、基于人工神经网络(artificial neural networks,ANNs)[16,17,18,19]、利用元胞自动机(cellular automata,CA)模型[20,21,22]以及代理人基模型(agent-based models,ABMs)提取建设用地[23,24,25],这些研究多以小尺度、短时间的建设用地提取为主[26],并且在城市扩张模型中会限制其效率[27]。
1990—2018年间朝鲜主要城市建设用地的变化研究几乎长期处于空白,《林肯土地政策研究院(Lincoln Institute of Land Policy)》的数据统计中,朝鲜城市只有一个平壤,且集中于1990—2000年和2000—2014年2个大时间段, 2014年之后,相关区域扩张模式的研究几乎没有涉及。本文基于Landsat TM/ETM+/OLI影像,利用SVM分类方法,提取1990—2018年间广域尺度上朝鲜6个主要城市的建设用地,采用总体精度(overall accuracy,OA)和Kappa系数进行评价,并且结合景观格局指数、建设用地年增长与年增长率对其扩张模式科学分析,弥补广域时空尺度上朝鲜主要城市建设用地空间变化的空白,为其生态环境保护和新型城镇规划提供参考。
1 研究区概况及数据源
1.1 研究区概况
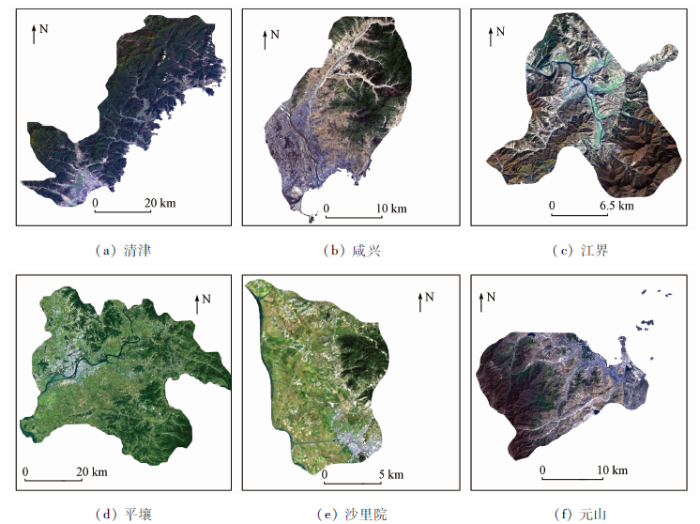
图1
1.2 数据源及预处理
本文所用朝鲜市、区(县)面状数据来自全球行政区域边界(GADM maps and data,
表1 本文采用的主要研究数据
Tab.1
| 城市 | 1990年 | 2000年 | 2010年 | 2018年 |
|---|---|---|---|---|
| 清津 | TM,1991 | ETM+ | TM | OLI |
| 咸兴 | TM | ETM+,2002 | TM,2011 | OLI |
| 江界 | TM | ETM+ | TM | OLI |
| 平壤 | TM | ETM+,2001 | TM | OLI |
| 沙里院 | TM | ETM+,2001 | TM | OLI |
| 元山 | TM | ETM+ | TM | OLI |
数据处理前将影像都统一到通用横轴墨卡托(universal transverse mercator,UTM)投影上,利用朝鲜6个主要城市边界矢量数据对遥感影像进行裁剪,提取研究区域。根据V-I-S(vegetation-impervious surface-soil)模型[34]将城市地物分为4种类型,分别是植被、建设用地、裸地和水体。依据随机均匀的原则,清津和咸兴分别选择600个影像对象,江界、沙里院和元山分别选择400个影像对象,平壤选择800个影像对象作为样本。
利用eCognition 9.0软件进行多尺度分割,选取训练样本,使用SVM进行分类,得到分类结果。影像分割的尺度越大,生成的图像对象的斑块越大、数量越少。尺度参数的选择要尽量保证每个影像对象只能包含一种地物,力求分割出的影像对象大小合适,既不破碎,也不笼统[23]。经过多次尝试,确定Landsat影像的尺度参数范围为20~55。参与尺度分割的各个波段所占的比重就是图层权重,一般来说,赋予较大权重的波段是包含重要信息的波段,对一些可有可无的波段赋予较小的权重。为充分利用各个波段的信息和平衡各个波段在分割过程中发挥的作用,实验中各个波段的权重、形状因子以及紧凑度皆为默认值。
2 研究方法
2.1 SVM分类
SVM是由Vapnik[35]首次提出,并由Boser等[36]结合统计学理论进行改进的非参数机器学习方法,其原理在较多研究中有详细论述[28, 37-38]。SVM的特征非常适用于城市扩展模式建模,但是SVM依然存在一定的不确定性: ①模型参数的设置对分类结果有显著影响[38,39]; ②算法耗时长、效率低,适用于小范围的搜索[38]。解译遥感影像提取建设用地是另一种获取城市建设用地变化的有效手段[40],并且具有广域性、周期性、连续性等天然优势,通过多期影像可以获取土地变化类型[41]。但是,仅用遥感数据很难完整、连续地反映城市用地时空演变过程: ①遥感数据是某一时刻研究区的土地利用状况,是瞬时的[42]; ②遥感影像会存在感应器、算法等误差以及大气扰动的不确定性[43]。SVM和遥感影像解译都具有一定的局限性,整合2种方法可以更符合实际的城市化进程。本文基于Chang等[44]开发的LIBSVM开源软件包,运用Matlab语言开发了“面向对象的遥感影像分类系统”。其主要功能是设置惩罚参数C和核宽度γ,经验表明,C和γ以指数增长方式(C=2-5, 2-3,…,215)搜索,是快速确定惩罚参数C和核宽度γ比较好的办法[45]。SVM分类将选择的样本分成2部分,1/3作为验证样本,2/3作为训练样本,根据这些有限的样本在模型学习能力和复杂性之间寻求最佳调和,以保证分类精度。
2.2 景观格局指数
表2 Fragstats 4.2软件中计算景观指数的详细信息
Tab.2
| 指数 | 表达式 | 描述 |
|---|---|---|
| NP | 式中ni为i类型斑块数量 | 各类型的斑块总数量,本文为建设用地这一类型斑块数量 |
| PD | 式中A为景观总面积,m2 | 表示每个单位面积的斑块数量,便于在不同大小景观之间进行比较 |
| LPI | 式中aij为斑块ij的面积,m2 | 表示最大斑块对所有景观的影响程度,表示建设用地在城市中的主导地位 |
| PLAND | 计算某一斑块类型占整个景观面积的相对比例 | |
| LSI | 式中 | 对调整景观大小的总边缘或边缘密度提供一个标准度量 |
2.3 年增长和年增长率
建设用地的年增长和年增长率分别代表一定时期内每年城市增长的数量和比率[49]。年增长用来比较相同影像不同时期的城市扩张速率,而年增长率用来比较相同时期不同影像的效率,即
式中: AI为年增长; AGR为年增长率;
使用GIS空间分析可获得建设用地的面积,用100表示1990年的建设用地面积,其余各年份面积扩张率用式(3)计算[50],即
式中:
3 结果与分析
3.1 精度评价
分类结果的评价指标采用OA和Kappa系数。评价影像分类结果时,随机选取1/3的验证点,执行评价的方式是通过逐点确定验证点参考类别。朝鲜6个主要城市在2000—2018年间所用的参考数据主要是Google Earth高分辨率影像,由于无法获取1999年之前的Google Earth影像,1990年的分类结果通过目视解译Landsat TM数据的方式验证。评价结果如表3所示。提取1990—2018年间朝鲜6个主要城市建设用地,总共得到24个分类结果,其中OA值达到90%以上,Kappa系数达到0.87以上。24个结果中,OA值为90.20%~93.46%,Kappa系数为0.87~0.91。各年份的平均OA值和Kappa系数分别高于91.60%和0.88。验证结果说明,使用SVM方法,可以实现大尺度、长时间序列的城市建设用地提取。
表3 研究区主要城市分类精度评价
Tab.3
| 城市 | 1990年 | 2000年 | 2010年 | 2018年 | ||||
|---|---|---|---|---|---|---|---|---|
| OA/% | Kappa | OA/% | Kappa | OA/% | Kappa | OA/% | Kappa | |
| 清津 | 92.23 | 0.88 | 91.07 | 0.87 | 92.15 | 0.89 | 92.65 | 0.88 |
| 咸兴 | 90.20 | 0.88 | 92.80 | 0.89 | 92.58 | 0.91 | 92.88 | 0.90 |
| 江界 | 90.76 | 0.89 | 92.36 | 0.89 | 92.20 | 0.90 | 91.76 | 0.90 |
| 平壤 | 91.61 | 0.90 | 91.42 | 0.89 | 93.08 | 0.91 | 93.00 | 0.91 |
| 沙里院 | 93.46 | 0.88 | 91.48 | 0.88 | 91.08 | 0.87 | 92.99 | 0.91 |
| 元山 | 93.36 | 0.90 | 90.46 | 0.87 | 90.39 | 0.88 | 93.30 | 0.90 |
| 平均值 | 91.94 | 0.89 | 91.60 | 0.88 | 91.91 | 0.89 | 92.76 | 0.90 |
3.2 城市扩张的时空动态
1990—2018年间朝鲜6个主要城市建设用地的年增长和年增长率如表4所示。
表4 1990—2018年建设用地的年增长和年增长率
Tab.4
| 指标 | 城市 | 1990— 2000年 | 2000— 2010年 | 2010— 2018年 | 1990— 2018年 | 平均值 |
|---|---|---|---|---|---|---|
| AI/km2 | 清津 | 0.02 | 0.63 | 0.04 | 0.17 | 0.22 |
| 咸兴 | 0.23 | 0.01 | 0.58 | 0.20 | 0.26 | |
| 江界 | 0.07 | 0.09 | 0.05 | 0.51 | 0.18 | |
| 平壤 | 0.01 | 0.86 | 1.15 | 0.03 | 0.51 | |
| 沙里院 | 0.02 | 0.07 | 0.04 | 0.06 | 0.05 | |
| 元山 | 0.08 | 0.04 | 0.10 | 0.06 | 0.07 | |
| AGR/% | 清津 | 0.13 | 3.18 | 0.17 | 0.86 | 1.09 |
| 咸兴 | 1.30 | 0.04 | 2.74 | 1.02 | 1.28 | |
| 江界 | 1.24 | 2.89 | 0.33 | 1.85 | 1.58 | |
| 平壤 | 3.18 | 2.97 | 1.27 | 1.00 | 2.11 | |
| 沙里院 | 0.03 | 1.89 | 2.08 | 1.08 | 1.27 | |
| 元山 | 0.82 | 2.31 | 1.20 | 0.82 | 1.29 |
从表4中可以看出,2010—2018年平壤的建设用地年增长达到1.15 km2,是1990—2018年所有城市中增长最高的。咸兴、元山的年增长最大值也在2010—2018年,然而清津、江界、沙里院的年增长最大值则在2000—2010年之间。清津、咸兴、江界、平壤、沙里院和元山的平均年增长率分别为1.09%,1.28%,1.58%,2.11%,1.27%和1.29%。平壤的年增长率在1990—2000年之间是最高的,2000—2010年之间年增长率最高的是清津,年增长率达到3.18%,最近时期内咸兴的年增长率最大,其值达到2.74%。
朝鲜6个主要城市的面积扩张率如图2所示。从图2中可以看出,2个内陆城市江界和沙里院,2000—2010年建设用地面积扩张率高于2018年; 而江界2000年的扩张率最快,几乎达到1.4倍; 沙里院在2010年以1.3倍的速率扩张; 2010年清津的扩张速率也几乎达到1.4倍。对于其他2个港口城市咸兴与元山,元山2000年和2018年的扩张速率几乎达到1.2倍,2010年的进程较缓; 咸兴的扩张速率在2018年达到1.3倍左右。平壤2018年的面积扩张率是先前的1.2倍,2010年的建设用地面积扩张率与2018年接近。3个内陆城市平壤、江界和沙里院,建设用地的面积较之于1990年面积处于上升趋势,而清津、咸兴和元山3个港口城市,虽然建设用地面积扩张率整体呈上升趋势,但是清津和咸兴的增长出现波动趋势,元山较之于清津和咸兴,波动幅度较小。
图2

图2
研究区主要城市面积扩张率
Fig.2
Relative spatial growth rate of the main cities in the study area
3.3 建设用地空间分布与景观格局变化
1990—2018年间朝鲜6个主要城市建设用地表现出不同程度的变化(图3)。1990—2018年间,平壤、咸兴、元山和江界有较为明显的扩张。
图3

图3
1990—2018年研究区主要城市扩张空间分布
Fig.3
Spatial distribution of urban expansion in main cities in the study area from 1990 to 2018
1990年6个城市的主城区沿着河流分布,其中清津、咸兴和元山作为港口城市其主城区也在海边分布,后期沿着主城区向内陆扩张。所有主城区都在地势平坦的区域,在山体中很少有城市存在,说明地形对城市的发展有一定的影响。自2000年起,平壤沿着大同江向南侧填充式扩张,江界除沿着东北方向的支流有一段飞跃式扩张之外,主要沿着河流像南侧填充式扩张。元山在扩张过程中主要集中于沿海区域,这几a来机场跑道的变化趋势最为明显。咸兴作为仅次于平壤的第二大城市,2010年前在清川江东侧填充式扩张,此后,清川江西侧的建设用地大幅增加。对于内陆城市沙里院而言,自2000年起,沿着主城区向东北方向填充式扩张。总体上,朝鲜6个主要城市的主城区基本沿河流或大海分布,呈现出由沿海向内陆延伸,中心向边缘填充扩张的趋势。
1990—2018年之间的建设用地景观变化趋势如图4所示。6个主要城市的PLAND在4个时期内全程都呈现出增长趋势,在2000年之后增长尤为明显。LPI描述了最大斑块对整个景观的影响。如果该城市的建设用地占据主导地位,则建设用地的LPI大于其他各类地物的LPI。1990—2018年清津、平壤、江界和咸兴的LPI较之于1990年都呈现上升趋势,说明建设用地的斑块面积在增加,建设用地的主导地位呈现上升的趋势,而沙里院和元山建设用地的主导地位则出现变动。通过LSI,NP和PD这些景观指数反映主要城市斑块和复杂性的不同,咸兴和平壤的LSI,NP和PD在2000年之前呈现下降趋势,之后开始上升。沙里院和清津的这3个指数一直呈现上升趋势,江界的LSI,NP和PD在2000年达到一个峰值,而咸兴则在2000年进入一个低谷期。
图4
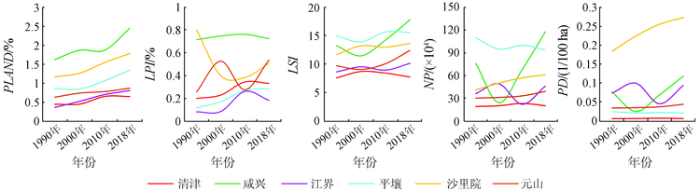
图4
1990—2018年清津、咸兴、江界、平壤、沙里院和元山的建设用地景观格局指数
Fig.4
Landscape metrics of construction land in Chongjin, Humhang, Kanggye, Pyongyang, Sariwon and Wosan from 1990 to 2018
4 结论
本文基于长时间序列的Landsat数据提取1990—2018年间朝鲜6个主要城市的建设用地,利用eCognition 9.0软件进行多尺度分割,选取训练样本,基于LIBSVM开源软件包,运用Matlab语言开发了“面向对象的遥感影像分类系统”,并使用Fragstats 4.2软件所带的八邻规则计算5种景观格局指数,结合年增长与年增长率对城市扩张进行分析,并且对结果精度进行评价,平均总体精度与Kappa系数分别达到90%和0.87以上,说明面向对象的SVM方法可以进行大尺度、长时间序列的建设用地提取。
通过对各城市空间分布的分析,发现6个城市的主城区都沿河(海)分布,且皆处于地势平坦区域,扩张时由主城区沿河流向外填充式扩张,只有咸兴和元山2018年部分飞跃式扩张,咸兴主要集中在清川江西侧,而元山主要集中于该城市飞机场周围。利用年增长和年增长率对6个主要城市进行分析,发现1990—2018年平壤的年增长是6个城市中最大的,达到1.15 km2,而元山的年增长率是波动幅度最小的。分析景观格局指数,得出除元山和沙里院之外,其他4个城市建设用地主导地位都呈现上升趋势。本文为朝鲜的生态环境保护和新型城镇规划提供参考,同时为相关研究提供科学依据。
同时,本文存在2方面问题: ①朝鲜半岛的特殊性导致一些特殊城市(如开城、新义州等)的边界确定困难,以至于未对其分析研究; ②由于无法获得1999年前的Google Earth 高分辨率影像,利用Landsat TM影像目视解译进行验证,精度受目视判断的影响。在下一步的研究中使用更高分辨率的影像(如WorldView-2和SAR等)结合多种方法对整个朝鲜进行分析,为东北亚地区生态、资源、经济的协调发展提供有力帮助。
参考文献
The rural-urban fringe
[J].DOI:10.2307/141123 URL [本文引用: 1]
Residential structure of mid-western cities
[J].DOI:10.1111/j.1467-8306.1970.tb00703.x URL [本文引用: 1]
Assessing spatial dynamics of urban growth using an integrated land use model.Application in Santiago Metropolitan Area,2010—2045
[J].
DOI:10.1016/j.landusepol.2013.11.024
URL
[本文引用: 1]

Scenario analysis of urban dynamics from spatial land use models can support urban, planning and policy. An integrated modeling approach, linking assessment of urban spatial dynamics, was applied to the Santiago Metropolitan Area (SMA). The integrated land use change model combines, a logistic regression model, Markov chain, and cellular automata. This model was calibrated with data, from 1975 to 2010, and was used to make predictions for the years 2030 and 2045, using two datasets of, urban and non-urban explanatory variables. Urban change estimates showed the highest fit during the, model calibration phase. The true-positive proportion and standard Kappa value (kappa) were of 99% and, 0.87 respectively when validating against an urban cover reference map from 2010. Urban growth was, equal to +27,000 ha (72%) for the period 1975-2010, and the city of Santiago is projected to, reach approximately 93,000 ha by 2045 (+43% from 2010). In the SMA the most important, urban growth pattern is peri-urban development, referring to widespread boundaries and higher, fragmentation in peripheral municipalities. Predictions for 2030 estimate that similar to 15% of the projected, urban expansion will occur outside the boundary set by the current Regulatory Plan proposal. These, results demonstrate the capacity of the integrated model to establish comparisons with urban plans, and its utility to explain both the amount and constraints of urban growth. The integrated approach of, urban dynamic assessment using land use modeling is useful for spatiotemporal representation of, distinct urban development forms. (C) 2013 Elsevier Ltd.
Proximity expansion index:An improved approach to characterize evolution process of urban expansion
[J].DOI:10.1016/j.compenvurbsys.2018.02.005 URL [本文引用: 1]
An integrated urban development and ecological simulation model
[J].DOI:10.1023/A:1019140101212 URL [本文引用: 1]
Impact assessment of land use planning driving forces on environment
[J].
基于线性光谱分析的城市旧城改造空间格局遥感研究:以1997—2000年上海中心城区为例
[J].
Remote sensing study on spatial pattern of urban old city transformation based on linear spectral analysis:A case study of Shanghai’s central city in 1997—2000
[J].
福州城区不透水面的光谱混合分析与识别制图
[J].
DOI:10.11834/jig.20070518
URL
[本文引用: 1]
作为Ridd V-I-S模型中的一个重要组成部分,城市不透水面在监测城市扩展和解释人类活动对生态环境的影响起着非常重要的作用。利用图像处理技术,可以迅速地从遥感图像中提取城市不透水面信息。本文以福州城区为例,利用最小噪音分量变换法研究Landsat ETM+影像中城市不透水面信息的提取。通过选取最小噪音分量变换后的前3个分量和线性光谱混合模型,测算得到了高反照率、低反照率、植被及土壤4个模拟城市不同土地覆盖类型的终端地类分量。通过综合低反照率和高反照率两个终端地类,最后得到了不透水面分量。结果表明,城市不透水面的增加对城市生态环境有负面影响。
Spectral mixture analysis and recognition mapping of impervious surface in Fuzhou City
[J].
基于亚像元分解的不透水表面与植被覆盖空间分异测度——以深圳市为例
[J].
Spatial differentiation measurement of impervious surface and vegetation cover based on sub-pixel decomposition:A case study of Shenzhen City
[J].
城市不透水面与相关城市生态要素关系的定量分析
[J].城市空间的快速扩展已使得原来以植被为主的自然景观逐渐被人工不透水建筑物所取代,并对区域乃至全球的生态系统造成了明显的影响。因此,准确了解城市不透水面及其与植被、水体、城市热环境的相关关系对于城市的科学规划和城市生态系统的修复具有重要的意义。以福州市为例,采用遥感空间信息技术,获得了城市不透水面、地表温度、植被和水体的信息,并对它们的关系进行了定量分析。发现了城市不透水面与地表温度之间的关系并不是一种简单的线性关系,而是一种很显著的指数函数关系,说明高不透水面比例地区的升温效应要明显高于低不透水面比例地区。多元统计分析表明不透水面是引发城市热岛的最重要因子。
Quantitative analysis of the relationship between urban impervious surface and related urban ecological factors
[J].
Fuzzy ARTMAP算法在城市不透水面估算中的应用研究
[J].
Estimating impervious surfaces using the Fuzzy ARTMAP
[J].
Rule-based impervious surface mapping using high spatial resolution imagery
[J].
A two-stage framework for road extraction from high-resolution satellite images by using prominent features of impervious surfaces
[J].
城市土地利用变化的不透水面覆盖度检测方法
[J].
Detection method of impervious surface coverage of urban land use change
[J].
利用多源遥感数据进行城市不透水面覆盖度估算
[J].
Estimation of urban impervious surface coverage using multi-source remote sensing data
[J].
Using neural networks and GIS to forecast land use changes:A land transformation model
[J].
An urban growth boundary model using neural networks,GIS and radial parameterization:An application to Tehran,Iran
[J].
Simulation of urban expansion and encroachment using cellular automata and multi-agent system model:A case study of Tianjin metropolitan region,China
[J].
Urban sprawl assessment and modeling using landsat images and GIS
[J].
Modeling urban dynamics through GIS-based cellular automata
[J].
A multi-scenario forecast of urban change:A study on urban growth in the Algarve
[J].
Modeling urban growth with GIS based cellular automata and least squares SVM rules:A case study in Qingpu-Songjiang area of Shanghai,China
[J].
Impacts of transport development on residence choice of renter households:An agent-based evaluation
[J].
Agent-based modeling of urban land-use development, case study:Simulating future scenarios of Qazvin City
[J].
Agent-based modelling of land use dynamics and residential quality of life for future scenarios
[J].
不透水面遥感提取及应用研究进展
[J].
Research progress in remote sensing extraction and application of impervious surface
[J].
A review of geospatial-based urban growth models and modelling initiatives
[J].
An enhanced support vector machine model for urban expansion prediction
[J].
Semisupervised one-class support vector machines for classification of remote sensing data
[J].
NWFE结合纹理特征的SVM土地覆被分类方法研究
[J].
Study on SVM land cover classification method based on NWFE texture features
[J].
基于改进SVM算法的高分辨率遥感影像分类
[J].
An improved SVM algorithm for high spatial resolution remote sensing image classification
[J].
1990—2015年朝鲜土地覆被变化及驱动力分析
[J].
Analysis of land cover change and driving forces in North Korea from 1990 to 2015
[J].
武汉城市群城镇用地空间扩展时空特征分析
[J].
DOI:10.11849/zrzyxb.2012.09.002
URL
[本文引用: 1]
基于Landsat影像数据,利用遥感和GIS技术获取了武汉城市群地区3个阶段(1980—1990、 1990—2000、 2000—2010年) 的城镇用地信息,采用城镇扩展指数和城镇扩展模型分析了城镇用地扩展的时空格局、 过程及其驱动力。结果表明:①武汉城市群城镇用地空间迅速扩张,三个时段内的城镇扩展强度指数依次为0.073 2、 0.028 9和0.099 3,呈现显著的阶段性与波动性特征;②城镇用地扩展格局具有明显的空间集中性,主要表现为以武汉为扩展中心的圈层状形态,沿武汉三环、 京广线等交通干道的轴带分布形态,不同阶段的扩展格局各具特质;③城镇用地扩展呈现"一核四带"、 "一核一带"和"三核六带"的空间扩展轨迹,与经济发展的阶段性具有明显的耦合关系;④经济体制改革、 国家非均衡发展战略、 "两型"社会建设以及长江黄金水道、 京广大动脉等交通干道建设是武汉城市群地区城镇用地变化的主要驱动因素,但各时期的主导驱动机制有所差别。
Analysis of spatial and temporal characteristics of urban land use in Wuhan Urban Agglomeration
[J].
DOI:10.11849/zrzyxb.2012.09.002
URL
[本文引用: 1]
As industrialization and urbanization accelerates, urban land expansions of many urban built-up areas in middle-western region are obvious. It is significant to obtain accurate information and analyze urban expansion process and its driving force. Based on Landsat TM, ETM+, MSS imagery data, this paper obtained the urban land use information of the three stages (1980-1990, 1990-2000 and 2000-2010) in Wuhan Urban Agglomeration with the application of remote sensing and GIS technology. Furthermore, the paper analyzed the temporal and spatial patterns of urban expansion, the expansion process and its driving force of Wuhan Urban Agglomeration using the urban expansion index and urban expansion model. The main conclusions are as follows: Firstly, the urban land of Wuhan Urban Agglomeration areas have experiencing a rapid expansion process; urban expansion intensity index in the mentioned three periods were 0.0732, 0.0289 and 0.0993 respectively, showing a significant fluctuation characteristics. Secondly, the spatial pattern of urban land use in Wuhan Urban Agglomeration was emerging conspicuous concentration during the study period; Wuhan was the center of the ring-layered expansion patterns. Moreover, the urban land-use expansion relatively centralized along the directions represented by the Third-Ring Road in Wuhan, Beijing-Guangzhou Railway and other transportation corridors. The urban expansion pattern was different in different stages. Thirdly, the expansion process of Wuhan Urban Agglomeration had formed one pole and four belts, one pole and one belt, three poles and six belts during 1980-1990, 1990-2000, 2000-2010 respectively. Fourthly, it was worth noting the fact that economic reform, national non-balanced development strategy, resource-saving and environment-friendly society building, and the Yangtze River, Beijing-Guangzhou Railway and other major transport arteries were the main driving factors for urban land use change. However, the dominant driving mechanism was different in different stages.
Exploring a V-I-S (vegetation-impervious surface-soil) model for urban ecosystem analysis through remote sensing:Comparative anatomy for cities
[J].
Pattern recognition using generalized portrait method
[J].
A training algorithm for optimal margin classifiers
[C]//
A relative evaluation of multiclass image classification by support vector machines
[J].DOI:10.1109/TGRS.2004.827257 URL [本文引用: 1]
人工蜂群算法优化的SVM遥感影像分类
[J].
SVM remote sensing image classification optimized by artificial bee colony algorithm
[J].
Choosing multiple parameters for support vector machines
[J].DOI:10.1023/A:1012450327387 URL [本文引用: 1]
Monitoring land-use change in the Pearl River Delta using Landsat TM
[J].DOI:10.1080/01431160110075532 URL [本文引用: 1]
土地利用/覆盖变化混合动态监测方法研究
[J].
DOI:10.11849/zrzyxb.2001.03.010
URL
[本文引用: 1]
针对当前土地利用/覆盖变化动态监测中常用的分类后比较法中存在的误差累积 ,夸大变化程度的缺陷 ,提出了把变化矢量分析和分类后比较法相结合进行混合动态监测的新方法。从北京市海淀区的实例研究来看 ,尽管该方法对单景图像分类精度提高不明显 ,却可以大大降低常规分类后比较法中误差累积的程度 ,改善了常规分类后比较方法中误差累积、出现不合理变化类型的缺陷 ,从而得到较为准确的土地利用/覆盖变化定量信息。
Study on the hybrid dynamic monitoring method of land use/cover change
[J].
DOI:10.11849/zrzyxb.2001.03.010
URL
[本文引用: 1]
In the current land use/cover change detection,post classification is often used for its little limitation to radiometric correction.However,as the error in the individual date classification map will also be present in the final change detection map and usually causing the fault of the change detection,a new change detection method combining Change Vector Analysis (CVA) and Post classification is thus given in this paper.From the result of the case study in Haidian District of Beijing,one can see that the error in post classification was reduced greatly and the relatively reliable land use/cover change information was also obtained,although the shortcoming of error accumulation can not be solved entirely.
耦合遥感观测和元胞自动机的城市扩张模拟
[J].
DOI:10.11834/jrs.20132169
URL
[本文引用: 1]
在传统元胞自动机(CA)模型中,静态的模型参数和模型误差不能释放是影响城市扩张模拟效果的两个重要原因。文中引入集合卡尔曼滤波方法到CA模型中,提出了基于联合状态矩阵的地理元胞自动机。该模型在模拟过程中可以通过同化遥感观测数据,动态地调整模型参数和纠正模拟结果,使模型参数能够反映转换规则的时空变化,同时也能较好地释放积累的模型误差。将模型应用于东莞市的城市扩张模拟中,实验结果表明,模型能够准确地调整模型参数使之符合城市发展模式,同时也能有效地控制模型误差,其模拟的空间格局与真实情况吻合。
Simulation of urban expansion by coupling remote sensing observation and cellular automata
[J].
DOI:10.11834/jrs.20132169
URL
[本文引用: 1]
Traditional Cellular Automata (CA) requires parameter adjustments and results modification to improve performance especially in a long simulation period. This paper introduces the ensemble Kalman filter (EnKF) into the CA model and proposes a new geographical cellular automata model based on joint state matrix. The model will adjust model parameters and correct simulated results dynamically in the process of simulation by assimilating remote sensing observations. The change of model parameters can properly reflect temporal and spatial variations in the transition rules. Besides, the model can effectively release accumulated model errors. It was applied to the urban expansion simulation of Dongguan, Guangdong province, China. Experiments indicate that this model can modify the parameter value which can properly reveal the urban development pattern. It also can produce more reasonable results than logistics CA model and EnKF CA model in simulating this complex region.
Principal component analysis of stacked multi-temporal images for the monitoring of rapid urban expansion in the Pearl River Delta
[J].DOI:10.1080/014311698215315 URL [本文引用: 1]
LIBSVM:A library for support vector machines
[J].
基于SVM的多源信息复合的高空间分辨率遥感数据分类研究
[J].
DOI:10.11834/jrs.20060108
URL
[本文引用: 1]
遥感图像尤其是高空间分辨率(1―4m)遥感图像在土地利用和土地覆盖变化方面有着广阔的应用前景,传统高空间分辨率遥感图像信息提取方法存在精度和分类效率低的不足。本文提出的基于SVM的分类方法,复合光谱、纹理和结构信息等多源数据信息,对IKONOS高空间分辨率图像进行分类,并与最大似然法和单源数据(光谱)SVM分类结果进行定性和定量比较分析。研究结果表明,多源数据复合的SVM高空间分辨率遥感图像分类方法,能够有效解决单源数据信息图像分类效果破碎的问题;总精度达到68.38%,Kappa达到0.5993;对高维输入向量具有高的推广能力;比单源信息的SVM和最大似然方法图像分类精度更高,适合高空间分辨率遥感图像分类。
SVM based classification of high spatial resolution remote sensing data with multi-source information integration
[J].
DOI:10.11834/jrs.20060108
URL
[本文引用: 1]
The RS miage shows a very promising perspective forurban land-coverand land-use classification,\nparticularlywith very high resolution(1―4m) satellite mi ages, while the traditional extractionmethods of the\nhigh spatial resolution mi age has the shortcomings of the low accuracy and classification efficiency. This paper\ndealswith the high spatial resolution mi age(IKONOS) classification based on the SVM method integrating the\ninformation of spectra,l texture and structure. And comparing to the results based onMaxmi um Likelihood and\nSVMmethodwith single-source data, this shows thatthe high spatial resolutionRS mi age classification based on\nSVMMethod with multi-source data can solve the mi age classification fragmentation which is based on the\nsingle-source data, spectrum, and has the good generalization ability with the high dmi ension vector. It has\nmore accuration than themaxmi um likelihoodmethod and SVM based on the single source data, adapts to the\nhigh spatial resolution RS Image classification.
Urban land-cover dynamics in arid China based on high-resolution urban land mapping products
[J].DOI:10.3390/rs9070730 URL [本文引用: 1]
FRAGSTATS:Spatial pattern analysis program for quantifying landscape structure
[J].
Urban land expansion in China’s six megacities from 1978 to 2015
[J].
Rates and patterns of urban expansion in China’s 32 major cities over the past three decades
[J].
