

0 引言
长株潭城市群是长江中游城市群核心区域之一,目前有较多学者对长株潭城市群空间结构演变进行了相关研究[1,2,3]。对于城市群建成区演变时空特征研究,国内学者从扩张模式[4,5,6,7]、驱动力分析[8,9,10]、空间变化[11,12,13]等方面进行了大量深入分析。随着遥感技术的飞速发展,城市空间研究开辟了新的技术路线,Croft[14]最早将美国军事气象卫星(DMSP)搭载的OLS传感器数据应用于城市研究。Imhoff等[15]、舒松等[16]、杨洋等[17]、米晓楠等[18]、王晓慧等[19]提出了利用DMSP/OLS夜间灯光数据提取城市建成区空间信息的方法。DMSP/OLS夜间灯光数据已广泛运用于全国[20,21,22]、区域[23,24,25,26]以及省域[27,28,29,30]等层面城镇用地空间研究。本文选取长株潭城市群1993—2013年DMSP/OLS夜间灯光数据,采用灯光阈值-辅助资料对比法提取长株潭城市群建成区空间分布,通过计算建成区空间扩张、标准差椭圆、重心变动、景观格局指数和空间自相关等指标,定量分析长株潭城市群1993—2013年间建成区演变时空特征,探索总结城市群空间发展规律,为制定可持续发展的规划引导和管控措施提供思路。
1 研究区概况及数据源
1.1 研究区概况
长株潭城市群由湖南省长沙、株洲、湘潭、衡阳、岳阳、常德、益阳及娄底8市组成,研究区总面积为9.68万 km2,占湖南省的45.8%; 人口为4 106万,占湖南省的61%; 经济总量占湖南省的80%,是长江中游经济社会和城镇化高度发展地区及全国资源节约和环境友好型社会建设综合配套改革试验区。
1.2 数据源
研究利用DMSP/OLS夜间灯光数据和相关辅助数据。DMSP/OLS数据来源于美国国家地球物理数据中心,全分辨率数据的地面采样距离为0.56 km,地面分辨率为0.008 333 3°,研究区图像在3 000 km整体图像中裁取。研究所采集的1993—2013年灯光数据均为栅格灰度遥感影像,该数据灰度值范围0~63,空间分辨率为1 km×1 km[31]。同时为了提高空间计算精度,研究用Landsat系列卫星同期数据进行校正,并进行抽样检验精度,卫星数据来源于地理空间数据云。辅助数据包括《中国城市统计年鉴》统计数据和全国1∶400万数据库中的市县(区)级面状数据。
2 研究方法
2.1 灯光阈值-辅助资料对比法提取城市群建成区
采用灯光阈值-辅助资料对比法,以夜间灯光数据为主要数据源,城市统计年鉴数据和Landsat系列卫星影像作为辅助数据,将城市群中每一个城市作为一个整体处理,将校正后的夜间灯光数据作为数据源,采用二分法提取长株潭城市群建成区,当动态阈值下灯光面积与统计年鉴市辖区建成区面积之间绝对差值最小时的阈值作为最佳阈值[32],大于该阈值的灯光面积认为是建成区面积。
2.2 建成区扩张规模分析
空间扩张规模分析主要包括扩张速度和扩张强度等指标。扩张速度反映建成区扩张快慢,是不同时期建成区扩张面积增量,即
式中: A为建成区扩张速度; ΔS为建成区扩张面积; Δt为时间间隔; S为研究初期建成区总面积。
扩张强度反映建成区扩张的强弱,使不同时期的建成区扩张速度具有可比性,即
式中: I为建成区扩张强度指数; ΔU为不同时期扩张面积差; T为区域总面积。
2.3 建成区重心变动与扩张方向分析
通过建成区重心位置的变化反映建成区空间分布变化情况。研究提取建成空间是由不同灰度值的像元构成的,以灰度值为权重的区域建成空间重心坐标为:
式中:xti和yti为第t年第i个像元的平均中心坐标; Mti为第t年该像元的灰度值; Xt和Yt分别为第t年研究区域平均中心的经纬度坐标。
重心偏移距离ΔX是建成区空间重心在某一研究时期内的移动距离,即
式中: 平均偏移速度Vt为重心在某一研究时期内的平均移动速度; 偏移角度αt为建成区空间重心在某一研究时期内移动的方向与正东的夹角; Xti和Yti分别为某一时刻区域建成区空间的平均重心坐标; ti+1-ti为建成区空间重心转移研究测度的时间差值。
利用标准差椭圆方法来表征建成区空间扩张方向,标准差椭圆可表现离散数据集空间密集性、分布范围、方向和形态随时间变化的动态特征[33]。椭圆长短轴分别表示建成区空间分布主趋势方向和次要方向,椭圆面积表示建成区空间分布的集中程度,即
式中
2.4 建成区景观格局指数变化分析
为更好地反映城市群建成区空间格局演变特征,运用景观生态学中的景观格局指数进行分析。选取景观总面积(total landscape area,TA)、连接度指数(connectivity index,COHESION)、聚集度指数(aggregation index,AI)、斑块密度(patch density,PD)、最大斑块面积比(largest patch index,LPI)、斑块总数(number of patches,NP)、景观形状指数(landscape shape index,LSI)、香农多样性指数(shannon’s diversity index,SHDI)、平均边界密度(edge density,ED)、蔓延度指数(contagion index,CONTAG)和周长面积分维数(perimeter area fractal dimension,PAFRAC)等11个指标,利用 Fragstats4.2软件对长株潭城市群建成区景观格局变化进行定量计算。
2.5 建成区空间自相关分析
通过空间自相关模型Moran’s I指数进一步分析建成区空间集聚和扩张情况,采用Moran散点图、LISA集聚图和热点图等来表示空间相关性情况,即
式中: m为建成区斑块数量; Wij为空间邻接情况,Wij=1为邻接状态,Wij=0为不邻接状态; Si为第i个建成区斑块空间扩张面积; Moran’s I取值为(-1,1),值越接近1空间越聚集,值越接近-1空间越离散。
3 结果与分析
3.1 长株潭城市群夜间灯光变化
从1993—2013年长株潭城市群灯光分布时空特征来看,城市群灯光总量呈现出长株潭3市地区相对密集,而其他地区相对稀疏的核心—边缘结构。城市群建成区在时间尺度上表现为长株潭3市核心向外拓展,逐渐融合成一个整体的趋势。城市群灯光密度呈现出显著的差异性,其中1993年长株潭城市群整体灯光密度为0.258 6/km2,长株潭3市灯光密度为0.578 9/km2,其余5市灯光密度为0.127 7/km2,约为长株潭3市的1/5; 2013年长株潭城市群整体灯光密度为2.469 2/km2,长株潭3市灯光密度为6.502 5/km2,其余5市灯光密度为0.820 5/km2,约为长株潭3市的1/8。可以看出,长株潭3市是明显的 “高密度” 集聚区,其余5市是相对“低密度”区域,而且这种差距在不断扩大,城市群集聚发展趋势明显。
图1
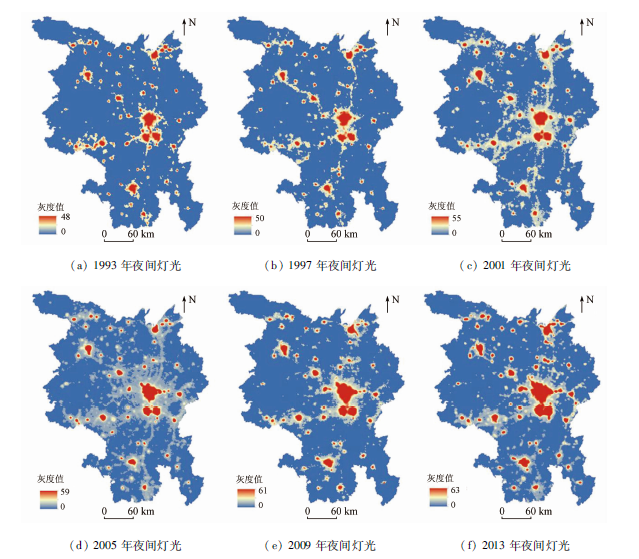
图1
长株潭城市群1993—2013年夜间灯光变化
Fig.1
Night light changes of Chang-Zhu-Tan urban agglomeration in 1993—2013
3.2 长株潭城市群建成区提取与扩张变化
研究利用统计年鉴中长株潭城市群各城市建成区面积信息和DMSP/OLS夜间灯光数据,采用二分阈值法获取每个城市不同年份的最佳阈值,利用最佳阈值提取建成区面积与统计年鉴数据对比,在1993年、1995年、1997年、1999年、2001年、2003年、2005年、2007年、2009年、2011年和2013年平均误差率分别为1.64%,-0.10%,2.27%,0.54%,-0.85%,0.27%,0.05%,-0.22%,0.50%,1.19%和-0.88%,都在3%以内。根据每个城市最佳阈值提取建成区空间信息,提取的城市群建成区面积分别为832.59 km2,927.15 km2,1 068.35 km2,1 199.94 km2,1 323.62 km2,1 501.43 km2,1 636.49 km2,1 860.59 km2,2 024.76 km2,2 198.97 km2和2 361.23 km2。再选择城市群30 m×30 m空间分辨率Landsat影像作为验证数据,评价提取建成区信息的相对精度。抽样选取2005年和2013年数据,将样本点与相对应的TM影像进行数据验证,Kappa系数为0.804 3。可以看出灯光阈值-辅助资料对比法提取的建成区数据样本精准度较高,提取结果可用来研究城市群建成区空间演变分析。
根据不同年份所提取的建成区,描绘1993—2013年建成区用地扩张情况(图2),直观展示长株潭城市群建成区时空扩张过程,可以看到城市群各城市主城区以面状发展模式为主,不规则圈层向外扩张。小城镇在大城市的外围生长呈现点状样式,还有局部地区沿着交通干道呈现线状发展。长株潭3市一体化趋势明显,长沙除了向南与株洲、湘潭融合以外,还不断向西、向北方向拓展。株洲和湘潭相互向长沙扩张外,两者之间也相互靠拢,融合趋势明显。岳阳受长江、洞庭湖地形条件限制,明显向东、向南方向发展。其他城市某些年份发展方向会发生改变,但整体呈现圈层向外扩张模式,例如衡阳先向西再向东和向南方向发展。
图2
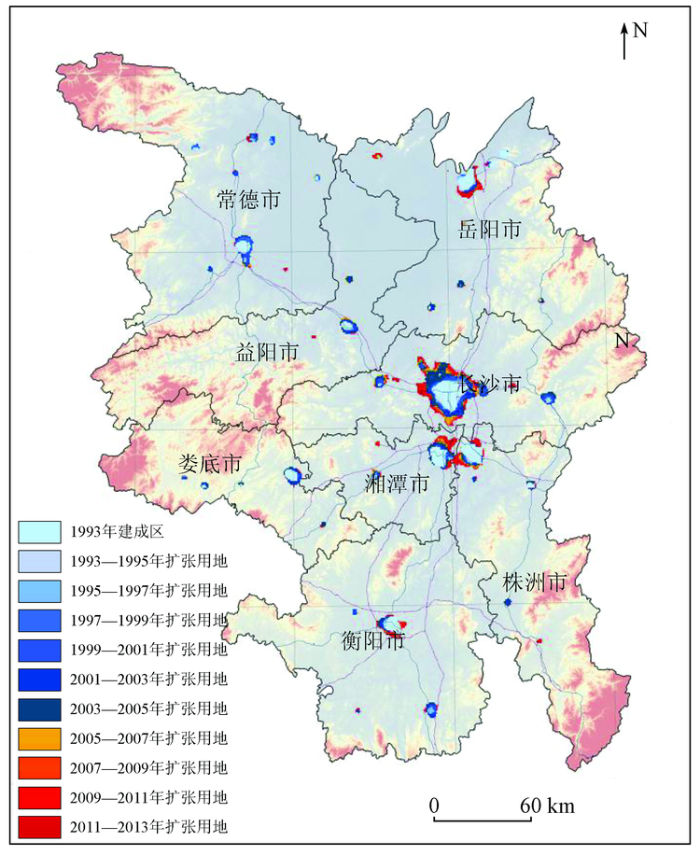
图2
长株潭城市群建成区空间扩张演变(1993—2013年)
Fig.2
Spatial expansion evolution of the built-up area in Chang-Zhu-Tan urban agglomeration (1993—2013)
在获取建成区面积的基础上分析建成区扩张速度和强度,得到长株潭城市群建成区空间扩张在时间尺度上整体呈现W型(图3),1993—1999年扩张面积、扩张速度和扩张强度3个指标都不断降低; 1999—2005年3个指标不断上升,扩张面积和扩张速度快速增加,并在2005年达到最大值,分别为380.44 km2和190.22 km2·a-1; 随后2005—2009年3个指标下降,扩张面积和扩张速度不断减少; 2009—2013年又开始缓慢增加。其中,扩张强度在1999—2003年快速增加,2003年达到最大值13.78%; 2003—2009年快速减少,2009年达到最小值1.31%。
图3
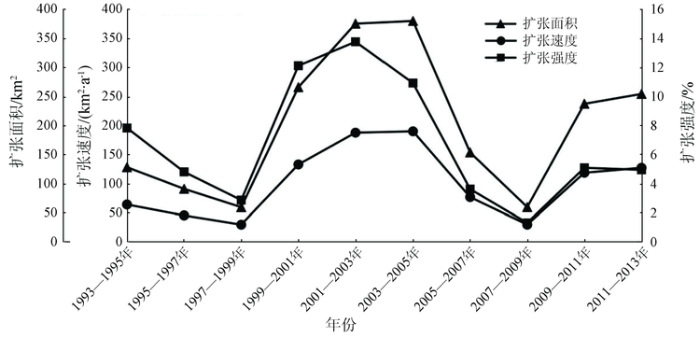
图3
长株潭城市群建成区扩张分析(1993—2013年)
Fig.3
Expansion analysis of built-up area of Chang-Zhu-Tan urban agglomeration(1993—2013)
总体上,长株潭城市群建成区面积不断扩张增大,扩张速度和扩张强度随经济社会发展上升或下降,呈现一定周期性。
3.3 长株潭城市群建成区重心变动与扩张方向
长株潭城市群建成区标准差椭圆在1993—2001年长轴略长于短轴,总体呈现“东南—西北”格局,说明“东南—西北”方向的建成区发展略强于“东北—西南”方向,常德、益阳、株洲地区建成区扩张较岳阳、衡阳明显。2001—2013年,标准差椭圆空间范围明显缩小,椭圆长短轴明显缩短,说明长株潭城市群向心集聚发展,长株潭3市核心区扩张快于城市群边缘地区。建成区空间演化向心力在1993—2013年20 a间表现为“离散—向心”增强的趋势。
长株潭城市群1993—2013年建成区重心由长沙市岳麓区转移至望城区,1993年重心始于岳麓区,1993—1995年向西北部移动,并且偏移速度为20 a间最快,达到5 432.41 m·a-1。1995—1997年转向东南方向,1997—2001年持续向西移动。这段时间重心虽然在南北方向上来回波动,但整体逐渐向西移动,说明城市群西部区域扩张快于东部区域,其中常德、益阳、娄底等地区建成区扩张较为显著。2001—2003年重心急速向南移动,偏移角度达到-95.83°,偏移距离达到10 438.88 m。2003—2011年重心转向东部,并且整体趋势为东南方向,说明这段时期长沙、株洲建成区扩张更为明显。而重心在2011—2013年又出现一次波动,从东南转向西北方向转移10 265.13 m,角度达到126.09°,2013年重心落在望城区。具体见图4和表1。
图4
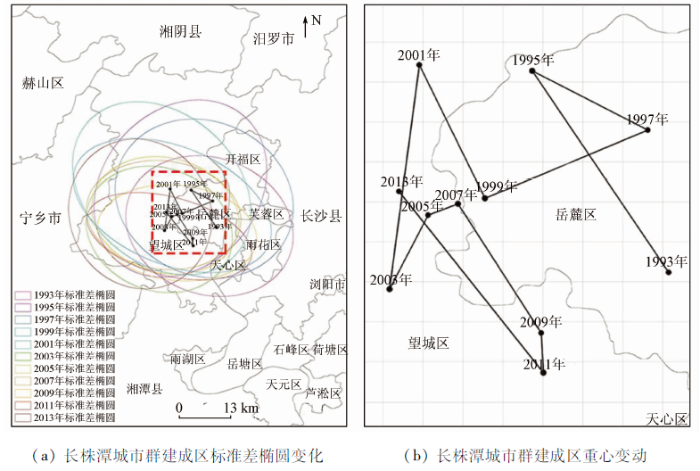
图4
长株潭城市群建成区扩张标准差椭圆及重心变动(1993—2013年)
Fig.4
Standard deviation ellipse and center of gravity change of the built-up area in Chang-Zhu-Tan urban agglomeration(1993—2013)
表1 1993—2013年长株潭城市群建成区重心偏移轨迹
Tab.1
| 年份 | 偏移距离/m | 偏移速度/ (m·a-1) | 偏移角度/(°) |
|---|---|---|---|
| 1993—1995年 | 10 864.82 | 5 432.41 | 121.81 |
| 1995—1997年 | 5 458.41 | 2 729.20 | -29.17 |
| 1997—1999年 | 7 373.87 | 3 686.94 | -153.75 |
| 1999—2001年 | 6 723.05 | 3 361.53 | 114.45 |
| 2001—2003年 | 10 438.88 | 5 219.44 | -95.83 |
| 2003—2005年 | 3 772.90 | 1 886.45 | 66.13 |
| 2005—2007年 | 1 332.19 | 666.10 | 24.04 |
| 2007—2009年 | 6 873.97 | 3 436.99 | -59.40 |
| 2009—2011年 | 1 847.86 | 923.93 | -86.29 |
| 2011—2013年 | 10 265.13 | 5 132.56 | 126.09 |
3.4 长株潭城市群建成区景观格局变化
从1993—2013年长株潭城市群建成区景观格局指标变化可知(表2),11个指标变化可归纳为3种类型: ①整体增长类型。TA,COHESION,AI,PD和LPI这5个指标呈现出整体增长特征。TA逐年不断增加,表明长株潭城市群建成区面积不断增大; COHESION,AI和PD在1993—2013年间呈现出整体不断增长的态势,在2013年均达到最大值,分别为57.71,30.98和0.52个/km2,表明长株潭城市群建成区用地不断扩张,景观分布不断集中,一体化程度不断提升; LPI在1993—2001年稍微下降,随后不断增加,在2007—2013年基本维持稳定,达到最大值0.35,表示中心城市长沙在城市群发展过程中起到了核心带动和辐射周边的作用,在自身不断发展过程中带动城市群的整体发展更加均衡化。②先增后减类型。NP,LSI,SHDI和ED这4个指标呈现出先增后减的趋势,1993—2005年间呈增长上升趋势,2005—2013年呈减少下降趋势。2005年达到最大值,NP最大值为113.73,LSI最大值为24.79,SHDI最大值为3.62,ED最大值为17.68 m/km2。表明在1993—2005年期间,城镇增长点不连续扩张,斑块数量增加,形态复杂程度越来越高; 随着时间推移,2005—2013年城镇继续扩张,独立的城镇斑块趋于融合连通成片,斑块数量减少,形状复杂程度降低,城镇发展更加紧凑,符合建成区扩张由“斑块数量增长”到“斑块规模扩张”的一般规律。③波动类型。CONTAG和PAFRAC在1993—2013年间呈现出波动状态,表明城镇发展是一个复杂的扩张过程,破碎化和城镇建设用地之间融合是一个相互独立而又不断相互影响的过程。
表2 1993—2013年长株潭城市群建成区景观格局指标
Tab.2
| 年份 | TA/ km2 | COHESION | AI | PD/ (个·km-2) | LPI | NP | LSI | SHDI | ED/ (m·km-2) | CONTAG/ % | PAFRAC |
|---|---|---|---|---|---|---|---|---|---|---|---|
| 1993年 | 832.59 | 23.35 | 12.35 | 0.26 | 0.29 | 49.80 | 16.86 | 3.30 | 17.24 | 19.05 | 1.62 |
| 1995年 | 927.15 | 21.24 | 10.90 | 0.28 | 0.28 | 52.00 | 16.90 | 3.43 | 17.68 | 16.86 | 1.63 |
| 1997年 | 1 068.35 | 25.31 | 14.78 | 0.33 | 0.29 | 50.20 | 16.97 | 3.31 | 16.94 | 20.36 | 1.57 |
| 1999年 | 1 199.94 | 23.42 | 12.49 | 0.35 | 0.28 | 49.00 | 16.42 | 3.52 | 17.45 | 16.29 | 1.61 |
| 2001年 | 1 323.62 | 25.41 | 14.44 | 0.36 | 0.28 | 71.33 | 19.86 | 3.47 | 17.08 | 18.68 | 1.56 |
| 2003年 | 1 501.43 | 24.71 | 12.70 | 0.44 | 0.28 | 96.33 | 22.97 | 3.59 | 17.49 | 17.13 | 1.59 |
| 2005年 | 1 636.49 | 26.81 | 13.96 | 0.45 | 0.31 | 113.73 | 24.79 | 3.62 | 17.38 | 17.62 | 1.57 |
| 2007年 | 1 860.59 | 35.71 | 18.39 | 0.43 | 0.35 | 102.87 | 23.65 | 3.46 | 16.60 | 16.28 | 1.57 |
| 2009年 | 2 024.76 | 37.92 | 19.38 | 0.44 | 0.35 | 99.87 | 21.08 | 3.34 | 16.76 | 20.37 | 1.61 |
| 2011年 | 2 198.97 | 42.37 | 21.09 | 0.45 | 0.35 | 95.87 | 23.65 | 3.31 | 16.19 | 18.94 | 1.59 |
| 2013年 | 2 361.23 | 57.71 | 30.98 | 0.52 | 0.34 | 90.40 | 23.06 | 2.96 | 13.73 | 18.29 | 1.55 |
3.5 长株潭城市群建成区空间集聚演化与分异
通过Moran’s I指数计算,Moran’s I数值均在0.3~0.5之间,表现出正相关特征,反映出长株潭城市群建成区空间分布呈现集聚特征(图5)。1993—2001年Moran’s I值逐渐降低,由0.368 6降至0.306 3,说明此期间长株潭城市群建成区空间集聚有弱化趋势。2001—2013年Moran’I值在波动中提高,由0.306 3增加至0.418 5,说明长株潭城市群建成区空间集聚特征有增强趋势。长株潭城市群建成区分布散点表明,1993—2013年整体集聚态势在增强,少量建成区表现出离散状态。
图5
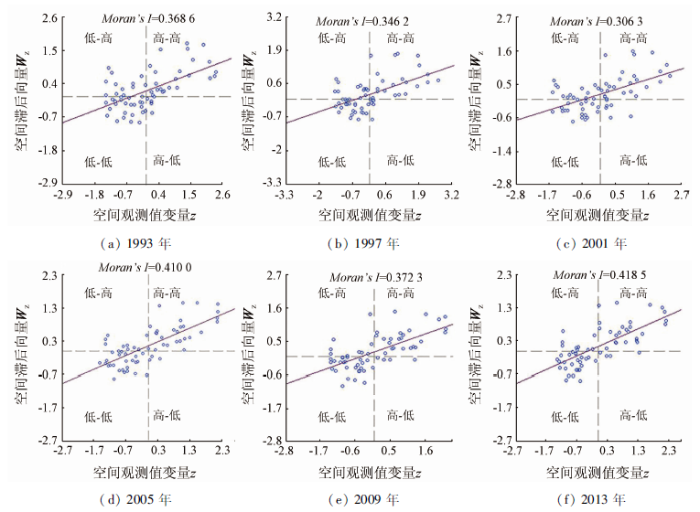
图5
长株潭城市群建成区Moran’s I指数和散点图(1993—2013年间)
Fig.5
Moran’s I index and scatter plot of the built-up area in Chang-Zhu-Tan urban agglomeration(1993—2013)
通过长株潭城市群建成区空间集聚和热点分析(图6),建成区空间集聚和热点主要集中在长株潭3市,外围5市并不明显。空间集聚方面,1993年高集聚区主要为长株潭3市中心城区,2013年高集聚区向外围扩张,基本覆盖长株潭3市市辖区和长沙县。空间热点方面,1993年热点区主要为长株潭3市市辖区以及外围的长沙县、望城区、湘潭县、韶山市和醴陵市,2013年热点区进一步扩大,在1993年基础上增加了宁乡市、湘阴市和汨罗市; 而1993年和2013年冷点区为沅江市、南县。
图6
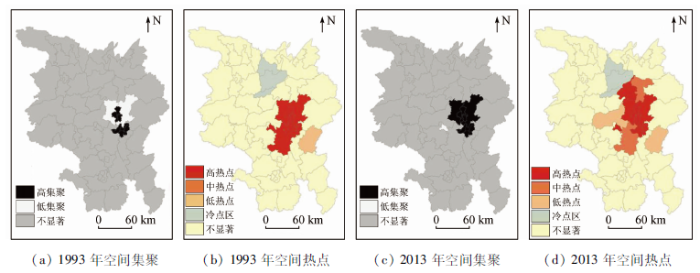
图6
1993年、2013年长株潭城市群建成区空间集聚和热点图
Fig.6
Agglomeration and hot spots of the built-up area of Chang-Zhu-Tan urban agglomeration in 1993 and 2013
4 结论与讨论
本文基于1993—2013年DMSP/OLS夜间灯光数据,利用辅助资料对比法提取城市群建成区,采用扩张规模、标准差椭圆、重心变动、景观格局指数和空间自相关等方法对长株潭城市群建成区演变特征进行了系统分析,结果表明:
1)1993—2013年间,长株潭城市群灯光总量呈现出长株潭3市相对密集,而周边5市相对稀疏的核心—边缘结构。城市群各城市中心城区以面状发展模式为主,不规则圈层向外扩张。城市群整体建成区扩张面积、扩张速度和扩张强度在时间尺度上整体呈现W型,1993—1999年3个指标不断降低,1999—2005年3个指标不断上升,在2005年达到最大值,2005—2009年下降,2009—2013年又开始缓慢增加。
2)长株潭城市群在1993—2001年“东南—西北”方向的建成区发展略强于“东北—西南”方向,常德、益阳、株洲建成区扩张较岳阳、衡阳明显; 2001—2013年,长株潭3市核心区扩张快于城市群边缘地区。向心力在1993—2013年间表现为“离散—向心”增强的趋势。建成区重心由长沙市岳麓区转移至望城区。
3)景观总面积、连通性指数和聚集度指数等指标整体增长,反映出长株潭城市群建成区用地不断扩张,景观分布不断集中,一体化程度不断提升。斑块总数、景观形状指数和香农多样性指数等指标先增后减,反映出建成区斑块数量减少,形状复杂程度降低,城镇发展更加紧凑,建成区由“斑块数量增长”到“斑块规模扩张”。
4)长株潭城市群建成区空间分布呈现集聚特征,整体集聚态势增强,少量建成区表现出离散状态。空间集聚热点区主要集中在长株潭3市市辖区以及外围的长沙县、望城区、湘潭县、韶山市、醴陵市、宁乡市、湘阴市和汨罗市,而冷点区为沅江市和南县。
利用DMSP/OLS夜间灯光数据监测和评价城市群建成区空间扩张是一种较好的技术方法,尤其对于地理空间较大区域的动态监测有技术优势。但是对于区域内小城镇灯光数据捕捉精确度一般,需要加以卫星影像数据斧正。今后的研究方向建议,一是利用多源遥感数据和土地调查数据相结合,进一步改善研究精细度; 二是加强新技术在国土空间规划中的运用,如建成区现状评价与增长模拟预测。
参考文献
长株潭城镇群体空间结构优化研究
[J].长株潭地区现有3个地级市、4个县级市、177个建制镇及360多个集镇,是湖南省城镇发育水平最高的区域,也是我国中南部地区极富个性的城镇密集区.核心城市三足鼎立,"井"字形城镇轴带组合初具规模,南部地区缺乏次级中心城市、空间演化处于集聚-扩散阶段是该区城镇群体空间结构的基本特征.研究认为,为实现长株潭城镇群体空间结构的整体优化,应构建由四级中心构成的城镇等级系统、由三级轴构成的城镇轴带系统以及由3个圈层构成的圈层结构,应合理布局市(镇)际绿色开敞空间并加速快速通道网络建设.
A study on optimization of the spatial structure of urban agglomeration in Changsha-Zhuzhou-Xiangtan
[J].
基于分形理论的长株潭城市群空间结构特征研究
[J].
Study on spatial structure of Changsha-Zhuzhou-Xiangtan urban agglomeration based on fractal theory
[J].
城市群空间结构演化趋势与空间重构——以长株潭城市群为例
[J].
Evolution tends and restructuring of spatial structure about urban agglomeration:By the case of Chang-Zhu-Tan agglomeration
[J].
基于GIS的北京城市土地利用扩展模式
[J].
A GIS based model of urban land use growth in Beijing
[J].
城市土地利用扩展的空间模式与动力机制
[J].
DOI:10.11820/dlkxjz.2002.01.005
URL
[本文引用: 1]

本文通过系统地评析国外不同学术派系对城市土地利用扩展的空间模式、动力机制及管理政策的研究进展 ,指出其研究重点已从归纳空间演替模式深化到探究城市土地开发过程中的决策过程与动力机制 ,从崇尚土地市场的自由运作转向对其进行精明管理。
Spatial patterns and dynamic mechanisms of urban land use growth
[J].
DOI:10.11820/dlkxjz.2002.01.005
URL
[本文引用: 1]
Through carrying out a systematical review on the research progress of various Western academic schools on spatial patterns and dynamic mechanisms of urban land use growth, this paper highlights that its focus has shifted from summarizing spatial evolutionary models to exploring dynamic mechanisms during the decision making process of land development, from free land market to smart growth management. Historical experiences at home and aboard demonstrate that, while the monopoly administrative allocation system would force urban land use development to become an affiliated part of administrative powers and result in inefficiency and inequality, the free market mechanism would probably push urban land development to become an growth machine solely controlled by the motivation of profit making and deliberately destroy un renewable resources and amenable ecological environment. Therefore, in order to realize sustainable urban development and coordinate the conflicts among urban development, conservation of cultivated land, and construction of ecological environment, China should, on one side, continue to accelerate its reform on urban land use system to significantly increase the importance of the market mechanism on urban land development, and establish an equal and efficient supervising mechanism on the operation of urban land market, on the other side, strengthen the macro management function of the Governmental agencies and rationally control urban land use growth motivated by the market mechanism through various growth management policies.
上海城市用地扩展强度、模式及其空间分异特征
[J].
DOI:10.11849/zrzyxb.2003.04.004
URL
[本文引用: 1]
基于多时段TM遥感影像资料,通过有关城市扩展度量指标和网格样方法等空间分析手段的综合应用,论文对上海地区城市扩展规模、强度和空间分异特征进行了研究,结果表明:①上海市区各时期城市用地扩展相对集中于宝山-闵行、嘉定-浦东等方向,并分别构成城市扩展的南北轴向和东西轴向,不同时期各轴向城市用地扩展性质和强度有明显差异,从而使各时期城市扩展表现为以城镇用地为主(1987~1990)到城镇用地与工业开发区并存(1990~1995)以及以工业开发区扩展为主(1995~2000)的形式;②整个上海地区城市化扩展模式在不同时期也发生了很大变化,由较简单的以中心市区及周边区域为主的“单核扩展”为主的模式,逐渐转变为较复杂的包括中心城区、卫星城、郊区城镇以及交通干道等周边区域的“多核扩展”和“点—轴扩展”模式,整个区域城市网络体系发育得更为完善,城市土地利用的功能也由简单趋于复杂和多元化;③从城市土地利用扩展的两种类型看,城镇用地与新开发区的扩展规模和速度及对城市土地利用扩展的贡献率等数量特征各时期存在着极为显著的差异。
The intensity and modes of urban landuse growth in Shanghai
[J].
DOI:10.11849/zrzyxb.2003.04.004
URL
[本文引用: 1]
Based on the multi-temporal remotely sensed data of TM&ETM,the magnitude,in-tensity and spatial heterogeneity of urban growth in Shanghai region were studied by integrating the urbanization index with GIS gridding analysis,the results indicate that:1)The urban landuse growth relatively centralized along the directions represented by Baoshan-Minhang,and Jiading-Pudong,which also formed south-north and east-west axis of urban growth respectively.The ur -ban landuse composition(i.e.,residential&industrial landuse)and growth rate differed much in each stage,which led to the urban growth dominated by different urban landuse types and thus pre sented different performance.The urban landuse growth were controlled by the residential lan- duse from1987to1990firstly,and then transformed being composed of residential and in dustri-al landuse from1990~1995.Finally,the industrial landuse acted as the key contributor to the ur -ban landuse growth,2)The urban growth modes were distinct in each stage,and showed the gen-eral trend from"single core growing"(urbanization is organized by single large city central)to the modes of"multi-core growing"and"point-axis growing"(urbanization are co-launched by city cen-tral,satellite towns and main traffic lines),thus the whole urbanization network has been setup and upgraded greatly,followed by the urban landuse function changed to be more complicated and multi-use oriented,3)the magnitude,rate and contribution to urban landuse growth showed strong difference for the landuse of city growing and developing zone.The city growing landuse dominated by the residential area decreased sharply in contrast with the rapidly increased trend for the landuse of developing zones,which manifest that the establishment and expansion of de-veloping zones played a key role in urban landuse growth in the past decade.
基于重心-GTWR模型的京津冀城市群城镇扩展格局与驱动力多维解析
[J].
DOI:10.11821/dlxb201806007
URL
[本文引用: 1]
城镇用地扩展格局及驱动力研究对城市群发展规划与决策具有重要意义。以京津冀地区为例,基于城镇用地扩展强度指数、城镇用地扩展差异指数、分形维数、土地城镇化率和重心转移模型,多维解析了城市群城镇用地扩展格局特征,并耦合重心转移模型和时空地理加权回归(GTWR)模型构建重心-GTWR模型,在对空间格局进行长时间序列多维度指标分析的基础上,运用该模型依序对其特征进行驱动力解读,进而总结凝练京津冀区域发展的主导模式与城市核心驱动力。主要结论为:① 1990-2015年,京津冀城市群城镇用地扩展强度呈现“下降—上升—下降”的趋势,高峰时期在2005-2010年,在2005年之前高速发展城市集中在北京、天津、保定和廊坊,2005年之后集中在邢台和邯郸;② 城市群城镇用地重心虽呈现出发散态势,但城市之间的局部相互作用力逐渐增强,城镇用地扩展驱动力表现出空间溢出特征;③ 京津冀城市群空间发展模式由以北京和天津为中心的双核发展模式向多核发展模式转变,并出现北部资源运输核心、中部经济发展核心和南部投资发展核心三大功能核心组团,城市群趋向于多核功能协同发展模式;④ 重心-GTWR模型结合了时空非平稳性和城市空间相互作用,将城市群城镇用地扩展作为一个时空变化系统进行分析,经验证,该模型在城镇用地扩展格局驱动力分析研究中具有可行性。
Multi-dimensional analysis of urban expansion patterns and their driving forces based on the center of gravity-GTWR model:A case study of the Beijing-Tianjin-Hebei urban agglomeration
[J].
DOI:10.11821/dlxb201806007
URL
[本文引用: 1]
Research into urban expansion patterns and their driving forces is of great significance. Under the background of the integrated development of the Beijing-Tianjin-Hebei (Jing-Jin-Ji) urban agglomeration, it is important to study the temporal and spatial patterns of urban land expansion and the driving forces development. This paper uses land-use data of the Jing-Jin-Ji urban agglomeration from 1990 to 2015 and reveals the multi-dimensional characteristics of the urban land expansion patterns. We then combine the urban spatial interaction and the spatial and temporal nonstationarity of the urban land expansion process and build the center of gravity-geographically and temporally weighted regression (GTWR) model by coupling the center of gravity model with the GTWR model. Using the center of gravity-GTWR model, we analyze the driving forces of urban land expansion at the city scale, and summarize the dominant mode and core driving forces of the Jing-Jin-Ji urban agglomeration. The results show that: (1) Between 1990 and 2015, the expansion intensity of the Jing-Jin-Ji urban agglomeration showed a down-up-down trend, and the peak period of expansion was in 2005-2010. Before 2005, high-speed development was seen in Beijing, Tianjin, Baoding, and Langfang, which were then followed by rapid development in Xingtai and Handan. (2) Although the center of gravity of cities in the Jing-Jin-Ji urban agglomeration showed a divergent trend, the local interaction between cities was enhanced, and the driving forces of urban land expansion showed a characteristic of spatial spillover. (3) The spatial development mode of the Jing-Jin-Ji urban agglomeration changed from a dual-core development mode to a multi-core development mode, which was made up of three function cores: the transportation core in the northern part, the economic development core in the central part, and the investment core in the southern part. The integrated development between functional cores led to the multi-core development mode. (4) The center of gravity-GTWR model analyzes urban land expansion as a space-time dynamic system. The model proved to be feasible in the analysis of the driving forces of urban land expansion.
我国城市用地扩张的驱动力分析
[J].
An analysis of driving forces of urban land expansion in China
[J].
城市扩展及其驱动力遥感分析——以厦门市为例
[J].
Urban expansion and its driving force analysis using remote sensed data:A case of Xiamen City
[J].
基于Logistic-GTWR模型的武汉城市圈城镇用地扩展驱动力分析
[J].
Analysis of driving forces of urban land expansion in Wuhan metropolitan area based on Logistic-GTWR model
[J].
长江三角洲地区城市用地增长的时空特征分析
[J].
Spatio-temporal characteristics of urbanization area growth in the Yangtze River Delta
[J].
苏州地区城镇扩展的空间格局及其演化分析
[J].
Urban spatial growth pattern and its evolution in Suzhou,Jiangsu Province,China
[J].
长江三角洲地区城镇空间扩展特征及机制
[J].
Urban spatial expansion process,pattern and mechanism in Yangtze River Delta
[J].
Burning waste gas in oil fields
[J].DOI:10.1038/245375a0 URL [本文引用: 1]
A technique for using composite DMSP/OLS city lights satellite data to accurately map urban areas
[J].DOI:10.1016/S0034-4257(97)00046-1 URL [本文引用: 1]
基于夜间灯光数据的城市建成区提取方法评价与应用
[J].DMSP/OLS夜间灯光数据已被广泛应用于城市建成区的提取。目前主要存在4类提取方法:经验阈值法、突变检测法、统计数据法和较高分辨率影像数据空间比较法。以上海为例,在2000年、2003年、2006年夜间灯光数据的基础上,利用4种方法完成了城市建成区的提取。通过对不同年份数据提取结果的比较,证明了相同的灰度分割阈值对不同年份的夜间灯光数据中不存在通用性;在对2003年夜间灯光数据的提取中,4类方法所得结果精确度从高到低依次为统计数据法、突变检测法、经验阈值法和较高分辨率影像数据空间比较法,相对误差分别为1.3%、2.1%、5.1%和11.2%,在对4种方法的便捷性和可实现性进行分析与评价后,使用突变检测法完成了上海市2000~2006年城市建成区的提取。
Methods for deriving urban built-up area using night-light data:Assessment and application
[J].Night\|light data from the Defense Meteorological Satellite Program (DMSP) Operational Linescan System (OLS) has been widely utilized to derive the urban built\|up areas.Four major methods,including Empirical Thresholding,Sudden Change Detection,Statistics\|assisted Thresholding,and TM\|assisted Thresholding,have been proposed to determine the threshold value for separating the illuminated urban areas from the dark background of rural areas in DMSP/OLS night\|light images.This paper makes a comprehensive assessment of those methods through a case study of Shanghai,China.The methods are implemented to extract the urban built\|up area for Shanghai using DMSP/OLS stable light data acquired in 2003.Then,the same threshold values obtained from 2003 DMSP/OLS night\|light data are applied respectively to the 2000 and 2006 DMSP/OLS data,resulting in a significant error in urban built\|up area detection.This analysis result suggests that the threshold value determined for a specific year cannot be extended and transferred to other years.The failure in temporal extensibility of threshold value means that an appropriate threshold value has to be determined for every year when a time series of DMSP/OLS nigh\|light data need to be processed.Therefore,the method that determines threshold value independent of reference data is more suitable for processing time series DMSP/OLS data.The Sudden Change Detection method does not require ancillary reference data and is the best choice of those methods considering the convenience,accuracy,and automated data processing,and it is then adopted to derive the urban built\|up areas of Shanghai from 2000 to 2006.
利用DMSP/OLS稳定夜间灯光数据提取城镇用地信息的分层阈值法研究
[J].
Research on the layered thresho-ld method for extracting urban land using the DMSP/OLS stable night time light data
[J].
DOI:10.11834/jig.20110426
URL
[本文引用: 1]
DMSP/OLS nighttime light data is effective and economical for mapping urban land on a large scale. Based on conventional dichotomy method, Layered Threshold Method (LTM) was developed to extract the urban land using the DMSP/OLS stable nighttime light data. The administrative regions with close thresholds were divided into the same set by LTM continually. The process was ended until the thresholds in one set were selfsame. The urban land of Chinese mainland in 2002 was extracted based on LTM using the DMSP/OLS stable nighttime light data. Compared to the traditional inefficient dichotomy method, whose efficiency depended on the amount of administrative regions, LTM searched the thresholds of the sets instead of each administrative region, optimizing the previous method. The performance of the LTM was evaluated to be credible and valuable according to statistical data and Landsat ETM+ data.
基于DMSP/OLS数据的城市中心城区提取新方法
[J].
A new method of extracing areas of center city regions based on DMSP/OLS data
[J].
基于DMSP/OLS数据的中国大尺度城镇用地信息提取
[J].
Extraction of large-scale urban area information in China using DMSP/OLS nighttime light data
[J].
基于夜间灯光数据的中国城市用地扩展类型
[J].
Identification and characteristics analysis of urban land expansion types in China in the 1990s using DMSP/OLS data
[J].
基于DMSP/OLS灯光数据的1992—2010年中国城市空间扩张研究
[J].
Urban spatial expansion based on DMSP/OLS nighttime light data in China in 1992—2010
[J].
Mapping sub-pixel urban expansion in China using MODIS and DMSP/OLS nighttime lights
[J].
基于DMSP/OLS夜间灯光数据的土地城镇化水平时空测度研究——以环渤海地区为例
[J].
Study on temporal and spatial measurement of land urbanization based on DMSP/OLS night light data:A case study of the Bohai rim region
[J].
成渝经济区近20年城市扩展研究——基于DMSP/OLS夜间灯光数据
[J].
Research on the urban expansion in Chengdu-Chongqing Economic Zone based on DMSP/OLS nighttime light data in recent 20 years
[J].
基于DMSP-OLS夜间灯光数据的长江经济带城镇体系空间格局演变(1992—2013)
[J].
Spatial pattern evolution of urban system in Yangtze River economic belt based on DMSP-OLS night light data(1992—2013)
[J].
基于DMSP/OLS夜间灯光数据的环渤海城市群时空演变研究
[J].
Study of spatio-temporal evolution of the circum-Bohai urban agglomeration based on DMSP/OLS night-time light data
[J].
江苏省城镇建设用地扩展时空格局演化——基于1993、1998、2003年度夜间灯光数据的分析
[J].
The spatio-temporal characteristics of the urban and town construction land expansion in Jiangsu Province from DMSP-OLS nighttime images
[J].
基于TM图像和夜间灯光数据的区域城镇扩张监测——以浙江省为例
[J].
DOI:10.6046/gtzyyg.2014.01.15
URL
[本文引用: 1]
以浙江省为研究区,利用收集到的Landsat TM图像、DMSP/OLS夜间灯光数据及其他辅助数据,开展区域城镇扩张监测方法的研究,并在此基础上分析了浙江省1995—2010年间城镇扩张的时空特征。结果表明:基于分类回归树算法,综合利用TM数据和DMSP/OLS夜间灯光数据,可精确稳定地提取城镇信息;1995—2010年间,浙江省城镇用地持续增加,除洞头县、庆元县、文成县、云和县、兰溪市、龙泉市和绍兴市等7个县市扩张加速度有所减缓外,全省其余市、县均处于加速扩张阶段;浙江省城镇扩张地域差异明显,表现为沿海地区的城市化水平整体高于内陆地区,地势平坦地区高于地形复杂地区,从而形成了杭州、绍兴、温州3大沿海城市群和以金华为中心的内陆地区中小城市带。
TM image and nighttime light data to monitoring regional urban expansion:A case study of Zhejiang Province
[J].
基于DMSP/OLS数据的河南省城市空间格局及动态扩张分析
[J].
Urban spatial pattern and dynamic expansion in Henan Province based on DMSP/OLS data
[J].
基于DMSP/OLS数据的江苏省城镇人口空间分异研究
[J].
Study on spatial differentiation of urban population in Jiangsu Province based on DMSP/OLS data
[J].
DOI:10.11870/cjlyzyyhj201512004
URL
[本文引用: 1]
The study on the spatial distribution of population is a fundamental determinant of region development. To aaccurately obtain the global and local spatial information has important significance to formulate reasonable regional development policies. Based on the quantitative association between DMSP/OLS nighttime lights data and population- data, this study simulated grid scale population density of Jiangsu Province in 2012. With the use of population concentration index and spatial variogram analysis, population space structural features and spatial variation have been identified. The results can further explain the microscopic scales of population space differentiation characteristics. Studies have shown the results showed that: 1) At the Rregional level, there is a significant population spatial differentiation phenomenon in Jiangsu province. In northern Jiangsu, it acts as "low-density dot" distribution characteristics, while in south of Jiangsu it acts as "high-density surface-shaped " distribution. 2) At the Urrban level, The spatial distribution of population structure of Jiangsu Province has four types: H-H type has the strongest anisotropic difference, with the minimum random variation within the grid; H-L type has the smallest anisotropic difference, but the random variation within the grid is large; L-L type has obviously axial homogenization characteristics, and the random variation of grid unit is small; L-H type's space anisotropy is small, and it has the maximum grid cell random variation. The results showed that the non-radiance calibrated DMSP / OLS nighttime lights image has the potential to provide population density estimation at grids units, combined with the use of fitted variogram can quantitatively present inside spatial heterogeneity of urban population distribution.
A cluster-based method to map urban area from DMSP/OLS nightlights
[J].
DMSP/OLS数据应用研究综述
[J].
Overview of researches based on DMSP/OLS nighttime light data
[J].
City size distributions for India and China
[J].DOI:10.1016/j.physa.2009.03.019 URL [本文引用: 1]
