

0 引言
近年来,有不少学者基于Landsat数据利用一个集成了多种反映生态环境的指标[4,5,6],并通过综合指数法、层次分析法、主成分分析法、物元评价法等构建的新型遥感生态指数(remote sensing based ecological index,RSEI),围绕研究区某一时段开展定性或定量分析,这对描述生态环境时空特征变化具有一定的实践意义与较高的参考价值。而目前,具有快速、实时等优势的多源遥感技术不断进步和提升,新一代多源遥感技术也不断更新和日趋成熟,可充分利用各种手段获取互补、合作性多源遥感信息,也使实时动态监测及评价生态环境状况变得更加高效[7,8]。天宫二号于2016年9月15日发射,搭载着新一代宽波段、宽视场和“图谱合一”的宽波段成像光谱仪,全球首次在单台仪器上实现了可见近红外、短波红外及热红外谱段大视场全推扫成像的组合集成功能[9,10]。孙明等[11]利用天宫二号宽波段成像仪数据建立多因子综合指数评价模型,对马山县进行生态环境适宜性评价,探讨天宫二号宽波段成像仪在生态环境监测中的应用; Peng等[12]利用天宫二号宽波段成像仪数据对吴哥窟及其周边环境进行了监测,结果表明天宫二号宽波段成像仪在土地利用分类中有应用潜力; Mu等[13]利用天宫二号宽波段成像仪可见近红外谱段、短波红外谱段对美国南部干旱进行监测,结果表明: 天宫二号宽波段成像仪可成为干旱监测的有效数据来源; Cong等[14]利用天宫二号宽波段成像仪数据与Landsat数据融合影像对黄河三角洲湿地近30 a内变化进行研究,发现天宫二号宽波段成像仪数据与高分辨率图像融合后更有利于湿地研究。虽然很多学者将天宫二号宽波段成像仪用于多方面的科学研究中,但以城镇为视角基于天宫二号宽波段成像仪对地区生态环境评价的研究较少。鉴于此,本文利用多源遥感技术结合较少人为因素参与的主成分分析法[4],将由多种遥感生态指标构建的RSEI综合运用于我国西部干旱区,可实现对干旱区生态环境的快速监测与评价,对地区生态环境保护具有重要意义。
本文将天宫二号宽波段成像仪应用于干旱区绿洲城镇生态环境监测,针对天宫二号宽波段成像仪数据,综合利用Landsat8数据计算多种遥感生态指标结合主成分分析法构建RSEI,监测与评价我国西部典型干旱绿洲城镇博湖县生态环境现状,并从自然环境及社会经济方面进行驱动力分析,旨在为当地生态环境保护及发展提供依据。
1 研究区概况及数据源
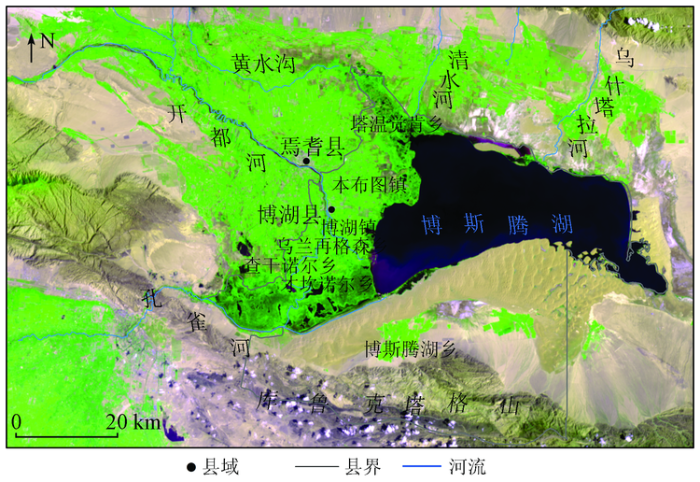
图1
1)遥感影像数据。本文的数据源包括: ①2018年8月18日天宫二号宽波段成像仪数据,来源于中国载人航天工程(
表1 天宫二号宽波段成像仪数据指标
Tab.1
| 波段 | 可见近红外谱段 | 短波红 外谱段 | 热红外 谱段 | |
|---|---|---|---|---|
| 通道范围/μm | V1: 0.970~0.990 | V8: 0.655~0.675 | S1: 1.230~ 1.250 | T1: 8.125~ 8.825 |
| V2: 0.930~0.950 | V9: 0.610~0.630 | S2: 1.630~ 1.650 | T2: 8.925~ 9.275 | |
| V3: 0.895~0.915 | V10: 0.555~0.575 | |||
| V4: 0.845~0.885 | V11: 0.510~0.530 | |||
| V5: 0.810~0.830 | V12: 0.480~0.500 | |||
| V6: 0.740~0.760 | V13: 0.433~0.453 | |||
| V7: 0.6775~0.6875 | V14: 0.403~0.423 | |||
| 空间分辨率/m | 100 | 200 | 400 | |
2018年博湖县土地利用类型的提取是在ENVI5.3软件中对Landsat8数据进行最大似然法监督分类得出,主要分为水体、耕地、湿地、沙地、山体、未利用地及城镇用地共7种土地利用类型,结合Google Earth验证其精度为81.73%,可满足研究需求,并对分类后影像进行分类后处理。
2)社会经济数据。利用《博湖县2018年国民经济和社会发展统计公报》(
3)气象数据。由于距离研究区最近的国家气象站是焉耆县气象站,其气候环境与博湖周边气候环境基本一致,通过中国气象数据网(
2 研究方法
2.1 基于天宫二号及Landsat8 OLI-TIRS数据的RSEI
图2
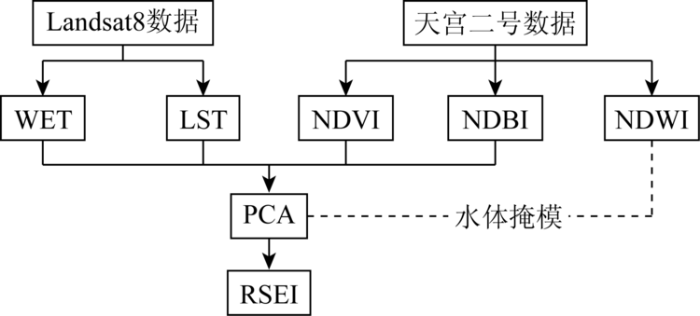
1)绿度指标。NDVI是在监测和评估植被覆盖度等方面应用最为广泛的植被指数[19],即
式中ρV4和ρV8分别为天宫二号宽波段成像仪数据可见近红外谱段第4和第8波段反射率。
2)干度指标。本文代表干度指标的建筑指数是NDBI,由天宫二号宽波段成像仪数据计算[20],即
式中ρS2为天宫二号宽波段成像仪数据短波红外谱段第2波段反射率。
3)水体指数。由于本研究区拥有全国最大的内陆淡水湖——博斯腾湖,为了防止水域影响主成分载荷分布[4],利用归一化差值水体指数(normalized difference water index,NDWI)生成研究区地表水体掩模,即
式中ρV10为天宫二号宽波段成像仪数据可见近红外谱段第10波段反射率。
5)热度指标。本文选用Landsat8 TIRS数据计算LST代表热度指标,LST所需要的大气剖面参数可通过网址(
2.2 综合指数的构建
环境评价主要可以分为2类: 正向指标(指标值越大越好)和负向指标(指标值越小,环境质量越好)。利用式(4)先对4个指标进行标准化,将量纲统一,便于结合主成分变换(principal component analysis,PCA)来构建RSEI[24],即
式中: NIi为标准化值; Imax和Imin分别为各指标最大和最小值。
综合指数用到的4种指标便于从遥感影像中快速提取出来,并可以直观地看到生态环境质量,因此常被用在生态环境评价中[25],即
为各指标因素之间能进行相互比较,对RSEI进行标准化,得到最终建立的RSEI,即
式中RSEI0,RSEI0_max和RSEI0_min分别为原始RSEI值及其最大、最小值。
2.3 空间自相关分析法
3 结果与分析
3.1 RSEI的构建
表2 PCA结果
Tab.2
| 年份 | 指标 | PC1 | PC2 | PC3 | PC4 |
|---|---|---|---|---|---|
| 2018年 | 绿度(NDVI) | 0.936 | 0.174 | 0.025 | 0.306 |
| 干度(NDBI) | -0.828 | 0.218 | 0.503 | 0.117 | |
| 湿度(WET) | 0.737 | 0.608 | 0.216 | -0.200 | |
| 热度(LST) | -0.642 | 0.671 | -0.365 | -0.064 | |
| 特征值 | 2.517 | 0.898 | 0.434 | 0.151 | |
| 贡献率/% | 62.922 | 22.455 | 10.839 | 3.785 |
表3 RSEI和各指标的相关性统计
Tab.3
| 指标 | 绿度 (NDVI) | 湿度 (WET) | 干度 (NDBI) | 热度 (LST) | RSEI |
|---|---|---|---|---|---|
| 绿度 (NDVI) | 1.000 | 0.783**① | -0.723** | -0.669** | 0.935** |
| 湿度 (WET) | 0.783** | 1.000 | -0.747** | -0.667** | 0.842** |
| 干度 (NDBI) | -0.723** | -0.747** | 1.000 | 0.52** | -0.858** |
| 热度 (LST) | -0.669** | -0.667** | 0.52** | 1.000 | -0.683** |
| RSEI | 0.935** | 0.842** | -0.858** | -0.683** | 1.000 |
①**在0.01级别(双尾)相关性显著。
为了更好地表明构建的RSEI的合理性及了解各指标间的相关程度,结合相关系数检验模型来验证其适宜性,当相关系数值靠近1,表明所建立的RSEI的适宜性越好[6]。
从表3可看出,RSEI与绿度(NDVI)、湿度(WET)均呈正相关,与干度(NDBI)、热度(LST)均呈负相关。其中,RSEI与绿度(NDVI)相关性最显著,相关性为0.935。其次RSEI和湿度(WET)、干度(NDBI)相关性分别为0.842和-0.858,均达到显著相关,与热度(LST)的相关性较好。说明RSEI与各单一指标相关性较好,新建的RSEI集成了各指标的信息,能综合代表生态环境质量状况。此外,热度(LST)和绿度(NDVI)、湿度(WET)均呈负相关,相关性分别为-0.669和-0.667,而与干度(NDBI)为正相关,相关性达到0.52。绿度(NDVI)与湿度(WET)呈正相关,相关性为0.783。
3.1.1 遥感生态环境质量分析
为了进一步了解各生态环境质量指标及遥感生态指数状况,统计了各指标标准化后及RSEI的统计值(表4)。
表4 各指数及RSEI统计值
Tab.4
| 指标 | 均值 | 标准差 |
|---|---|---|
| 绿度(NDVI) | 0.574 | 0.148 |
| 干度(NDBI) | 0.365 | 0.117 |
| 湿度(WET) | 0.423 | 0.028 |
| 热度(LST) | 0.779 | 0.084 |
| RSEI | 0.393 | 0.291 |
3.1.2 生态环境质量等级分析及空间分布特征
表5 博湖县生态环境等级面积与比例
Tab.5
| RSEI等级 | 划分依据 | 面积/km2 | 比例/% |
|---|---|---|---|
| 差 | [0,0.2) | 1 012.80 | 38.83 |
| 较差 | [0.2,0.4) | 616.22 | 23.62 |
| 中 | [0.4,0.6) | 158.19 | 6.06 |
| 良 | [0.6,0.8) | 415.36 | 15.92 |
| 优 | [0.8,1.0] | 405.79 | 15.56 |
从表5可以看出,RSEI均以差等级[0,0.2)为主,比例最高达到38.83%,生态环境质量整体处于差水平,研究区生态环境较为恶劣,空气干燥,风沙较多,因此需大力植树造林,防止风沙侵入湖泊,防止湖区污染。较差等级占23.62%,良和优等级比例相差不大,分别为15.92%和15.56%,占比最小的是中等级,为6.06%。
图3
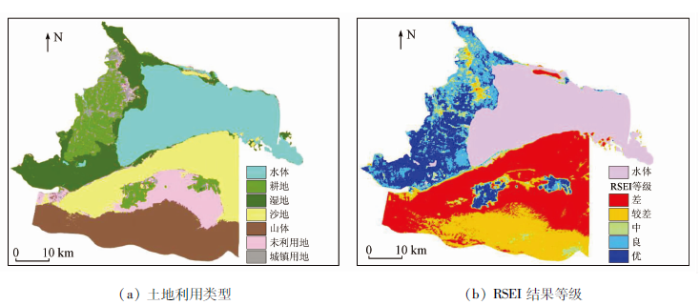
图3
2018博湖县土地利用类型分类及RSEI结果等级
Fig.3
LUCC and RSEI result grade diagram of Bohu in 2018
通过1 km×1 km的格网对2018年RSEI专题影像进行全图采样,共2 608个样点,不仅可以更好地理解生态环境质量的空间分异特征,还能保证尺度内信息的完备性及定量评价的精准度。通过Moran’s I确定某一变量是否在空间上相关及其相关程度大小,来定量描述要素在空间上的依赖关系,如图4所示。
图4
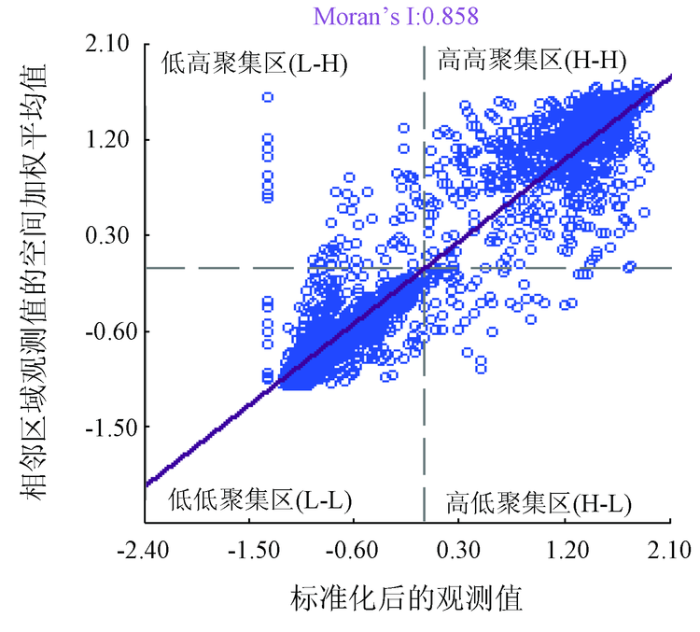
图4
2018年博湖县RSEI Moran散点图
Fig.4
Moran scatter plots of the RSEI of Bohu in 2018
由图4可以看出,区域RSEI分布集中,离散点较少,呈现了连续分布的态势,散点主要分布在第一、三象限,Moran’s I指数达到0.858,表明研究区生态环境质量有显著的空间正相关性,即RSEI呈现显著的高值区与高值区临近,低值与低值区临近的聚集状态。
为直观地识别RSEI典型集聚类型,对RSEI专题图采集的2 608个样点进行局部空间自相关分析,得到LISA集聚图(图5(a))和LISA显著性水平图(图5(b))。由图5(a)所示,博湖县RSEI存在3类空间关联模式,即高高聚集类型(H-H),低低空间集聚类型(L-L)和高低空间离群类型(H-L)。其中“H-H”正关联的地区,占研究区总面积(去除水体掩模)的33.35%,主要分布在县境北部湿地和中西部查干诺尔乡、乌兰再格森乡、才坎诺尔乡及南部博斯腾湖乡农用地及湿地; 从局部自相关显著性程度来看(图5(b)),大部分地区单元P值为0.001的显著性水平,极小部分地区为0.05及0.01,表明生态环境热点区域十分显著。这些地区RSEI较高,生态系统及生态功能相对较高,空间关联程度较高。在实际中,博斯腾湖北部洪积扇、开都河入湖三角洲及博斯腾湖西面水资源丰富,且土壤肥沃,排灌溉条件较好,为农耕提供有利条件,与基于RSEI的“H-H”型集聚区在空间位置上基本吻合。南部沙地、未利用地及一部分库鲁克塔格山等区域位于“L-L”关联区,占研究区总面积的48.77%,从局部自相关显著性水平来看,大部分地区单元P值为0.001的显著性水平,部分地区为0.05及0.01,表明生态环境冷点区域显著。这些区域RSEI较小,生态环境质量较差,且生态环境之间存在着某种相互干扰关系,存在着空间关联性,表现出显著正相关性。在实际中,博斯腾湖南部沙地及未利用地植被覆盖度低,积盐作用较为严重,与基于RSEI的“L-L”集聚
图5
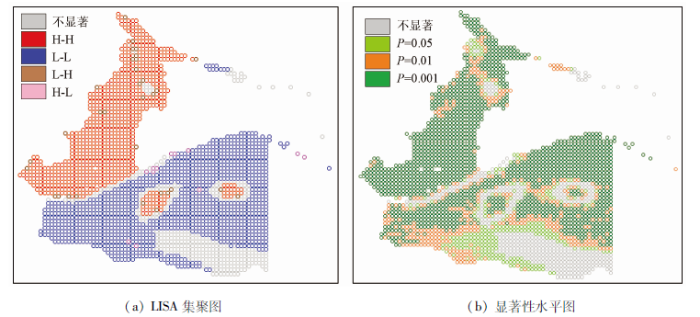
型区在空间位置上基本吻合。总的来看,博湖县生态环境“H-H”和“L-L”空间集聚类型中P值为0.05,0.01及0.001的区域总面积分别为280 km2,410 km2和1 497 km2。有极少数的区域与周围区域的RSEI差距比较大,呈现出“H-L”和“L-H”负联系,仅占研究区面积的1.69%,零星分布于塔温觉肯乡的未利用地、博湖镇的城镇建筑用地及博斯腾湖南部边界等,该类地区受自然或人为因素的影响,区域RSEI差距较大,且高低地区不相互影响,与周围的生态环境存在着明显的差异性。另外有16.14%的不显著区域,这些地区间的RSEI关联程度较低,相互影响机制不明显,区域对抗外界干扰和自我恢复能力较强。
3.2 构建区域RSEI预测模型
为进一步描绘研究区城镇生态环境质量,建立城镇生态环境质量模型,用以模拟和预测博湖县的生态环境状况。将上一步网格化采集的样点,以RSEI作为因变量,绿度(NDVI)、湿度(WET)、热度(LST)、干度(NDBI)为自变量建立2018年区域回归关系模型(通过了1%的显著性检验),即
4个评价指标仍然可从所得模型中看到,表明这些指标均为城镇生态环境质量评价的重要指标,因此可作为预测变量,评价结果可信。绿度(NDVI)、湿度(WET)指标系数大于0,表明对生态环境质量有正向作用,热度(LST)、干度(NDBI)系数小于0,表明对生态环境质量有负向作用。观察回归方程系数绝对值总和,在生态环境中有正面影响的绿度(NDVI)及湿度(WET)整体作用比负面影响的热度(LST)和干度(NDBI)大。
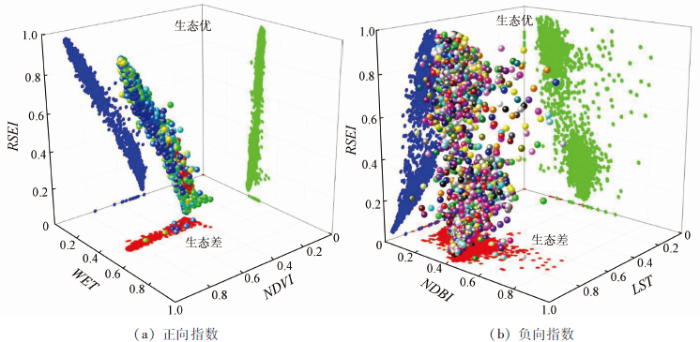
图6为各个指标与RSEI的关系,将正向指数(绿度(NDVI)和湿度(WET))、负向指数(热度(LST)和干度(NDBI))分别与RSEI投影至三维空间。生态环境状况较好的点主要分布在三维散点图顶端,其聚集湿度大和植被覆盖度高的地区; 而生态环境条件较弱的点位于底部,汇集热度高、植被覆盖度低、地表干化程度较严重地区。面向生态环境有促进作用的绿度(NDVI)、湿度(WET)和RSEI的投影散点斜率对于有抑制作用的热度(LST)、干度(NDBI)来说较大,这与以上通过回归模型系数分析结论一致。对于博湖县生态环境来说,绿度(NDVI)象征的植被及热度(LST)象征的LST起到的作用较大,且绿度(NDVI)比热度(LST)大。如以2018年建立的回归模型进行预测分析,未来要想研究区的RSEI提升0.1单位,其NDVI需增加0.061单位,或减少0.142单位的LST,生态质量才能得以改善。而实际中,湿度和热度原本就有此消彼长的作用[7]。因此,需充分利用当地资源,大力植树造林,防止风沙侵入湖泊,防止湖区污染,采用植物纤维覆盖裸地,使沙丘达到保护湿地、固沙的目的。
图6
3.3 驱动因素分析
绿洲城镇生态环境状况的影响因素不仅存在自然因素,也有社会经济发展因素,自然因素的综合作用决定其条件与分布状况,社会经济发展因素制约其发展,因此分别从自然因素与社会经济发展角度来阐述它们对该绿洲城镇生态环境现状的影响。
3.3.1 自然因素
气温和降水是影响区域生态环境变化的主要因素,根据焉耆县气象站数据如表6所示,博湖县2018年平均气温为9.11 ℃,最热月份为7月,其平均气温为23.9 ℃,其次是6月及8月,平均气温达到22.9 ℃; 年平均相对湿度53.67%,由于处于博斯腾湖下游,植被较多,所以夏季降水量较多,蒸散大,空气相对湿度受下垫面影响也较大,冬季降水量较少,地形逆温较强,蒸散较小,空气湿度高于周边及巴州南部,具备显著“湿度效应”[15]。全年平均降水量为5.77 mm,其中5月降水量最大为25.2 mm。年均蒸发量为1 933.61 mm,其中4—10月蒸发量较大为3 276.6 mm。蒸降比为335∶1,即干燥度为335。大风日数不多,集中于3—9月,多为西北风。全年总日照时数为254.75 h。总体来看2018年8月博湖县平均气温较高,区域气候较为干燥,蒸发量大,进而影响区域LST的值,故在研究区山体、南部未利用地与沙地出现或加重生态风险。
表6 2018年博湖县气候特征值
Tab.6
| 气象指标 | 1月 | 2月 | 3月 | 4月 | 5月 | 6月 | 7月 | 8月 | 9月 | 10月 | 11月 | 12月 | 合计 | 年平均 |
|---|---|---|---|---|---|---|---|---|---|---|---|---|---|---|
| 平均气温/℃ | -10.7 | -5.3 | 8.3 | 14.1 | 18.2 | 22.9 | 23.9 | 22.9 | 16.3 | 8.8 | 0.1 | -10.2 | 109.3 | 9.11 |
| 平均相对湿度/% | 68 | 62 | 50 | 34 | 40 | 46 | 49 | 56 | 52 | 55 | 67 | 65 | 644 | 53.67 |
| 降水量/mm | 0.8 | 0.1 | 5.6 | 0 | 25.2 | 4.7 | 1 | 15.4 | 1.9 | 14.3 | 0.2 | 0 | 69.2 | 5.77 |
| 蒸发量/mm | 17.6 | 39.2 | 146 | 3 276.6 | 3 276.6 | 3 276.6 | 3 276.6 | 3 276.6 | 3 276.6 | 3 276.6 | 44.9 | 19.4 | 23 203.3 | 1 933.61 |
| 平均风速/(m.s-1) | 1.4 | 1.5 | 2.2 | 2.8 | 3 | 2.4 | 2.3 | 2.1 | 2.1 | 1.8 | 1.7 | 1.6 | 24.9 | 2.08 |
| 日照时数/h | 201 | 201.3 | 245.9 | 273.3 | 301.6 | 266.6 | 290.5 | 296.7 | 309.8 | 275.7 | 199.3 | 195.3 | 3057 | 254.75 |
3.3.2 社会经济发展因素
人口增加、经济发展、能源耗损、技术进步、城镇管理和建设用地扩张等城镇化进程对生态环境具有一定的胁迫或促进作用[30]。据2018年年末博湖县统计局数据,国有建设用地供结总量比2017年增长40%,达到35.54 hm2。
图7
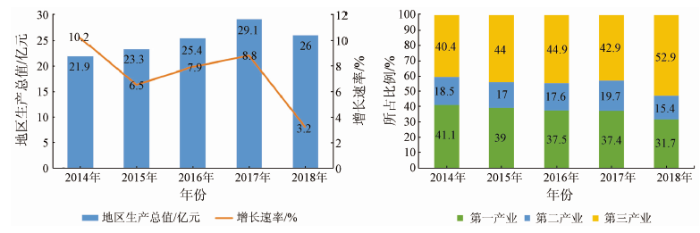
图7
2014—2018年博湖县社会经济发展情况
Fig.7
Social and economic development of Bohu from 2014 to 2018
4 结论
本研究结合天宫二号宽波段成像仪和Landsat8数据构建遥感生态指数模型,证明天宫二号宽波段成像仪数据也可作为可靠数据源,弥补基于单一数据源构建遥感生态指数模型的局限性。虽然有不少学者将遥感生态指数模型RSEI运用于区域生态环境监测,但运用于干旱区的研究较少,因此本文初步尝试将基于天宫二号宽波段成像仪数据及Landsat8数据共建的遥感生态指数模型运用于我国西部干旱绿洲城镇博湖县,并对其2018年生态环境现状进行定量监测与评价。
在该研究中,湿度(WET)、绿度(NDVI)在整个评价指标中为正向指标,而干度(NDBI)、热度(LST)为负向指标,对生态环境发展有一定影响。总体来说,2018年博湖县遥感生态指数存在较强的空间正相关性,其内在存在一定联系,且空间分布呈现集群特征,并非随机分布。生态环境较差地区主要分布在北部城镇用地、南部的大量沙地及未利用地,其驱动力因素主要有城镇化建设及自然因素等。对选取的样点进行回归分析,建立适用于评价和预测生态环境质量的模型。结果表明,本文所选取的4项指标均可作为评价区域生态环境质量的有效指标。
由于天宫二号于2016年发射,基于本研究所获取的数据量有限,因此仅采用2018年天宫二号宽波段成像仪可见近红外谱段和宽波段成像仪短波红外谱段对研究区现状进行监测评价,缺少了时空角度监测研究区生态环境的变化,在后期研究中可考虑利用多源遥感弥补时空上的缺失; 并利用天宫二号宽波段成像仪热红外谱段反演地表温度,且可将土壤盐分[22]等适用于干旱区的指数综合运用于构建一个完全基于天宫二号宽波段成像仪的遥感生态指数,对区域生态环境进行监测与评价。
志谢:
感谢载人航天工程提供天宫二号宽波段成像仪数据产品,在此表示衷心的感谢!
参考文献
Identifification and quantifification of the hydrological impacts of imperviousness in urban catchments:A review
[J].
Measuring urban environmental sustainability performance in China:A multi-scale comparison among different cities, urban clusters,and geographic regions
[J].
区域生态环境变化的遥感评价指数
[J].
A remote sensing index for assessment of regional ecological changes
[J].
基于主成分分析的生态变化遥感监测——以宝鸡市城区为例
[J].
Dynamic monitoring of eco-environment quality changes based on PCA:A case study of urban area of Baoji City
[J].
基于多源遥感数据的土地整治生态环境质量动态监测
[J].
Dynamical monitoring of ecological environment quality of land consolidation based on multi-source remote sensing data
[J].
永定客家土楼世界遗产地土地覆盖与生态变化遥感评价
[J].
Evaluation of land cover and ecological change of Yongding Hakka Tulou World Heritage Protection Area using remote sensing image
[J].
基于遥感指数的生态变化评估——以常宁市为例
[J].
DOI:10.6046/gtzyyg.2014.04.23
URL
[本文引用: 1]

利用遥感技术进行区域生态变化评估,能够得到周期长、现时性强的结果。以常宁市为例,采用遥感生态指数方法来监测水土流失区的生态变化,选取1990年,2002年及2009年的Landsat TM 遥感图像,分别提取绿度、湿度、热度和干度4个生态因子作为评估指标,结合主成分分析方法,定量、客观地评估研究区域20 a间生态变化。结果表明,遥感生态指数方法能够很好地评价水土流失区生态修复的效果,其中,遥感生态指数值上升了22.39%,生态为优良等级所占的面积比例先从1990年的13.086%下降到2002年的4.006%,再上升到了2009年16.699%,说明常宁市经过20 a的水土流失治理,该区域的生态质量先急剧下降再有了较大的改善。通过对常宁市调查分析,以植树造林和施工预防为主的措施对生态质量的改善有较好的效果。
Ecological changes assessment based on remote sensing indices:A case study of Changning City
[J].
Research on on-board calibration system of Tiangong-2 wide-band imaging spectrometer
[C]//
天宫二号数据地表温度反演及其在城市群热环境监测中的应用
[J].
Inversion of land surface temperature and its application in urban agglomeration thermal environment monitoring based on Tiangong-2 data
[J].
天宫二号对地观测数据在生态评价中的应用研究
[J].
Application of earth observation data of Tiangong2 in ecological assessment
[J].
Land use change monitoring in Angkor wat based on Tiangong-2 wide band imaging data
[C]//
Drought monitoring using Tiangong-2 wide-band spectrometer data
[C]//
Temporal and spatial changes of the Yellow River delta wetland based on multi-source data during 30 years
[C]//
博湖县主要农业气象灾害及防灾减灾服务对策
[J].
Main agro-meteorological disasters in Bohu County and the disaster prevention and reduction coun-termeasures
[J].
基于多时相遥感影像的围填海动态监测与变化分析——以辽宁省部分沿海县市为例
[J].
Monitoring and analysing of reclamation change based on multi-data remote sensing images:A case study of partial area of Liaoning Province
[J].
基于天宫二号多光谱数据的青藏高原冻湖自动提取
[J].
Automatic extraction of Tibet Plateau frozen lake based on Tiangong-2 multi-spectral data
[J].
Prediction of ecological effects of potential population and impervious surface increases using a remote sensing based ecological index (RSEI)
[J].
Sensitivity of global terrestrial ecosystems to climate variability
[J].
Downscaling of Tiangong-2 land surface temperature
[C]//
Determining the area of influence of depression cone in the vicinity of lignite mine by means of triangle method and Landsat TM/ETM+ satellite images
[J].
DOI:10.1016/j.jenvman.2015.11.010
URL
PMID:26610610
[本文引用: 1]
Problems with lowering of water table are common all over the world. Intensive pumping of water from aquifers for consumption, irrigation, industrial or mining purposes often causes groundwater depletion and results in the formation of cone of depression. This can severely decrease water pressure, even over vast areas, and can create severe problems such as degradation of agriculture or natural environment sometimes depriving people and animals of water supply. In this paper, the authors present a method for determining the area of influence of a groundwater depression cone resulting from prolonged drainage, by means of satellite images in optical, near infrared and thermal infrared bands from TM sensor (Thematic Mapper) and ETM+ sensor (Enhanced Thematic Mapper +) placed on Landsat 5 and Landsat 7 satellites. The research area was Szczercowska Valley (Pol. Kotlina Szczercowska), Central Poland, located within a range of influence of a groundwater drainage system of the lignite coal mine in Belchatow. It is the biggest lignite coal mine in Poland and one of the largest in Europe exerting an enormous impact on the environment. The main method of satellite data analysis for determining soil moisture, was the so-called triangle method. This method, based on TVDI (Temperature Vegetation Dryness Index) was supported by additional spatial analysis including ordinary kriging used in order to combine fragmentary information obtained from areas covered by meadows. The results obtained are encouraging and confirm the usefulness of the triangle method not only for soil moisture determination but also for assessment of the temporal and spatial changes in the area influenced by the groundwater depression cone. The range of impact of the groundwater depression cone determined by means of above-described remote sensing analysis shows good agreement with that determined by ground measurements. The developed satellite method is much faster and cheaper than in-situ measurements, and allows for systematic monitoring of the vast area in the vicinity of Belchatow lignite mine. Besides, this method could be useful as a helper in in-situ measurement allowing a significant reduction of the number of in-situ measurements by performing them only within problematic areas. Hence, the triangle method can be used as an effective supplement to field measurements. Although the research area is located in Poland, in the vicinity of lignite mine, the method of observation of depression cones provided in this study is universal and effective, and therefore could also be useful to an international audience.
Spatiotemporal evolution of environment based on integrated remote sensing indexes in arid inland river basin in Northwest China
[J].
DOI:10.1007/s11356-019-04741-x
URL
PMID:30891703
[本文引用: 2]
Arid inland river basin has been regarded as environmental vulnerable and an important protective area in northwest China. Shiyang River Basin (SRB) is one of the most typical areas in arid inland rivers basin in China. The environmental quality evaluation of different periods is significant for environmental control and management of SRB. In this paper, the normalized differential vegetation index (NDVI), wetness index (WI), albedo, index-based built-up index (IBI), salinization index (SI), and land surface temperature (LST) were obtained through Landsat TM and OLI images in 1995, 2000, 2005, 2010, and 2016. Besides, three methods including spatial principal component analysis (SPCA), analytic hierarchy process (AHP), and remote-sensing spatial distance model (RSSDM) were compared to select a reasonable method for environmental evaluation. The AHP method was determined as the final method for objectively evaluating spatiotemporal changes of environment from 1995 to 2016 in SRB. The results showed that the environment deteriorated in 1995-2000 and improved in 2000-2016. The effect of environmental governance was significant in 2010-2016 because of the longtime environmental management between multiple departments. The results indicated that the environmental quality of SRB was generally improved from 1995 to 2016. We found that the improvement areas were mainly concentrated in the oasis and marginal areas, while environmental damage areas were mainly distributed in the urban regions. However, in most areas of the SRB, the environment was still below average level of China, and the roads of the environment management still had a long way to go. We found that spatiotemporal pattern analysis of the environment was of great importance for the formulation of plans for development of this basin and environmental protection measures.
Effects of landscape composition and pattern on land surface temperature:An urban heat island study in the megacities of Southeast Asia
[J].
水土流失区生态变化的遥感评估
[J].
Assessment of ecological change in soil loss area using remote sensing technology
[J].
城市遥感生态指数的创建及其应用
[J].
A remote sensing urban ecological index and its application
[J].
空间自相关局部指标在城市热岛界定中的应用
[J].
Application of local spatial autocorrelation indices to the delimitation of urban heat island
[J].
甘肃白龙江流域景观生态风险评价及其时空分异
[J].以我国典型生态环境过渡带——甘肃白龙江流域为对象,借助GIS技术和Fragstats软件,基于土地利用变化的生境脆弱度和景观生态损失度构建了流域景观生态综合生态风险评价模型,并利用空间自相关分析方法,开展了土地利用变化及其生态风险评价与时空分异研究.结果表明:1990~2010年白龙江流域土地利用变化明显,林地和建设用地呈现增长趋势,耕地和草地面积呈现减少,未利用地和水域则呈波动变化.研究区景观生态风险空间分布差异明显,白龙江流域西北部和北部的生态风险高于流域的西部、东部和南部.同时,各风险等级上呈现“两头小中间大”的趋势,即中等风险区面积呈扩张的态势,低风险区和高风险区呈减弱的趋势.流域景观生态风险具有显著的空间集聚特征,其生态风险值呈现显著的空间正相关关系,这可能是流域生态风险时空分布与土地利用强度、土地利用结构及人类活动之间关系密切.
Landscape ecological risk assessment and its spatio temporal variation of the Bailongjiang watershed,Gansu
[J].
新疆博乐市生态环境变化对城市建设用地扩张的响应
[J].
Response of ecological environment change to urban construction land expansion in Bole City of Xinjiang
[J].
新疆精河县生态变化评价及驱动力研究
[J].
Study on evaluation and driving forces of ecological changes in Jinghe County,Xinjiang
[J].
城市群扩展的时空演化特征及对生态环境的影响——以天山北坡城市群为例
[J].
Spatiotemporal characteristics of the expansion of an urban agglomeration and its effect on the eco-environment:Case study on the northern slope of the Tianshan Mountains
[J].
