

0 引言
目前,针对农耕区土地利用分类一直是遥感领域的研究热点。在以往的研究中,由于中高分辨率数据对植被具有较高的识别精度,继而被广泛用于分类研究。例如,林楠等[3]利用单时相资源一号02C遥感数据,结合最小二乘支持向量机(support vector machine, SVM)分类法,快速提取了农耕区土地信息; 王月如等[4]以Landsat8 OLI为数据源,采用一种新的网体水体差异增强指数,获得研究区内的富贵竹信息。但由于时间分辨率较低和气候因素的影响,很难获取植被关键时期的影像和构建时序数据集。为了解决时间分辨率低的问题,有学者便利用高时间分辨率数据进行土地利用分类研究。例如,Wardlow等[5]结合MODIS数据,创建归一化植被指数(normalized difference vegetation index, NDVI)时间序列对农业区典型地物信息进行提取; Vintrou等[6]采用MOD13Q1时间序列数据对马里南部农耕区进行分类研究; 朱永森等[7]以HJ-1A/B为数据源,创建NDVI和PC1时序数据,提取长株潭城市群的土地利用信息。以上虽然解决了时间分辨率较低的问题,但是空间分辨率的限制使得在随季节更替地物类型变化明显的农耕地区地物分类精度较低。为了具有高时空分辨率的特点,有学者采用多源遥感数据融合的方法。例如,张猛等[8]利用MODIS数据和Landsat数据,提取了洞庭湖区水稻的种植面积; 郝鹏宇等[9]同样结合MODIS和Landsat数据,进而提取作物面积。上述融合方法虽然具备了高时空分辨率的特点,提高了分类精度,但是不同数据源的归一化问题依然很难解决。
随着各国大力发展遥感事业,中高分辨率的卫星数据突破了重访周期较长的困境,这为农耕地区土地利用分类提供了更多的数据源。欧洲航天局分别在2015年6月和2016年7月发射了Sentinel-2A/B 2颗卫星,每颗卫星都具有13个光谱波段,其空间分辨率最高可达10 m,2颗卫星协同工作可使重访周期缩短至5 d,这便可利用同一数据源构建高时空分辨率时序数据,对于土地利用分类研究具有重要意义[10,11,12]。而目前如何充分利用高时空分辨率的Sentinel-2A/B数据实现农耕地区的土地利用分类研究还很少。鉴于此,本研究选取吉林省大安市舍力镇农耕区为研究区,充分利用Sentinel-2A/B具有高时空分辨率的优势,分别构建NDVI指数和缨帽-湿度分量(tasseled cap wetness,TCW)时序数据,并结合随机森林(random forest, RF)、SVM和最大似然分类(maximum likelihood classification, MLC)3种分类算法识别农耕区不同地物类型,为农耕地区的土地覆被信息提取提供有效的技术方法和途径[13,14,15]。
1 研究区概况及数据源
1.1 研究区概况
研究区选取吉林省西北部大安市舍力镇农耕区,地处松嫩平原腹地,坐标范围N45°32'28.17″~45°36'15.20″,E123°20'7.23″~123°27'1.47″,如图1所示。该区为中温带季风气候,四季分明,年平均气温为4.3 ℃,年平均降雨量为413.7 mm。研究区内主要土地利用类型包括林地、草地、旱田(玉米)、水体、建设用地、盐碱地及裸地。
图1
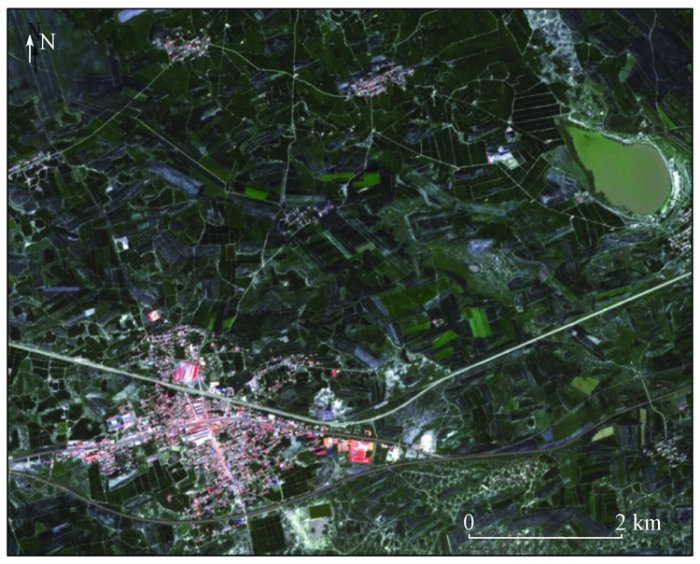
图1
研究区Sentinel-2A B4(R),B3(G),B2(B)波段合成影像
Fig.1
Image of Sentinel-2A B4(R), B3(G), B2(B) bands in the study area
1.2 数据源及其预处理
本研究选取Sentinel-2A/B影像共计12景,时相分别为2017年3—12月10景和2018年1—2月2景,时间跨度满1 a。影像数据为Level-1C级别,质量较好,清晰无云,无条带噪声且覆盖整个研究区,均由欧洲航天局官网下载。获取到的12景影像数据如表1所示。
表1 Sentinel-2A/B影像数据列表
Tab.1
| 编号 | 卫星传感器 | 获取日期 | 数据级别 |
|---|---|---|---|
| 1 | Sentinel-2B | 2018-01-12 | Level-1C |
| 2 | Sentinel-2B | 2018-02-18 | Level-1C |
| 3 | Sentinel-2A | 2017-03-13 | Level-1C |
| 4 | Sentinel-2A | 2017-04-02 | Level-1C |
| 5 | Sentinel-2A | 2017-05-12 | Level-1C |
| 6 | Sentinel-2A | 2017-06-28 | Level-1C |
| 7 | Sentinel-2B | 2017-07-16 | Level-1C |
| 8 | Sentinel-2B | 2017-08-22 | Level-1C |
| 9 | Sentinel-2A | 2017-09-09 | Level-1C |
| 10 | Sentinel-2A | 2017-10-19 | Level-1C |
| 11 | Sentinel-2B | 2017-11-20 | Level-1C |
| 12 | Sentinel-2B | 2017-12-20 | Level-1C |
下载到的Sentinel-2A/B原始影像数据为Level-1C级别,已经过系统几何精纠正处理,并且均方根误差(root mean square error,RMSE)控制在1个像元内,所以只需要对其进行大气校正,进而得到Level-2A级别数据产品。根据欧洲航天局发布的独立式遥感影像处理模块Sen2Cor(Sentinel-2 Sen2Cor processor),对遥感影像进行大气校正。最后,利用研究区矢量边界裁剪影像数据。
根据研究区内部各种地类的分布情况,均匀选取各地类样本。以基于GF-1影像的2016年大安市自然资源调查成果数据和Google Earth高分辨率遥感影像数据作为本次研究的地面验证数据。
2 研究方法
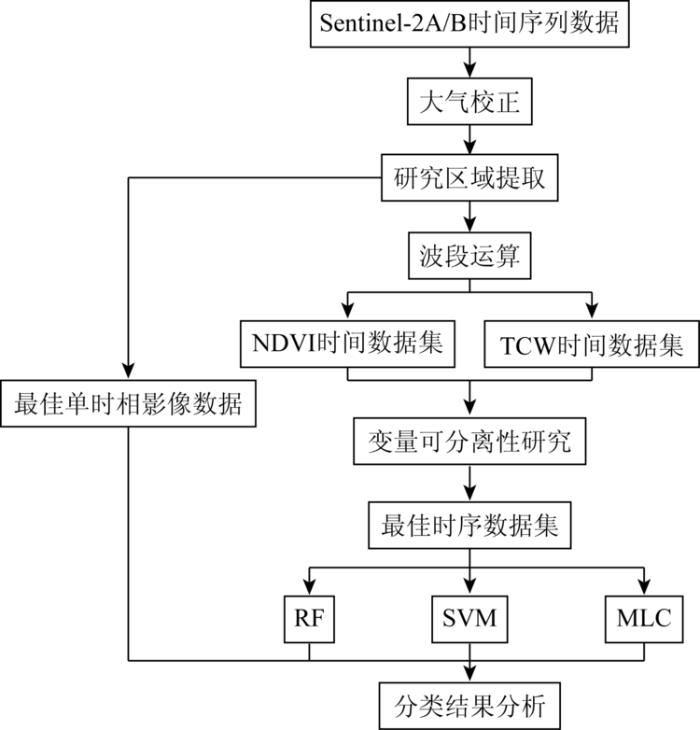
本研究利用多时相Sentinel-2A/B影像数据,首先构建NDVI和TCW时序数据集,通过分析NDVI和TCW时间序列曲线寻找不同地物之间的差异特征,再计算J-M距离(Jeffries-Matusita)分析典型地物类型之间的可分离性; 其次,确定研究区内部用于土地利用类型分类的最佳时序数据组合,分别采用RF,SVM和MLC 3种分类器对其进行分类研究; 最后,对比分析3种分类结果以及利用单一时相分类结果的精度,研究过程如图2所示。
图2
2.1 NDVI时序数据集的构建
NDVI是红光波段和近红外波段的数学计算,能够有效区分绿色植被信息和土壤背景信息,目前是应用最为广泛的指数之一。NDVI数值位于[-1,1]之间,正值代表有植被覆盖,并随着植被覆盖度增加而增加[16]。NDVI时间序列曲线可以表达植被的物候信息。因此,本研究利用ENVI5.3软件对Sentinel-2A/B的近红外和红光波段进行波段运算,即
式中
图3
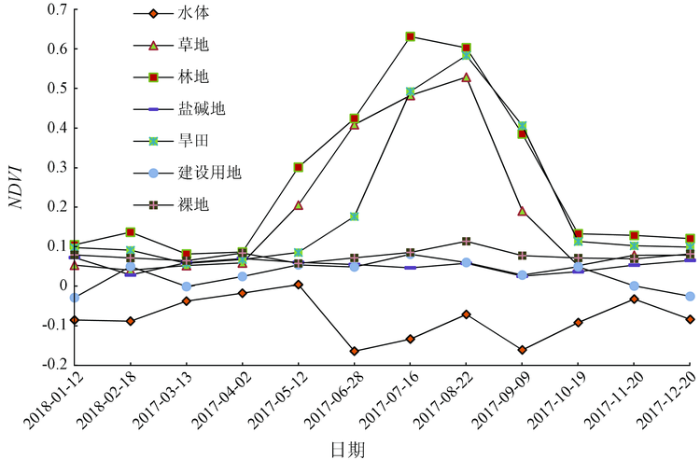
通过典型地物的NDVI时间序列曲线可以发现: 林地的NDVI值从5月逐渐上升,7月达到峰值,并且NDVI值高于其他地物,这主要是因为林地在5—7月正处于旺盛生长阶段,植被生长较快,冠幅大,易于遮盖其他植被; 草地各期的NDVI值略低于林地,但整体趋势与林地保持一致,5月NDVI值逐渐上升,并在8月达到峰值; 根据我国东北地区主要农作物的物候特征,旱田等作物主要集中在4—5月开始播种,6月出苗,此时NDVI值略有增加,但是整体NDVI值低于草地,7—9月为快速生长期,NDVI值持续增加,超过草地NDVI值,并在8月份达到峰值,10月份完成收割,其NDVI值急剧下降; 此外,水体的NDVI值均小于0,而其他地物类型的NDVI值均大于0,可见水体的差异性特征显著; 建设用地、裸地和盐碱地3类地物的NDVI值变化不明显,曲线形状特征相似,利用NDVI时间序列区分该3类地物存在困难。因此,根据林地、草地、旱田和水体NDVI值的变化情况,构建的NDVI时间序列数据集可以作为区分林地、草地、旱田和水体的有效分类特征,而想要区分出建设用地、裸地和盐碱地,必须对Sentinel-2A/B时序数据集进一步处理。
2.2 TCW时序数据集的构建
式中
图4
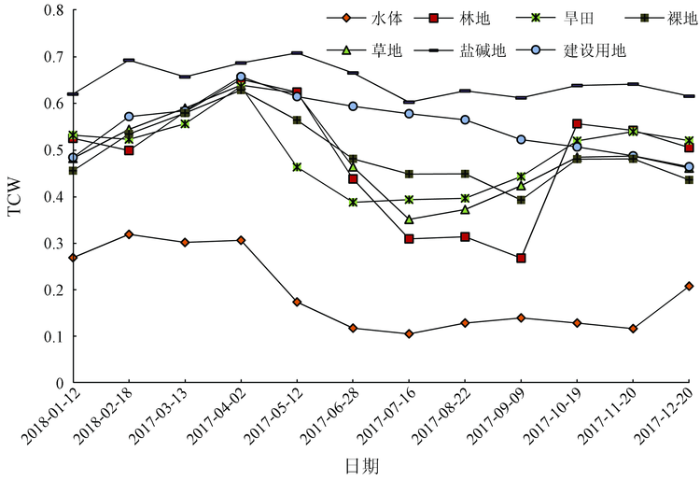
从构建的典型地物TCW时间序列曲线可以发现: 各类型地物的曲线形态和反射率值都有明显的差异,并且随着地物含水量的增加TCW值越低; 盐碱地的TCW值高于其他地物类型,这主要是因为盐碱地土壤蓄水能力差,含水量较低; 建设用地1—4月随着积雪融化,TCW值逐渐升高,在4月达到峰值,5—10月陆续出现降雨,TCW值又逐渐降低,介于盐碱地和其他地类之间; 裸地具有较好的储水能力,在6—8月期间因为降雨作用,其TCW值低于建设用地,但高于林地、草地和旱田,可见利用TCW可以有效地区分裸地和植被。因此,在NDVI时序数据集中较难区分的建设用地、裸地和盐碱地,在TCW时序数据集中却较容易区分。
2.3 地物可分离性分析及选择最佳时序数据组合
本文利用J-M距离方法,进行地物可分离性分析。J-M距离是基于条件概率理论的光谱可分性指标,通过计算某一特征2类样本间的距离,衡量2类样本间的可分离度,因此被认为是可分离性的最佳判定指标[19]。基于某一特征2类样本间J-M距离的计算公式为:
式中: B为基于某一特征2种地类的距离;
表2 Sentinel-2A/B不同时间序列数据组合的6种典型地物间的J-M距离
Tab.2
| Sentinel-2A/B数据组合方式 | 旱地-林地 | 旱地-草地 | 旱地-盐碱地 | 盐碱地-建设用地 | 建设用地-裸地 |
|---|---|---|---|---|---|
| 6 7 8 | 1.997 8 | 1.882 7 | 1.999 9 | 1.552 7 | 1.861 4 |
| 5 6 7 8 | 1.999 9 | 1.964 1 | 1.999 9 | 1.761 5 | 1.971 6 |
| 4 5 6 7 8 | 1.999 9 | 1.989 9 | 1.999 9 | 1.883 4 | 1.992 1 |
| 4 5 6 7 8 9 | 1.999 9 | 1.998 6 | 1.999 9 | 1.966 7 | 1.997 0 |
| 4 5 6 7 8 9 10 | 2.000 0 | 1.999 1 | 1.999 9 | 1.994 3 | 1.999 0 |
| 3 4 5 6 7 8 9 10 | 2.000 0 | 1.999 5 | 2.000 0 | 1.999 7 | 1.999 8 |
| 2 3 4 5 6 7 8 9 10 | 2.000 0 | 1.999 7 | 2.000 0 | 1.999 9 | 1.999 9 |
| 1 2 3 4 5 6 7 8 9 10 11 | 2.000 0 | 1.999 9 | 2.000 0 | 1.999 9 | 1.999 9 |
| 1 2 3 4 5 6 7 8 9 10 11 12 | 2.000 0 | 1.999 9 | 2.000 0 | 1.999 9 | 1.999 9 |
注: Sentinel-2A/B数据组合包括每月的NDVI和TCW,Sentinel-2A/B数据组合方式为不同月份组合。
本文以2016年大安市自然资源调查成果数据和Google Earth高分辨率遥感影像数据作为后期验证数据。根据典型地物的生长周期规律和物候特征,首先选择NDVI和TCW特征明显的月份进行组合,再逐次增加不同月份数据,分别计算不同月份数据组合下的J-M距离,如表2所示。通过表2可知: 典型地物之间的可分离程度随着不同时相数据组合会存在很大差异; 9种不同的组合方式均能很好地区分旱地、林地和盐碱地; 当利用3个时相数据时,旱地与草地、盐碱地与建设用地和建设用地与裸地区分效果不佳,J-M距离均未超过1.9; 随着不同时相数据个数的增加,可分性效果越来越好,尤其是盐碱地与建设用地的可分性明显增加; 当不同时相数据个数为7及以上时,典型地物之间的可分性不再随着不同时相个数的增加而增大,如图5所示。因此,根据典型地物的NDVI和TCW时间序列曲线特征,选取4—10月7个时相的NDVI和TCW共计14个波段作为此次农耕区土地利用分类研究的最佳时序组合数据。
图5
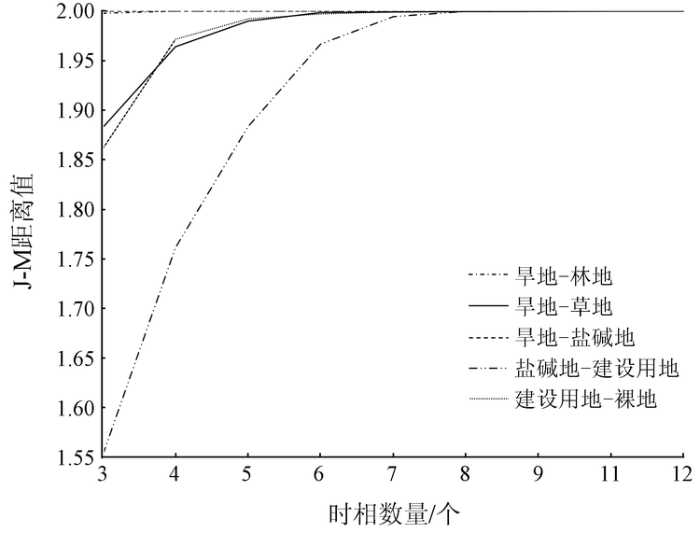
图5
不同时相数据个数的典型地物之间J-M距离变化曲线
Fig.5
J-M distance variation curve of typical features with different time phase data
2.4 基于RF的遥感分类与精度评价
在高维特征影像数据中,为了提高地物的分类精度,选择合适的分类器极为重要。2001年Breiman[21]提出了RF算法,该算法是由多个CART决策树组合而成,可以有效地解决因单一决策树造成的过拟合和欠拟合问题。RF分类器中任意2棵决策树都是相互独立的,当有新的测试样本输入时,每棵决策树都会对其进行分类,最后采用投票法得出分类结果[22]。RF分类器需要调节的参数分别是树的个数N和随机选择特征变量的个数m,设置合适的参数,可有效提高分类精度[23,24]。通过将多组参数进行分类对比分析,确定生成决策树的个数为50,随机选择特征变量个数为4时,RF分类器的分类效果最佳。结合挑选出的4—10月7个时相的14个特征变量,对研究区内部林地、草地、旱田、水体、建设用地、盐碱地以及裸地进行信息提取。
为了与RF分类器进行对比分析,再选取SVM和MLC 2种分类器结合相同的时序数据,分别对影像进行分类。最后通过混淆矩阵获取的总体精度、Kappa系数、生产者精度和用户精度对3种分类器的分类结果进行定量评价。
3 结果与分析
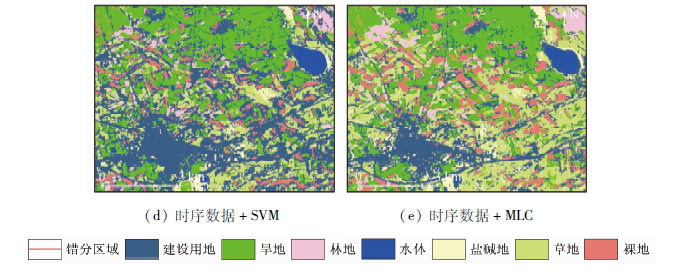
3.1 典型地物分类结果
图6-1
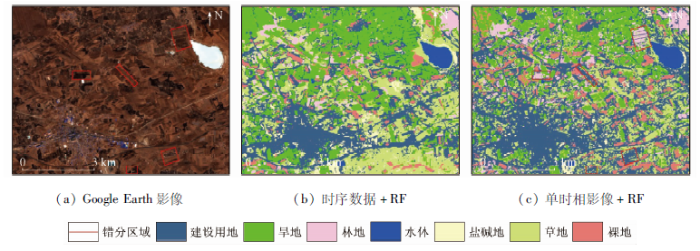
图6-2
3.2 分类精度评价与分析
结合基于GF-1影像的2016年大安市自然资源调查成果数据和Google Earth高分辨率遥感影像数据,在研究区内部随机选择500个地面验证点,均匀分布在整个研究区范围内,其中水体7个、草地94个、林地18个、盐碱地4个、旱地232个、建设用地102、裸地43个,并应用混淆矩阵方法对不同分类结果进行精度评价,其分类精度指标如表3所示。
表3 分类精度指标对比
Tab.3
| 类别 | 时序数据+RF | 时序数据+SVM | 时序数据+MLC | 单时相数据+RF | ||||
|---|---|---|---|---|---|---|---|---|
| 生产者精度/% | 用户精度/% | 生产者精度/% | 用户精度/% | 生产者精度/% | 用户精度/% | 生产者精度/% | 用户精度/% | |
| 水体 | 85.66 | 89.49 | 87.52 | 83.46 | 82.21 | 83.60 | 88.91 | 78.00 |
| 草地 | 96.89 | 82.64 | 93.72 | 88.91 | 76.26 | 72.25 | 73.91 | 73.12 |
| 林地 | 90.21 | 93.79 | 89.83 | 91.02 | 83.53 | 88.96 | 62.27 | 67.06 |
| 盐碱地 | 91.08 | 90.08 | 92.41 | 87.69 | 90.32 | 85.98 | 83.33 | 99.87 |
| 旱地 | 96.01 | 91.77 | 95.87 | 89.09 | 82.67 | 87.89 | 74.07 | 79.20 |
| 建设用地 | 86.75 | 86.86 | 84.45 | 87.42 | 84.38 | 82.66 | 81.95 | 69.26 |
| 裸地 | 89.63 | 90.48 | 86.91 | 85.04 | 83.56 | 87.88 | 82.94 | 85.10 |
| Kappa系数 | 0.855 7 | 0.802 3 | 0.783 2 | 0.646 4 | ||||
| 总体精度/% | 88.87 | 87.51 | 84.26 | 78.82 | ||||
从表3中可以看出,基于单时相数据分类的总体精度为78.82%,Kappa系数为0.646 4,而利用时序数据结合3种不同的分类方法获得的分类结果均优于基于单时相的分类结果,其中利用时序数据结合RF分类法的分类效果最佳,总体分类精度达到88.87%,Kappa系数达到0.855 7。将时序数据结合RF分类法与单时相数据结合RF分类法的分类结果进行对比分析,发现除水体外各地物类型的生产者精度均有所提高,其中草地、林地和旱地的生产者精度提高幅度最大,分别提高了22.98,27.94和21.94百分点,而盐碱地、建设用地和裸地的生产者精度提高幅度较小,这充分说明时序数据能更好地区分具有物候规律的地物,能够客观真实地反映各地物类型之间的差异。此外,RF分类法与SVM分类法和MLC分类法相比,RF分类法的结果总体精度最高,并且具有分类速度快,处理时间短,能够有效地处理高维度数据等优点。以上结果说明,基于时序数据结合RF分类法在农耕地区能够有效地区分典型地物,其分类结果精度较高,在农耕地区具有很好的适用性。
4 结论
1)Sentinel-2A/B影像数据具有3个波宽很窄的“红边”波段,这在农耕区土地利用信息提取过程中具有优越性,尤其对具有物候特征的草地、林地和旱地地物类型更为敏感,因此本研究挑选最佳NDVI和TCW组合的时序数据,可有效提取出农耕区土地覆被信息。
2)本研究选取最佳的Sentinel-2A/B时间序列组合数据,分别采用RF分类法、SVM分类法和MLC分类法,以及利用单时相影像数据分别对大安市舍力镇农耕区土地覆被信息进行提取,发现基于时间序列数据结合RF分类法取得了较高的分类精度和准确度,其总体分类精度达到88.87%,Kappa系数达到0.855 7。
3)将时序数据结合RF分类法与单时相数据结合RF分类法对比分析发现,利用时序数据结合RF分类法分类结果的总体精度和Kappa系数较后者分别提高了10.05百分点和0.209 3,其中草地、林地和旱地的生产者精度提高幅度最大,分别为22.98,27.94和21.94百分点,这充分说明时序数据能更好地区分具有物候规律的地物,能够客观真实地反映各地物类型之间的差异。
参考文献
西北旱区遥感影像分类的支持向量机法
[J].
The support vector machine method for RS images’ classification in northwest arid area
[J].
基于随机森林算法的农耕区土地利用分类研究
[J].
Classification of land use in farming area based on random forest algorithm
[J].
基于资源一号02C高分辨率数据的农业区土地利用分类
[J].
Classifications of agricultural land use based on high-spatial ZY1-02C remote sensing images
[J].
基于Landsat8 OLI数据的富贵竹种植区域信息提取
[J].
Information extraction of Dracaena sanderiana planting area based on Landsat8 OLI data
[J].
Large-area crop mapping using time-series MODIS 250 m NDVI data:An assessment for the U.S.Central Great Plains
[J].
Crop area mapping in West Africa using landscape stratification of MODIS time series and comparison with existing global land products
[J].
基于HJ卫星数据与面向对象分类的土地利用/覆盖信息提取
[J].
Extract of land use/cover information based on HJ satellites data and object-oriented classification
[J].
基于多时相Landsat数据融合的洞庭湖区水稻面积提取
[J].
Mapping paddy fields of Dongting Lake area by fusing Landsat and MODIS data
[J].
基于历史时序植被指数库的多源数据作物面积自动提取方法
[J].针对目前作物提取工作中难以综合应用多源遥感数据进行自动分类的现状,该文以新疆博乐市为试验区,使用多年MODIS数据建立各类作物历史参考时序植被指数曲线库。对TM和环境星数据共同构成的当年时序数据通过植被指数转换、曲线相似性比较,并结合区分不同作物的关键时相,在长时期种植制度变化不大的区域,自动提取作物种植面积。结果表明:该方法使用多源(环境星+TM)中高分辨率遥感数据构建的时序植被指数提取作物的总体精度可达到90%以上;与传统的监督分类方法相比,省去了人工采集训练区的步骤,实现了作物种植面积的自动提取。
Multi-source automatic crop pattern mapping based on historical vegetation index profiles
[J].Multi-temporal vegetation index (VI) reflects phonological calendar feature, which is one of the most distinguishing features between different crops. It has been widely used in detecting the dynamics of vegetation characteristics over time and land cover classification. However, medium to high spatial resolution time series VI data (spatial resolution > 30m) has not been utilized because single sensor cannot provide the images of all time phrases. In addition, the comprehensive utilization of multi-source images is limited as the difference between sensors. The objective of this research was to evaluate the applicability of crop mapping using multi-source medium resolution time series VI data (TM + HJ-1) based on reference historical time series VI profiles in Bole County. Since all of MODIS, TM and HJ-1 have red band and NIR band, three VIs: NDVI, EVI2 and WRDVI calculated from these two bands were employed in this paper. Then, MODIS and field-plot data were utilized to build annual time series VI profiles of different crops between 2006 and 2010, and the historical references profiles by iteratively calculating the weighted average of annual VI profiles were got. Therefore, to reduce VI difference among TM, HJ-1 and MODIS, TM/HJ-1 VI to MODIS VI using linear regression method, and got medium spatial resolution time series VI data composed of TM and HJ-1 in 2011. To extract crop patterns were translated, historical reference profiles were interpolated by time phrases of TM/HJ-1, Euclidean distance between time series VI data and reference profiles was computed and threshold of crop mapping using field samples between 2006 and 2010 was calculated. Nevertheless, as reference time series VI profiles of cotton and corn were similar (correlation coefficient > 0.99), the sixth time phrase (DOY=253) where cotton and corn reference profiles had the largest difference was utilized to distinguish cotton and corn. Finally, the crop mapping accuracy was compared with supervised classification, the result showed that crop mapping accuracy based on historical profiles using NDVI, EVI2 and WRDVI were 90.53%, 91.35% and 90.83%, and Kappa coefficient were 0.78, 0.81 and 0.80, which were better than that of supervised classification. It was concluded that crop mapping based on historical reference time series VI profiles omitted choosing training sites procedure, and interfaced the automatic crop mapping. What is more, this paper also offered a new method to comprehensive utilization of multi-source remote sensing data.
哨兵-2A光学成像卫星发射升空
[J].
Sentinel-2A optical imaging satellite launched
[J].
Sentinel-2B卫星发射成功
[J].
Sentinel-2B satellite launched successfully
[J].
基于多时相Sentinel-2A的县域农作物分类
[J].
Fine classification of county crops based on multi-temporal images of Sentinel-2A
[J].
Random forest in remote sensing:A review of applications and future directions
[J].
典型遥感数据分类方法的适用性分析——以遥感图像场景分类为例
[J].
Scalability analysis of typical remote sensing data classification methods:A case of remote sensing image scene
[J].
基于线性光谱混合分解和最大似然分类相结合的土地覆被分类——以红寺堡灌区为例
[J].
Land cover classification based on linear spectral mixture decomposition combined with maximum likelihood classfication:A case study of Hongsipu Irrigation Area
[J].
植被覆盖度遥感估算方法研究进展
[J].
Advances in researches on application of remote sensing method to estimating vegetation coverage
[J].
融合面向对象与缨帽变换的湿地覆被类别遥感提取方法
[J].
Method for wetland type extraction using remote sensing combing obiect-oriented and tasseled cap transformation
[J].
Comparison of two-dimensional multitemporal Sentinel-2 data with three-dimensional remote sensing data sources for forest inventory parameter estimation over a boreal forest
[J].
Object-oriented land cover classification using HJ-1 remote sensing imagery
[J].DOI:10.1007/s11430-010-4133-6 URL [本文引用: 1]
成像光谱数据特征选择及小麦品种识别实验研究
[J].
DOI:10.11834/jrs.20060237
URL
[本文引用: 1]

针对河北栾城获得的MAIS成像光谱仪数据用于小麦品种识别进行了特征选择和分类研究。利用遗传算法以JM距离为准则并结合实验区小麦的生物物理特性,进行了最佳波段选择;利用Fuzzy―Anmap分类器及选出的最佳波段对成像光谱数据进行了分类,区分出了4种小麦品种,小麦的总体分类精度超过97%。
A experimental study on imaging spectrometer data feature selection and wheat type identification
[J].
DOI:10.11834/jrs.20060237
URL
[本文引用: 1]
With the development of imaging spectrometer technology,the ground objects' consecutive information from it makes it possible to identify different vegetation types,though some relevant research was carried out in the past few years,most are about forestry,yet few about crops.Further,there exist strong correlation between bands of imaging spectrometer,so how to reduce as much as possible the redundant information and reserve useful information appear much more important.This paper first did feature selection based on genetic algorithm(GA) and wheat biophysical characteristics.In feature selection using GA,for the training samples,when combined bands reach 4,the JM distance of optimal combination reach much high level,when bands go on increasing,the average JM distance increases slowly until when bands reach 8,the distance does not increase further,so the optimal bands combination can be obtained.In feature selection using wheat biophysical characteristics,we found that there appear strong correlative bands for wheat protein and dry gluten with spectra,so the sensitive bands can be obtained.Combining these two feature selection steps,the ultimate optimal bands combination was given.After feature selection,we use the selected bands and classifier Fuzzy-Artmap to classify the imaging spectrometer data.It showed that for 4 wheat types,they can be identified clearly,the average classification accuracy is above 90%.
Random forests
[J].
DOI:10.1023/A:1010933404324
URL
[本文引用: 1]
Random forests are a combination of tree predictors such that each tree depends on the values of a random vector sampled independently and with the same distribution for all trees in the forest. The generalization error for forests converges a.s. to a limit as the number of trees in the forest becomes large. The generalization error of a forest of tree classifiers depends on the strength of the individual trees in the forest and the correlation between them. Using a random selection of features to split each node yields error rates that compare favorably to Adaboost (Y. Freund & R. Schapire, Machine Learning: Proceedings of the Thirteenth International conference, ***, 148–156), but are more robust with respect to noise. Internal estimates monitor error, strength, and correlation and these are used to show the response to increasing the number of features used in the splitting. Internal estimates are also used to measure variable importance. These ideas are also applicable to regression.]]>
Spectral discrimination of papyrus vegetation (Cyperus papyrus L.) in swamp wetlands using field spectrometry
[J].
基于多目标遗传随机森林特征选择的面向对象湿地分类
[J].
Object-oriented wetland classification based on hybrid feature selection method combining with Relief F,multi-objective genetic algorithm and random forest
[J].
基于Sentinel-2A影像特征优选的随机森林土地覆盖分类
[J].
DOI:10.18402/resci.2019.05.15
URL
[本文引用: 1]
中南半岛地处热带、亚热带地区,由于水热条件适宜,植被生长旺盛,土地利用强度高,地表覆盖类型的光谱特征时空变异复杂,使用传统的基于光谱特征的遥感分类精度难以保证。Sentinel-2A卫星遥感数据具有较丰富的光谱波段和较高的空间分辨率,为土地覆盖遥感分类提供了多维特征空间。但多维特征参与分类容易造成信息冗余,从而导致分类速度和精度降低。因此,如何充分利用Sentinel-2A数据丰富的光谱和空间信息,并通过高维特征空间降维进行特征优选对于提高分类精度具有重要意义。本文以中南半岛典型地区土地覆盖分类为例,利用Sentinel-2A多波段光谱特征,归一化植被指数(NDVI)、比值植被指数(RVI)、差值植被指数(DVI)、归一化水体指数(NDWI)等指数特征以及对比度、相关性、能量、均值、熵等纹理特征,在随机森林模型框架下,采用平均不纯度减少方法对不同特征在土地覆盖分类中的重要程度进行识别;利用袋外(OOB)误差方法,对重要特征组合进行了优选;利用优选特征进行随机森林土地覆盖分类,并与原始随机森林分类结果进行对比。结果表明:Sentinel-2A影像的光谱特征和纹理特征在土地覆盖分类中具有较为重要的作用,光谱特征中短波红外、可见光、植被红边波段重要性较大,纹理特征中均值、能量法重要性较高。选择重要性列前9位的特征参与分类时,OOB精度达到最高;继续增加特征会使模型复杂度过高,容易发生过拟合而使得分类精度不增反降。通过特征优选高效利用了Sentinel-2A丰富的光谱和纹理信息,其总体分类精度达87.53%,Kappa系数达0.8461,优于原始随机森林方法,一定程度上提高了热带亚热带地区复杂土地覆盖分类精度。
Land-cover classification of random forest based on Sentinel-2A image feature optimization
[J].
DOI:10.18402/resci.2019.05.15
URL
[本文引用: 1]
Due to the suitable hydrothermal conditions, vigorous vegetation growth, high land use intensity and complex spatiotemporal variation of spectral characteristics of surface cover types, it is difficult to guarantee the accuracy of remote sensing classification using traditional spectral characteristics in tropical and subtropical regions. Multi-spectral, high spatial resolution Sentinel-2A imageries provide a new source of data for land-cover classification. In order to improve the speed and accuracy of land-cover classification using Sentinel-2A images, we propose a classification method with feature-optimized random forests. In this study, we took the Mun River Basin of Indo-China Peninsula as our research area and made full use of the rich spectral characteristics, normalized vegetation index (NDVI), ratio vegetation index (RVI), difference vegetation index (DVI), normalized water body index (NDWI), and texture features including contrast, correlation, energy, mean, and entropy, of Sentinel-2A images for the analyses. We used the average impurity reduction method in random forests to evaluate the importance of different spectral features, indices, and texture features. Combining the out-of-bag (OOB) error to select features, the results of land-cover classification with feature-optimized random forests were obtained. They show that the spectral features and texture features of Sentinel-2A images play an important role in our classification compared with the original random forest land-cover classification results. The short-wave infrared, visible, and vegetation red-edge bands are of greater importance in spectral features, and the mean and energy are of high importance in texture features.The accuracy of OOB is the highest when the top 9 important features are selected. Sentinel-2A images have good adaptability in tropical and subtropical region land-cover classification. It can effectively improve the accuracy of land-cover classification in tropical and subtropical regions. The accuracy of our classification method reaches 87.53%, and the Kappa coefficient reaches 0.8461, better than the original random forest method. The random forest method based on feature optimization not only has a fast classification speed, but also can guarantee high classification accuracy under the condition that the sample is representative, especially suitable for the land-cover classification of medium and high spatial resolution images of Sentinel-2A.
