

0 引言
目前,部分学者在不同区域关于土壤湿度与气候变化间关系的研究已经取得一些成果。如王晓婷等[6]基于中国东部722个逐月观测数据分析站点尺度上土壤湿度与温度、降水的关系,结果表明土壤湿度与温度普遍呈负反馈关系,与降水存在较好的正反馈关系。以中国西南地区为研究区,邓元红等[7]探究了不同深度土壤湿度与气候要素的时空相关性,发现温度主要对表层土壤湿度有控制作用,但深层土壤湿度的干湿取决于降水多少。此外,我国学者在青藏高原[8,9,10]和黄土高原[11,12]等地区也进行了土壤湿度时空变化方面的大量研究。对于蒙古高原地区,魏宝成等[13]基于AMSR-2微波数据,构建土壤湿度反演模型,并探讨年内植被生长期土壤湿度对气候因子及NDVI的响应,发现不同子气候区的响应程度存在差异。从当前研究现状来看,受蒙古高原特殊地理位置、观测站点稀少等原因影响,缺乏基于长时序的土壤湿度变化及其对气候要素响应的相关认识。
传统获取土壤湿度的方法主要通过野外实测,这种方法获取数据精度高,但采样点少且代表性弱,无法对大范围土壤湿度的变化快速监测。而遥感反演受到植被、土层厚度和土壤粗糙度等影响,限制了土壤湿度的区域尺度研究[14]。数值模式通过数据同化等手段获取长时序、大规模和高精度的土壤湿度数据,使得大尺度的时空变化研究成为可能,但同化结果一定程度上依赖于初始参数的准确性。为解决这一缺陷,GLDAS创建了全球范围的陆面同化系统,且与其他同化产品对比分析表明,GLDAS生成的结果更加准确合理[15]。因此,本文基于1982—2018年GLDAS-Noah模式土壤湿度数据分析蒙古高原土壤湿度时空分布特征及动态变化趋势;基于此探讨其对降水、温度的响应。本研究可为监测区域旱情、加强水土管理和促进农牧业生产合理布局提供科学依据。
1 研究区概况及数据源
1.1 研究区概况
图1

1.2 数据源及其预处理
本文选用全球陆面数据同化系统( global land data assimilation system,GLDAS)的土壤湿度产品数据[17] ,空间和时间分辨率分别为0.25°和3 h。垂直深度分别选取0~10 cm(SM1)和10~40 cm(SM2),单位为kg/m2,将站点数据与GLDAS数据的量纲统一转换为m3/m3。以0~10 cm土壤湿度值为参考,对10~40 cm土壤湿度值乘以1/3做归一化处理[12]。站点资料选用中国农作物生长发育和农田土壤湿度旬值数据集和国际土壤湿度网络 (International Soil Moisture Network,ISMN)提供的37个具有代表性的观测数据。
温度、降水数据采用East Anglia大学气候研究中心(Climatic Research Unit,CRU)集合全球4 000多个站点气象数据构建的一套覆盖面广、分辨率高且观测全面的月平均气象因子数据集,空间上以0.5°网格覆盖全球陆地。考虑到数据空间分辨率的一致性,对气象数据重采样为0.25°。并将四季划分为春季(3—5月),夏季(6—8月),秋季(9—11月)及冬季(12—次年2月)。
2 研究方法
2.1 突变分析
1) Mann-Kendall 方法。该方法常被用于分析气候要素趋势和突变,其优势在于适用范围较宽,人为影响因素较少,定量化程度较高。M-K方法通过构造一组序列来检验土壤湿度样本序列的趋势和突变,即
式中,
定义统计量:
式中:
此时
2)滑动T检验法。利用M-K方法对气候要素长时间序列进行突变检验时,若有多个突变点时,应判断真假突变点,还需经过滑动T检验再次验证,即
其中,S=
方程服从自由度V=
2.2 趋势分析
slope趋势法是基于一元线性回归方法进行逐像元求取土壤湿度的年际变化,即
式中: slope为土壤湿度的年际变化率;
2.3 相关分析
检验土壤湿度与气候要素间的响应关系可以通过计算二者的相关系数实现,即
式中:
3 结果与分析
3.1 数据精度验证
图2
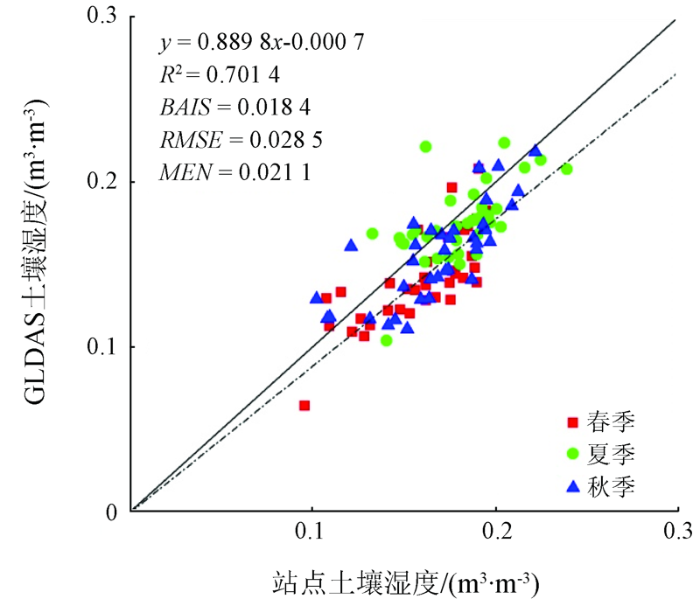
图2
GLDAS土壤湿度数据与观测站点土壤湿度数据精度验证
Fig.2
Accuracy verification of GLDAS soil moisture data and soil moisture data at measured sites
3.2 土壤湿度的时间变化分析
由图3可知,1982—2018年蒙古高原不同深度年均土壤湿度的变化趋势不同,可看出SM1以0.002 m3/m3/10 a的速率呈微弱上升趋势(p>0.05),年均值介于0.142 6~0.164 4 m3/ m3之间。而研究区SM2以-0.005 m3/ m3/10a的速率呈下降趋势(p<0.05),年均值介于0.151 7~0.197 5 m3/ m3之间。说明近37 a高原表层土壤湿度变湿趋势不显著,深层土壤湿度呈显著变干趋势,这种差异是因为表层土壤对短期气候要素响应较快,而深层土壤受长期气候变化的影响较大。
图3
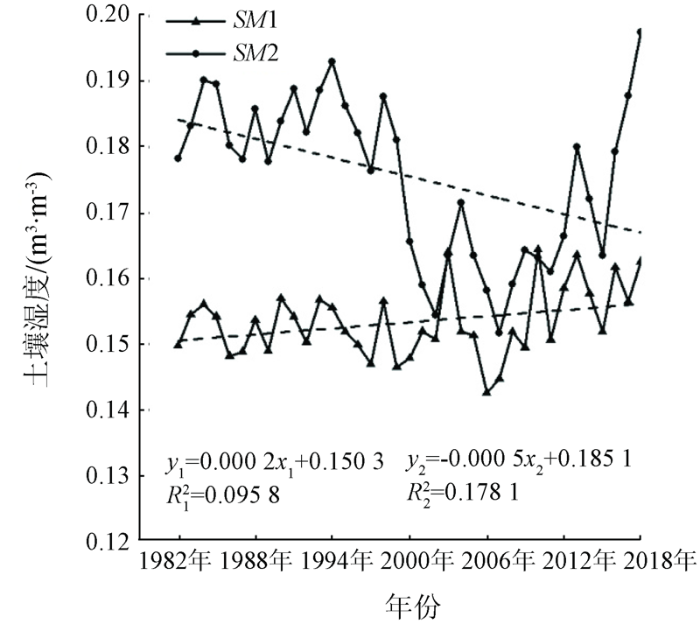
图3
1982—2018年蒙古高原土壤湿度的年际变化
Fig.3
Inter-annual changes in soil moisture in the Mongolian Plateau from 1982 to 2018
采用M-K方法对蒙古高原不同层土壤湿度的年均变化进行趋势分析和突变检验,如图4所示。SM1呈上升的年份有1982—1986年、1990—1992年、1993—1996年、2013—2018年,其余年份呈下降趋势。SM2除1982—1986年、1993—1997年呈上升趋势外其余年份均为下降趋势。2002—2018年期间,
图4
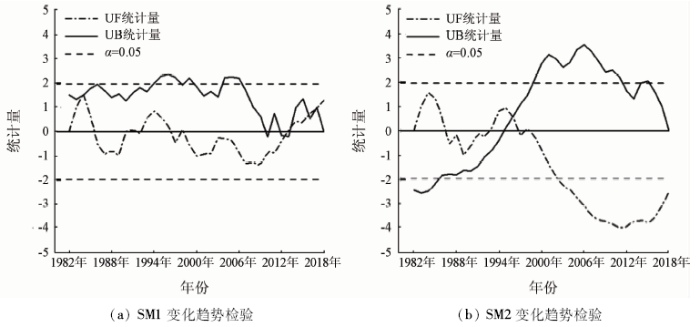
图4
1982—2018蒙古高原年平均土壤湿度变化趋势显著性检验
Fig.4
Significance test of annual mean soil moisture variation trend in the Mongolian plateau from 1982 to 2018
3.3 土壤湿度的空间格局及变化分析
从1982—2018年蒙古高原多年平均土壤湿度的空间分布看出(图5(a)和(b)),土壤湿度总体分布表现为由北向南,由东北向西南逐渐减少的趋势,且呈现出高原外围土壤湿度相对较高,内部相对较低的空间格局。SM1高值区主要分布于蒙古国阿尔泰山、杭爱山以北,萨彦岭东部山间盆地以及肯特山的森林草原地区; 内蒙古东部从大兴安岭森林覆盖区一直向南延伸到科尔沁沙地以及南部的河套平原灌溉区。这些地区土壤湿度介于0.15~0.29 m3/m3。SM1过渡带,蒙古国主要分布于科布多省-后杭爱省-中央省-肯特省-东方省-苏赫巴托尔省北部; 内蒙古主要分布在阿拉善腾格里沙漠绿洲-鄂尔多斯高原-锡林郭勒草原。低值区蒙古国主要分布于戈壁阿尔泰山地-巴彦洪戈尔省-南戈壁省-中戈壁省及东戈壁省的荒漠草原区; 内蒙古分布于西部的巴丹吉林沙漠,最小值出现在阿拉善荒漠区,这些区域的值介于0.05~0.08 m3/m3。SM2与SM1在空间分布表现基本一致,高原中部的典型和荒漠草原区SM2值较低,可能由于这些地区土壤质地与周边区域不同导致的。蒙古高原土壤湿度空间分布格局受到不同土地覆盖类型的影响很大(图1),同时也可能受高原四面环山,海拔因素或下垫面的影响[14]。
图5
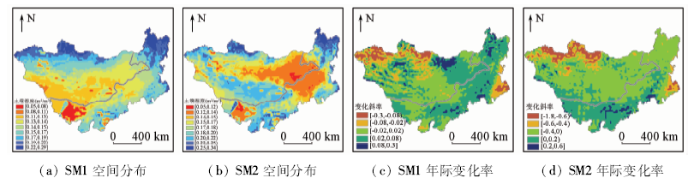
图5
1982—2018蒙古原高多年平均土壤湿度的空间分布及年际变化
Fig.5
Spatial distribution and interannual variation of average soil moisture in Mongolia’s original high during 1982—2018
为深入研究蒙古高原长时序土壤湿度的变化情况,利用趋势分析法计算不同层土壤湿度的年际变化率(图5(c)和(d))。研究区SM1整体呈上升趋势的区域占总面积的71.36%(slope>0),其中显著增加的地区占21.88%(p<0.05),主要分布于阿尔泰山、杭爱山、肯特山、阴山山脉及东部大兴安岭等区域,这些地区共同点是海拔高且有森林或草地覆盖。SM2整体呈下降的趋势(slope<0),减少的区域占69.71%,其中52.39%为显著降低(p<0.05),主要分布于杭爱山北部、萨彦岭及科尔沁沙地等地区。
3.4 土壤湿度对气候要素的响应
图6
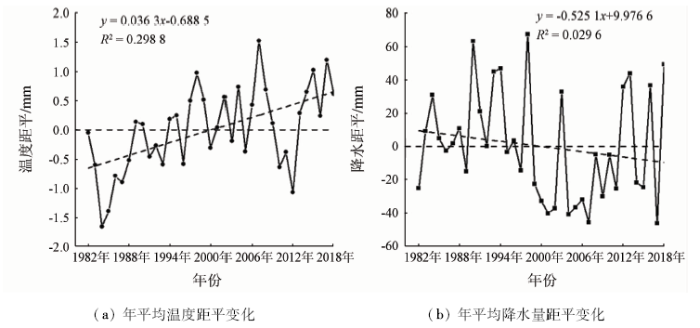
图6
蒙古原高年平均温度、降水量距平变化
Fig.6
Anomalies of the original high annual average temperature and precipitation in Mongolia
通过分析1982—2018年蒙古高原不同季节土壤湿度与降水量、温度的相关性的空间分布情况,可知各季节土壤湿度与二者的相关性有显著差异。土壤湿度与降水量整体表现为显著正相关关系(表1)。
表1 不同季节各层土壤湿度与降水相关系数面积占比
Tab.1
| 相关性 | 分布范围 R | SM1 | SM2 | ||||||
|---|---|---|---|---|---|---|---|---|---|
| 春 | 夏 | 秋 | 冬 | 春 | 夏 | 秋 | 冬 | ||
| 显著负相关 | -0.8~-0.5 | 1.1 | 1.5 | ||||||
| 低度负相关 | -0.5~-0.3 | 1.1 | 18.1 | 0.07 | 20.8 | ||||
| 负弱相关 | -0.3~0 | 0.4 | 0.2 | 0.2 | 31.2 | 65.1 | 0.7 | 8.3 | 58.8 |
| 正弱相关 | 0~0.3 | 13.1 | 6.5 | 9.1 | 51.2 | 15.5 | 8.7 | 27.6 | 18.7 |
| 低度正相关 | 0.3~0.5 | 28.7 | 18.6 | 28.2 | 13.9 | 0.2 | 20.3 | 35.1 | 0.1 |
| 显著正相关 | 0.5~0.8 | 57.6 | 60.0 | 61.6 | 2.6 | 60.5 | 28.7 | ||
| 高度正相关 | 0.8~1 | 0.2 | 14.7 | 0.9 | 9.9 | 0.02 | |||
SM1在春、夏、秋季有超过99.6%的地区与降水量呈正相关,这些区域包括高原东北部和中部的大部分地区(图7(a)-(c))。夏季,分别有60%和14.7%的地区与降水量呈显著正相关和高度正相关,呈高度相关的地区主要包括蒙古国的杭爱山和肯特山森林草原区及内蒙古东北部的西乌珠穆沁草原和呼伦贝尔草原(图7(b))。冬季,呈正相关的地区占67.7%,主要分布于通辽科尔沁沙地和阿拉善巴丹吉林-腾格里沙漠(图7(d)),该区域虽降水少,但因荒漠区相比其他地区地表反射率强,下垫面吸收能量较多,积雪融化后土壤湿度随之增加[22]。相比之下, SM2与降水量的相关性有所不同。春季,有84.3%的区域土壤湿度与降水量呈负相关,主要因为3,4月份降水较少,而高原积雪和冻土不断消融,土壤湿度增加。夏季,呈正相关的地区占99.3%(70.4%为显著和高度相关)。秋季,有91.6%的地区与降水量呈正相关(28.7%为显著相关)。冬季,呈正相关的地区占18.8%,由于受蒙古高压及西伯利亚寒潮的影响,高原整体干燥寒冷,深层土壤出现回冻。研究发现,土壤湿度与降水量相关性会随土壤层加深而减小。
图7
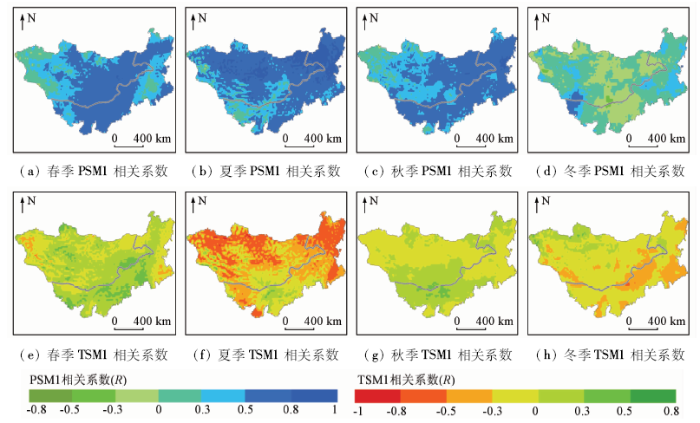
图7
1982—2018年蒙古高原不同季节0~10 cm土壤湿度与降水量(P)、温度(T)的相关性
Fig.7
Correlation between 0~10 cm soil moisture and precipitation (P) and temperature (T) in different seasons of Mongolian Plateau from 1982 to 2018
通过相关性分析发现: 土壤湿度与温度以显著负相关关系为主(表2)。SM1在春季有64.6%的地区土壤湿度与温度呈正相关,3,4月份气温回升,高原内部的冻土消融、积雪融化导致土壤湿度增大(图7(e))。夏季,呈负相关的地区占92.2%(30.3%为显著和高度相关),主要分布于蒙古国西北部的阿尔泰山、杭爱山、萨彦岭的森林草原区及内蒙古东部大兴安岭和科尔沁沙地等地区(图7(f))。夏季炎热干燥,植被生长茂盛,温度升高导致土壤湿度被大量蒸发。秋季和冬季分别有55.6%和86.4%的地区与温度呈负相关(图7(g)和图7(h)),秋冬季温度降低,表层土壤湿度主要受到降水的影响较大。研究区SM2与SM1在空间分布上也有较好的一致性。春夏秋季分别有60.1%,82.1%和68.2%的地区土壤湿度与温度呈负相关。冬季,83.6%的地区土壤湿度与温度呈正相关,由于温度降低导致深层土壤出现回冻现象,土壤湿度也随之降低。结果表明,土壤湿度与温度的相关性会随土壤层的加深而减小。
表2 不同季节各层土壤湿度与温度相关系数面积占比
Tab.2
| 相关性 | 分布范围 R | SM1 | SM2 | ||||||
|---|---|---|---|---|---|---|---|---|---|
| 春 | 夏 | 秋 | 冬 | 春 | 夏 | 秋 | 冬 | ||
| 高度负相关 | -1~-0.8 | 0.3 | 0.1 | ||||||
| 显著负相关 | -0.8~-0.5 | 0.1 | 30.0 | 0.2 | 1.8 | 29.1 | |||
| 低度负相关 | -0.5~-0.3 | 2.3 | 32.3 | 21.5 | 13.0 | 29.6 | 1.0 | 0.8 | |
| 负弱相关 | -0.3~0 | 33.1 | 29.6 | 55.6 | 64.7 | 45.3 | 23.3 | 67.2 | 15.6 |
| 正弱相关 | 0~0.3 | 54.3 | 7.0 | 42.5 | 13.1 | 29.2 | 12.6 | 30.1 | 78.3 |
| 低度正相关 | 0.3~0.5 | 10.2 | 0.8 | 1.9 | 0.5 | 9.0 | 4.0 | 1.7 | 5.3 |
| 显著正相关 | 0.5~0.8 | 0.1 | 1.7 | 1.3 | |||||
深入探究不同层土壤湿度对气候变化的响应,利用相关分析方法计算0~12月不同时滞下二者的相关性,讨论土壤湿度对气候因子的滞后效应。由图8(a)可知SM1有85.7%的地区对降水无滞后现象(时滞为0),对降水明显滞后一个月的区域占13.4%,其余月份极少地区对降水有滞后现象。而有83.6%的地区土壤湿度对温度的响应滞后6~7个月(图8(c))。这表明SM1对降水的响应快速,而对温度的响应较缓慢。SM2有91.5%的地区对前一个月的降水存在滞后现象(图8(b)),并有95.5%的地区土壤湿度对当月温度无滞后效应(图8(d)),说明深层土壤湿度对温度响应较快。综上所述,表层土壤湿度对温度有明显滞后现象,而深层土壤湿度对降水的滞后效应更显著。
图8
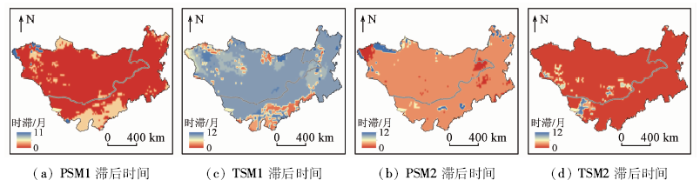
图8
不同层土壤湿度对降水量、温度响应滞后时间空间分布
Fig.8
The spatial distribution of the lag time of the response of different layers of soil moisture to precipitation and temperature
4 结论与展望
本研究以蒙古高原为研究区,基于GLDAS-Noah土壤湿度数据,分析了1982—2018年不同深度土壤湿度的时空格局、变化趋势及突变性等特征,并讨论其对气候要素变化的响应。结论如下:
2)从时间变化来看,0~10 cm土壤湿度以0.002 m3/m3/10 a的速率呈不显著上升趋势,显著增加地区占21.88%,这与土壤湿度对降水的快速响应以及气候变暖导致的积雪融化加快和冻土消融有密切联系。10~40 cm土壤湿度以-0.005 m3/m3/10 a的速率呈显著下降趋势,有52.39%区域表现为显著降低,地表温度上升,降水量减少和潜在蒸发的加剧是使土壤湿度降低的重要原因[24]。
3)近37 a来,年降水量整体上以5.251 mm/10 a的速率下降,减少趋势不显著。而年均温度以0.363 ℃/10 a上升,增加趋势较为显著。过去40 a蒙古高原平均温度上升幅度大于全球的平均值,而降水量则呈下降的趋势,区域气候的变化会导致水资源短缺、草原荒漠化及植被生产力降低等生态环境问题[25]。
4)不同季节土壤湿度与降水量主要呈正相关关系,而与温度以负相关关系为主,并且土壤湿度与二者的相关性会随土壤层加深逐渐变小。表层土壤湿度对温度有明显的滞后现象,有83.6%的地区滞后6—7个月; 而深层土壤湿度对降水的滞后效应更显著,约占总面积的91.5%。
参考文献
近50年中国北方土壤湿度的区域演变特征
[J].
Regional evolution characteristics of soil moisture in northern China in the past 50 years
[J].
The project for intercomparison of land-surface parameterization schemes
[J].
Investigating soil moisture-climate interactions in a changing climate:A review
[J].DOI:10.1016/j.earscirev.2010.02.004 URL [本文引用: 1]
近10年蒙古高原植被覆盖变化及其对气候的季节响应
[J].利用2001~2010年间MODIS NDVI数据、同期气象数据和MODIS土地覆盖分类产品,探讨蒙古高原植被覆盖变化趋势及其对气温和降水量的季节响应特征。结果表明,10 a来,蒙古高原植被覆盖度呈增加趋势和呈下降趋势的面积基本持平;春季和夏季植被覆盖度呈下降趋势,而秋季呈上升趋势,降水量是最主要的影响因子;在秋季5种植被类型均呈增加趋势,而在春季和夏季不同植被类型的增减趋势因植被类型而异。
Vegetation cover change and its seasonal response to climate in the Mongolian plateau in recent 10 years
[J].
乌兰巴托—锡林浩特样带草地植被特征与水热因子的关系
[J].
DOI:10.5846/stxb201308092051
URL
[本文引用: 1]

2012年夏季,研究人员对蒙古高原长约1100km的乌兰巴托-锡林浩特草地样带开展考察,获取了46个样地的物种数量、地上生物量等数据;基于全球GHCN(全球历史气象网络)数据集,提取了样带夏季(6-8月)月均温度和降水总量;继而根据自然地理和行政区边界,将草地样带大致分成北部(蒙古国乌兰巴托-蒙古国艾日格)、中部(蒙古国艾日格-中国苏尼特左旗)和南部(中国苏尼特左旗-中国锡林浩特),开展了分析。研究表明:(1)样带夏季平均温度的空间分布形态呈现明显的倒"U" 型分布,南北两端温度较低,中部温度较高;夏季降水量在空间上的分布形态则与之相反,呈现南北两端降水量较高,中部降水量较低的正"U"型分布;(2)样带上植物物种数量、地上生物量的空间分布形态均呈现正"U" 型分布,即在生态景观类型为典型温性草原的样带南部和北部地区,其生物多样性、地上生物量明显好于呈现为温性荒漠草原、温性荒漠景观的样带中部地区。(3)相关分析体现了大尺度(高原样带尺度)上植被特征与水热环境因子间的关系:植物物种数量、地上生物量与夏季月均温度均呈现负相关,而与夏季降水总量则呈现正相关关系。(4)偏相关分析反映了局地小尺度上植被特征与水热环境因子间的关系:温度和降水要素对于植物物种数量、地上生物量均呈现正相关。
Relationship between grassland vegetation characteristics and hydrothermal factors in Ulaanbaatar-Xilinhot transect
[J].
中国东部土壤温度、湿度变化的长期趋势及其与气候背景的联系
[J].]]>
Long-term trends of soil temperature and humidity changes in eastern China and their relationship with climate background
[J].
西南地区土壤湿度与气候之间的互馈效应
[J].
DOI:10.5846/stxb201807301613
URL
[本文引用: 1]
P2/10 a,年降水量呈不显著增加趋势,而年平均气温呈显著的增加趋势(P
Mutual feedback effects between soil moisture and climate in Southwest China
[J].
Comparison of soil moisture in GLDAS model simulations and in situ observations over the Tibetan Plateau
[J].DOI:10.1002/2015JD024131 URL [本文引用: 1]
基于TVDI的玛曲土壤湿度时空变化及其影响因素
[J].
Temporal and spatial changes of soil moisture in Maqu based on TVDI and their influencing factors
[J].
基于卫星遥感和再分析数据的青藏高原土壤湿度数据评估
[J].
DOI:10.11821/dlxb201809013
URL
[本文引用: 1]
R、RMSE、Bias),对多套遥感反演和同化数据(ECV、ERA-Interim、MERRA、Noah)进行全面评估。结果表明:① 除ERA外,其他数据均能反映青藏高原土壤水变化,且与降水量变化一致。而在那曲地区,遥感反演和同化数据均明显低估实测土壤水含量。从空间分布来看,MERRA和Noah与植被指数最为一致,可很好地反映土壤水空间变化特征;② 青藏高原大部分地区土壤水变化主要受降水影响,其中青藏高原西部边缘与喜马拉雅地区土壤水变化则受冰雪融水和降水的共同影响;③ 除阿里地区外,大部分遥感反演和同化数据在融化期与实测土壤水相关性高于冻结期,其中在那曲地区,遥感反演和同化数据均高估冻结期土壤含水量,却低估融化期土壤含水量。另外,遥感反演和同化数据对中大空间尺度土壤水的估计要好于对小空间尺度土壤水的估计。本研究为青藏高原土壤水研究的数据集选择提供重要理论依据。]]>
Evaluation of soil moisture data on the Qinghai-Tibet Plateau based on satellite remote sensing and reanalysis data
[J].
DOI:10.11821/dlxb201809013
URL
[本文引用: 1]
Soil water is the key link between land surface and atmosphere in water-heat exchange and it is the key element of water cycle. It is also the key control factor affecting the process of surface runoff. The Himalayan-Tibetan Plateau (HTP), also known as the "Asian Water Tower", is the source region of many Asian rivers. Meanwhile, HTP has direct impacts on its surrounding climate via hydro-meteorological processes, and on establishment and maintenance of Asian monsoon. This study collected observed soil moisture data from 100 in-situ soil moisture observatory stations and evaluated applicability of the available remote sensing and reanalysis soil moisture datasets such as ECV, ERA-Interim, MERRA, and Noah at different spatial resolutions (0.25°×0.25°, 0.5°×0.5°, 1°×1°) during different time intervals such as non-freezing and freezing periods. Statistical indicators such as R, RMSE and Bias were used to evaluate the performances of these remote sensing and reanalysis soil moisture datasets. The results indicated that: (1) All remote sensing and reanalysis soil moisture datasets except ERA can well estimate soil moisture changes of the Tibetan Plateau and the soil moisture changes are in generally good line with precipitation changes. In the Naqu region, however, the remote sensing and reanalysis soil moisture datasets substantially underestimate observed soil moisture. In space, MERRA and Noah are mostly consistent with the change of vegetation index, and can well estimate spatial distribution of soil moisture changes. (2) Soil moisture changes across most parts of the Tibetan Plateau are greatly influenced by precipitation changes. In addition, soil moisture changes in the western flank of the Tibetan Plateau and Himalayas are the combined results of melting snow/glaciers and precipitation. (3) Except in the Ngari region, soil moisture during non-freezing period is usually higher than that during freezing period. In the Naqu region, all remote sensing and reanalysis soil moisture datasets overestimate soil moisture amount during freezing periods, while they underestimate it during non-freezing periods. Besides, from a spatial scale viewpoint, at medium and large scales, remote sensing and reanalysis soil moisture datasets can better evaluate soil moisture availability compared with at small scale. This study provides a theoretical basis for selection of the right remote sensing and reanalysis soil moisture datasets for evaluation and analysis of soil moisture of the Tibetan Plateau.
黄土高原植被覆盖与土壤湿度的时滞关联及时空特征分析
[J].
DOI:10.5846/stxb201703050361
URL
[本文引用: 1]
基于2000-2014年的MODIS-NDVI与MODIS-LST数据,利用温度植被干旱指数对黄土高原土壤湿度进行了反演,采用时滞互相关法分析了土壤湿度与植被覆盖的年内变化特征及其时空相互关系。结果如下:(1)黄土高原植被生长对土壤湿度变化存在明显的时滞效应,植被生长以及植被物候与土壤湿度变化密切相关。(2)黄土高原土壤湿度对其植被覆盖变化影响强烈区,主要分布在农业与草原生态区北部的丘陵沟壑区,植被生长对土壤湿度响应迟缓;而植被覆盖对土壤湿度变化影响强烈区,分布于西部的高寒地带,响应时间相对最短,其次为农业与草原生态区内河流中上游流域,且土壤湿度对植被覆盖的响应较快,自东向西、自北向南响应逐渐加快。(3)从植被类型来看,Ⅰ类植被的植被覆盖与土壤湿度负相关性较强,植被生长对土壤湿度变化的响应程度依次减弱,响应速度较慢且依次加快。Ⅱ类植被的植被覆盖与土壤湿度的相关性很弱,滞后时间接近于0天,反映出植被覆盖与土壤湿度同步变化。土壤湿度变化滞后于Ⅲ类植被(旱生/沙生植被)的植被覆盖变化,植被覆盖正向影响土壤湿度变化的强度依次增加,但时间效应依次延长。Ⅳ类植被(高山/高寒植被)生长对土壤湿度变化的正向影响程度最强,而且响应速度较快。(4)黄土高原植被生长与土壤水分的年内变化具有密切的关系,土壤水分年内变化的峰值和谷值与植被物候期非常吻合,因此土壤水分的年内变化可作为植被物候特征提取的一种重要依据。
Time-dependent and spatial-temporal characteristics of vegetation cover and soil moisture on the Loess Plateau
[J].
利用GLDAS资料分析黄土高原半干旱区土壤湿度对气候变化的响应
[J].
Using GLDAS data to analyze the response of soil moisture to climate change in the semi-arid region of the Loess Plateau
[J].
基于AMSR-2蒙古高原土壤湿度反演及对气象因子响应分析
[J].3.cm-3, 反演结果明显优于JAXA提供的AMSR-2土壤水分产品数据(RMSE=0.044 1 cm3.cm-3)。2)TRMM 3B43降雨数据与实测降雨量线性拟合, 其判定系数为0.859 8, 直线拟合斜率K=0.941 5, 在数值上较站点实测值略微偏低, 表明TRMM 3B43数据精度较高, 在蒙古高原具有很好的适用性。3)蒙古高原植被生长期土壤水分、植被指数及降水量在空间格局上均表现出由北向南、由东北向西南逐渐减少的趋势。干旱区, 土壤水分对气温变化最敏感, 二者表现出显著正相关关系, 其次为降水和植被; 半干旱区, 植被是影响土壤水分的关键因子, 而气温与降水对土壤水分影响呈现出季节性变化; 半湿润区3个因子对土壤水分的影响程度表现为植被>降水>气温。总之, 利用土壤水分对气象因子和植被的响应特性, 可以采取适当措施降低蒙古高原灾害发生风险, 为区域生态环境建设提供科学依据。]]>
Soil moisture retrieval and response to meteorological factors in the Mongolian Plateau based on AMSR-2
[J].3.cm-3. The retrieval result was much better than soil moisture product data of JAXA (RMSE = 0.044 1 cm3.cm-3). 2) The developed model had a high accuracy and was applicable in surface soil moisture estimation. The regression coefficient of the linear fit of the TRMM 3B43 precipitation measure (rainfall) was 0.859 8 and with a slope line of 0.941 5, which suggested that TRMM 3B43 data were applicable in the Mongolia Plateau. 3) Total precipitation, mean NDVI and soil moisture during the growing season decreased gradually from north to south and from northeast to southwest. In the arid region of the study area, soil moisture was significantly and positively correlated with temperature, followed by precipitation and vegetation. In the semi-arid region of the study area, vegetation was the key factor driving soil moisture, and the effects of temperature and precipitation on soil moisture showed seasonal variations. The response of soil moisture to the three factors was in the order of vegetation > precipitation > temperature in the semi-humid region of the study area. In conclusion, the response of soil moisture to both environmental factors and vegetation could provide scientific basis for constructing healthy regional eco-environments with reducing disasters risk.]]>
基于卫星遥感资料的中国区域土壤湿度EnKF数据同化
[J].
Assimilation of EnKF data of regional soil moisture in China based on satellite remote sensing data
[J].
多种土壤湿度资料在中国地区的对比分析
[J].
Comparative analysis of various soil moisture data in China
[J].
蒙古高原植被时空格局对气候变化的响应研究
[D].
Study on the response of the temporal and spatial pattern of the vegetation on the Mongolian Plateau to climate change
[D].
The Global Land Data Assimilation System
[J].DOI:10.1175/BAMS-85-3-381 URL [本文引用: 1]
中亚地区1982年至2002年植被指数与温度和降水的相关性分析
[J].0.0005 NDVI/a(增加),6%地区NDVI年变化率0.05=0.001),0.0009 NDVI/a(p0.05=0.001),落叶林、草原、作物、草原化荒漠NDVI没有显著变化(p0.05>0.05);②年均NDVI与降水、温度相关性分析结果表明,49.00%的地区年均NDVI与年降水量呈正相关,52.33%的地区NDVI与春季降水量正相关,33.69%的地区NDVI与夏季降水量正相关,70.00%的地区年均NDVI与各季气温弱相关,仅17.78%的地区年均NDVI与年均气温正相关;6种植被类型NDVI与降水、气温相关关系为,常绿林、高山草甸年均NDVI与年均气温分别低度、显著正相关性,相关系数分别为0.432(p0.05=0.05)、0.557(p0.05=0.009);草原、作物与年降水量分别显著、低度正相关,相关系数分别为0.511(p0.05=0.018)、0.476(p0.05=0.029);落叶林NDVI与夏、冬季降水量低度正相关,相关系数分别为0.415(p0.05=0.061)、0.461(p0.05=0.035);草原化荒漠NDVI与春季降水量正相关但不显著,相关系数为0.415(p0.05=0.061)。]]>
Analysis of the correlation between vegetation index and temperature and precipitation in Central Asia from 1982 to 2002
[J].The five countries in Middle Asia lie in the center of Eurasia. Most part of this region is arid and semi-arid zone with sparse vegetation cover. The study of the vegetation dynamics and environmental change in this region is important to the research of environment and climate in China. This paper explored the vegetation dynamics and its relationship with major climatic factors in middle Asia by using AVHRR-NDVI dataset at 8km spatial resolution and CRU climate data set at 0.5° spatial resolution between 1982 and 2002. These two datasets were unified to the same spatial resolution of 8km and Alberta geographic projection. The trend analysis showed that 53 percent of the land cover was relatively stable, with a very small NDVI change of ±0.005 NDVI per year. These regions, especially the two large deserts, were mainly in the center of Middle Asia. Forty percent of the land had a NDVI up-trend of more than 0.0005 NDVI per year, which was mainly in the north and south of Middle Asia, while only 6 percent of the land had a NDVI down-trend of less than 0.0005 NDVI per year. The analysis on land cover types indicated that evergreen forest and alpine grass (steppe) were among the best up-trend group with NDVI gains more than 0.0014 and 0.0009 per year, while the p values are 0.001 and 0.001 respectively. There were no obvious changes in deciduous forest, grass, crop and steppified desert. To investigate the possible driving forces, correlation analysis was conducted between AVHRR-NDVI and major climatic factors, which are precipitation and temperature. In 49 percent of the area, especially in the forest steppe in north Middle Asia, annual average AVHRR-NDVI was closely related to the annual precipitation, especially that in spring and summer. Only 17.78 percent of the area is related to the annual average temperature with a validation coefficient of more than 0.05. Annually speaking, the positive correlation coefficient of evergreen forest, alpine grass with the annual average temperature is relatively low, with the correlation coefficients of 0.432 and 0.557 as well as p value of 0.052 and 0.009 respectively. The positive correlation coefficient of crop and grass with annual precipitation are comparatively low with R values of 0.511and 0.476 as well as p values of 0.018 and 0.029 respectively. The R value between NDVI and precipitation for deciduous forest was 0.415 in summer and 0.461 in winter, while the p value was 0.01 in summer and 0.461 in winter. The positive correlation coefficient of re-vegetated desert cover with precipitation in spring is relatively lower with the R value of 0.415 and the p value of 0.0061.
内蒙古地区多种土壤湿度资料的初步评估
[J].
Preliminary evaluation of various soil moisture data in Inner Mongolia
[J].
蒙古高原近35年气候变化
[D].
Climate change on the Mongolian Plateau in the past 35 years
[D].
塔克拉玛干沙漠腹地冬季积雪下垫面地表反照率及土壤温湿度变化特征
[J].
Characteristics of surface albedo and soil temperature and humidity changes in the winter snow cover of the Taklimakan Desert hinterland
[J].
近54a蒙古高原降水变化趋势及区域分异特征
[J].
Variation trend and regional differentiation of precipitation in the Mongolian Plateau in recent 54 years
[J].
Analysis for spatio-temporal variation characteristics of droughts in different climatic regions of the Mongolian Plateau based on SPEI
[J].DOI:10.3390/su11205767 URL [本文引用: 1]
NDVI-based long-term vegetation dynamics and its response to climatic change in the Mongolian Plateau
[J].DOI:10.3390/rs6098337 URL [本文引用: 1]
