

0 引言
已有大量研究表明,城市热岛变化特征与城市发展特征高度相似,由于城市人口密集,土地利用类型多为建筑用地,大量释放的人为热等导致城市热岛现象普遍存在[3⇓-5]。城市冷岛效应是随着城市热岛效应研究深入而发展起来的,在城市热岛内部,零星散布着明显低于周围环境温度的冷点区域,这一现象被称为冷岛效应[6]。一般来说,城市中的绿色空间能够有效减轻热岛效应程度[7],这些绿色空间由林地、草地、水体、湿地等土地利用类型组成。林草地具有蒸腾、遮阴作用[8],水体自身具有高热容性、流动性、低热辐射率等特点[9],湿地则同时具有以上两种作用[10],这些绿色空间通过降温、增湿来调节局地气候[11],形成冷岛效应。近年来,城市绿色空间对热岛效应影响的相关研究逐步增加[12],尤其是2009年以后,有学者开始深入探究城市热岛的形成机制,并将绿地格局作为研究切入点[13⇓-15]。研究表明,城市绿地的空间组成对城市热岛效应有显著影响[16-17],但绿地斑块所占比例和总面积对热岛效应改善影响有区别[18-19]。此外,城市绿地空间配置也对城市热岛效应有影响,主要表现为城市绿地的形状、密度、边界、聚集度、离散度及城乡梯度上绿地分布格局的差异[20-21]。已有研究对于不同土地利用类型,尤其是绿色空间对城市热岛效应的影响已经较为深入[22],但是城市绿色空间的演化对于热岛温度变化的影响研究较为匮乏。有学者以福建省福州市为例研究了城市绿色空间演化过程对温度变化的影响[23],但是北方城市水体较少、绿植较稀疏的绿色空间演化对温度影响是否与南方城市相同有待进一步研究。因此,本研究选取华北地区典型工业化城市唐山为研究对象,利用遥感、GIS软件及相关统计方法,着重分析城市绿色空间的演化对于地表温度的影响。研究能给地方政府部门城市规划尤其是绿色空间的规划提供理论指导,具有重要的实际应用价值。
1 研究区概况及数据源
1.1 研究区概况
1.2 数据源及其预处理
本研究采用的数据均为Landsat系列卫星影像,其中4景为Landsat5影像,分别是1993年、2000年、2003年和2009年,3景为Landsat8影像,分别为2014年、2018年和2019年,这7景影像基本包含了唐山城市建设快速发展的时段。影像来源于美国地质勘探局(USGS)官网,采集时间为6月底至8月初,研究区无云覆盖。数据需进行辐射校正、大气校正等预处理。
2 研究方法
2.1 地表温度反演
2.1.1 辐射传输方程
辐射传输方程法,也称大气校正法(radiative transfer equation algorithm,RTE)。基本原理为卫星传感器接收到的热红外辐射亮度值
式中:
式中: 对于不同的Landsat数据,
2.1.2 地表比辐射率计算
式中:
2.1.3 温度标准化分级
图1

图1
唐山市中心城区1993—2019年温度分布变化
Fig.1
Changes of temperature distribution in the downtown area of Tangshan from 1993 to 2019
2.2 土地利用分类及绿色空间演化
2.2.1 监督分类
采用监督分类方法,根据唐山市土地利用实际情况进行分类,将研究区划分为林/草地、农业用地、水体、城镇、裸地等5类。
2.2.2 绿色空间演化
根据以上界定,对监督分类后影像的各个类型进行叠置分析,如前后2景影像均为水体,则表示为绿色空间不变; 如由水体演变成城镇,则表示为绿色空间损失,以此类推。各年份之间绿色空间动态演化情况如图2所示。
图2
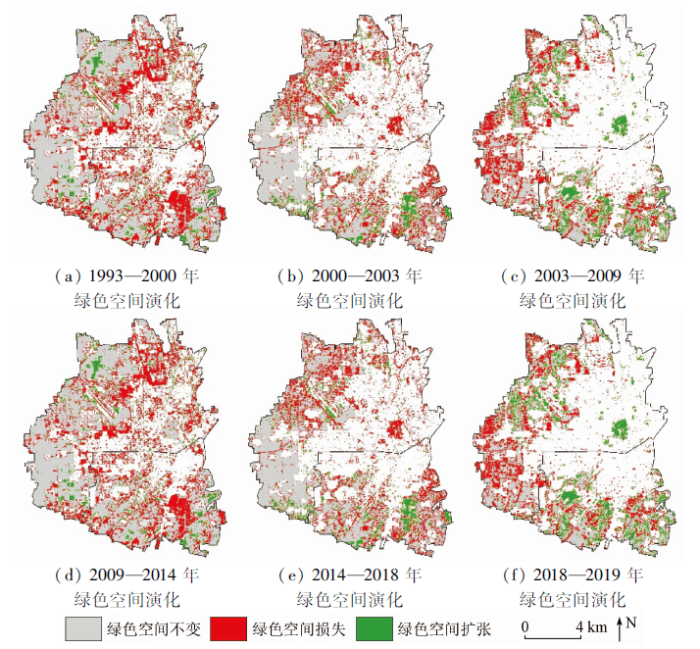
图2
唐山市中心城区1993—2019年绿色空间演化图
Fig.2
Green space evolution in the downtown area of Tangshan from 1993 to 2019
2.3 统计分析
2.3.1 重心分析
从温度分级图中分别提取出冷岛、热岛区域,从土地利用分类图中分别提取出城镇、绿色空间区域,计算各区域重心,用于分析冷热岛变化趋势和城市不同用地类型演化之间的关系。
2.3.2 随机采样统计
对研究区范围内随机采样100个点,叠加1993年、2019年土地利用类型、地表温度数据进行采样,用于量化分析绿色空间演化对温度的影响。
3 结果与讨论
3.1 城市热岛变化特征
图1可见,20世纪90年代研究区的热岛区域集中分布于城市中东部,2003年开始逐步向西北方向蔓延,2018年以后热岛区域较为分散且分布较广,不再有明显热岛中心。而20世纪90年代研究区并不存在明显冷岛中心,冷岛区域主要分布在研究区边缘地带,2000—2009年南部区域开始出现冷岛中心,2009年之后,中南部地区冷岛中心较为明显。据了解,研究区城市建设经历了几个快速发展的时期,1996年开始对城市南部采煤塌陷区进行综合整治,在此基础上建设了南湖公园并于2009年对外开放,逐步成为了研究区冷岛中心。2008年研究区西北部的“凤凰新城”项目开始建设,2014年研究区西南部的“站西片区”开始建设,这些大规模的城市规划建设项目与研究区热岛发展方向和时间都较为一致。
从冷热岛转移面积上来看(图3(a)),2009年以前,热岛区转为冷岛区的面积多于冷岛区转为热岛区的面积,全区的热岛面积有所下降,仅2000—2003年3年时间,热岛区转为冷岛区的面积就达22.53 km2,转化速率为7.51 km2·a-1; 2009年以后,仅有极少量的热岛区转为冷岛区,而冷岛区转为热岛区的面积却大幅上升,2014—2018年4 a时间,冷岛区转为热岛区的面积就增加了23.68 km2,转化速率为5.92 km2·a-1,这也与研究区大规模城市规划建设项目时间相对应。2018年以后冷岛区转热岛区面积几乎没有增加,而热岛区转冷岛区面积有增加趋势,这是由于研究区范围内大规模城市建设已经基本完成,并且由于生态文明建设的要求,地方政府较重视城市绿化,绿色空间开始缓慢增长。从转化速率上来看(图3(b)),研究时段内,冷岛区转热岛区的速率呈明显增加趋势,热岛区转冷岛区的速率呈明显降低趋势。
图3
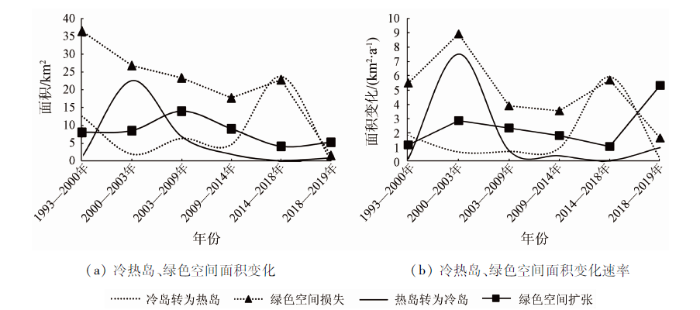
图3
冷热岛、绿色空间面积及转化速率变化趋势图
Fig.3
Change trend of UCI/UHI/UGS area and evolution rate
从温度等级面积转化来看(表1),1993年次高温区面积最大,为44.28 km2,其次分别为中温区(38.99 km2)、次低温区(36.76 km2); 2019年,次高温区面积依然最大,为54.60 km2,但面积排名第二变为高温区(43.97 km2)。1993—2019年,冷岛区面积均出现损失,其中次低温区面积损失最大,达22.86 km2; 热岛区面积均有所增长,其中高温区面积增长最大,达13.65 km2,次高温区次之,达10.32 km2。
表1 研究区温度等级面积转化
Tab.1
| 温度 等级 | 低温区 | 次低 温区 | 中温区 | 次高 温区 | 高温区 | 超高 温区 |
|---|---|---|---|---|---|---|
| 总和 (1993年) | 8.27 | 36.76 | 38.99 | 44.28 | 30.33 | 8.81 |
| 总和 (2019年) | 5.50 | 13.90 | 34.87 | 54.60 | 43.97 | 14.61 |
| 面积变化 | -2.78 | -22.86 | -4.12 | 10.32 | 13.65 | 5.80 |
3.2 城市绿色空间变化特征
随着城市化进程不断推进,城市绿色空间范围也不断缩小,1993—2018年,绿色空间损失的面积均明显大于绿色空间扩张面积,绿色空间损失区域大部分位于研究区西北部,仅在中南部存在小范围的绿色空间扩张; 2019年绿色空间面积有小幅增加(图2)。绿色空间面积损失最大的是1993—2000年,损失面积达36.36 km2,损失速率最快的为2000—2003年,损失速率达8.92 km2·a-1; 绿色空间面积扩张最大的是2003—2009年,扩张面积达14.02 km2,扩张速率最快的是2018—2019年,达5.32 km2·a-1(表2)。1993年面积最大的土地利用类型为农业用地,面积达86.1 km2,2019年面积最大的土地利用类型为城镇,面积达118.12 km2。1993—2019年,土地利用类型面积损失最大的为农业用地,达55.79 km2,面积扩张最大的为城镇,增长面积达47.85 km2(表3)。
表2 研究区绿色空间演化面积及变化速率
Tab.2
时间 | 绿色空间扩张 | 绿色空间不变 | 绿色空间损失 | |||
|---|---|---|---|---|---|---|
| 面积/km2 | 速率/(km2·a-1) | 面积/km2 | 速率/(km2·a-1) | 面积/km2 | 速率/(km2·a-1) | |
| 1993—2000年 | 8.11 | 1.16 | 61.3 | 8.76 | 36.36 | 5.48 |
| 2000—2003年 | 8.59 | 2.86 | 42.65 | 14.22 | 26.76 | 8.92 |
| 2003—2009年 | 14.02 | 2.34 | 27.85 | 4.64 | 23.31 | 3.89 |
| 2009—2014年 | 9.10 | 1.82 | 24.00 | 4.80 | 17.72 | 3.54 |
| 2014—2018年 | 4.20 | 1.05 | 9.55 | 2.39 | 22.80 | 5.70 |
| 2018—2019年 | 5.32 | 5.32 | 12.11 | 12.11 | 1.64 | 1.64 |
表3 研究区土地利用转化面积
Tab.3
| 时间 | 水体 | 城镇 | 耕地 | 林地 | 裸地 |
|---|---|---|---|---|---|
| 总和(1993年) | 1.61 | 70.27 | 86.1 | 9.94 | 0.03 |
| 总和(2019年) | 3.14 | 118.12 | 30.31 | 9.08 | 7.30 |
| 面积变化 | 1.53 | 47.85 | -55.79 | -0.86 | 7.27 |
自1993—2018年,绿色空间损失的面积是呈递减趋势的,绿色空间扩张的面积相对较为稳定,面积变化速率趋势也大致相同,但冷热岛面积相互转换的趋势在1993—2003年时间段内并没有与之相一致,甚至出现绿色空间降低,热岛面积也减少的情况。2009—2019年时间段内,冷热岛面积相互转换的趋势与绿色空间面积转换趋势趋于一致(图3)。表明在城市发展的不同阶段,绿色空间的演化引起地表温度变化的效果有所区别,在城市发展早期,城镇化程度较低,绿色空间面积较大,城市热岛效应不明显,此时如果损失少量的绿色空间并不会导致热岛效应迅速增强。在城市发展了一段时间后,城镇化程度已经相当高,除了湿地公园外绿色空间仅斑块状存在,这时增加少量的城镇面积就会导致热岛效应显著增强,而增加少量的绿色空间对于缓解城市热岛效应效果不明显,这与已有学者的研究结果相吻合[12,23]。显然,城市绿色空间转移对于热岛效应的影响是与城市绿色空间存量存在一定的关系,具体的量化指标还有待进一步研究。
3.3 绿色空间、城镇重心与冷热岛重心迁移特征
利用GIS软件提取了城市冷、热岛重心及城镇、绿色空间的重心(图4)。可以看出,城市绿色空间重心和冷岛重心在2003年之前迁移方向不太一致; 2003年之后,两者迁移方向趋于一致,均由西北向东南方向移动,且重心移动距离较长,可达4 km左右。城镇重心和热岛重心在2003年之前同样迁移方向不一致,并且城镇重心在2003年之前基本无变化; 2003年之后,两者迁移方向趋于一致,均向城市西北方向迁移。由此表明,城市下垫面的改变是造成热岛发生发展的重要因素,城市热岛与城镇化发展进程关系密切,城市冷岛分布与绿色空间的扩张息息相关。
图4
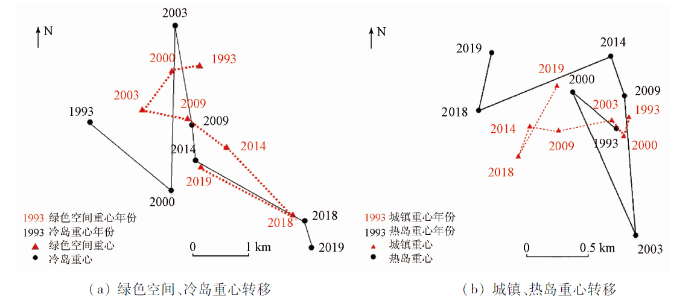
图4
研究区绿色空间、冷岛及城镇、热岛重心转移图
Fig.4
Movement of the gravity center of UGS/UCI and Urban/UHI
3.4 绿色空间演化对温度的影响
研究区范围内随机取样100个点,分别统计1993年,2019年这100个点所对应的地表温度以及土地利用类型,分析绿色空间演化对地表温度的影响。表4可见,绿色空间损失造成的升温幅度平均值为6.37 ℃,大于绿色空间交换的影响; 而绿色空间扩张则造成地表温度下降,下降幅度平均值为-0.16 ℃。研究表明,绿色空间扩张对于城市地表降温的作用远小于绿色空间损失造成的地表升温作用。这是由于绿色空间的损失往往是大块面积的改变,比如房地产开发、基础设施建设等; 而绿色空间扩张一般是小面积的增加,比如街心公园、沿路的绿化等等,对于地表降温影响有限。
表4 绿色空间演化对地表温度的影响
Tab.4
| 绿色空间演变 | 绿色空间扩张 | 绿色空间交换 | 绿色空间损失 |
|---|---|---|---|
| 温度变化/℃ | -0.16 | 3.00 | 6.37 |
4 结论
本研究利用遥感数据反演了唐山中心城区地表温度,以多种空间统计方法分析了研究区绿色空间的变化及其对地表温度的影响。结果表明:
1)研究时段内,城市热岛面积增加较为明显,次低温区面积损失最大,高温区面积增加最大,热岛发展方向和面积与城市快速发展的规模和方向较为一致。
2)每个时间段内的绿色空间损失面积均大于扩张面积,农业用地损失的面积最大,城镇增加的面积最大; 且在城市的不同发展阶段,冷热岛演化的趋势与绿色空间演化趋势不一致,这或许与绿色空间存量有一定关系。
3)城市下垫面的改变是造成地表温度改变的重要因素,冷热岛重心的迁移方向和绿色空间、城镇重心方向较为一致。
4)绿色空间扩张对于城市地表降温的作用远小于绿色空间损失造成的地表升温作用,这与绿色空间扩张、损失的规模有关。
综上所述,城市快速发展与城市热岛效应的增强之间确实存在密切关系,但是并非城市发展就一定会造成热岛效应增强,合理做好城市规划,保留足够的绿色空间存量,且绿色空间规模达到一定标准,便可有效缓解城市热岛效应,促进城市绿色健康发展。
参考文献
基于MODIS数据的重庆市城市热岛效应时空分析
[J].
Spatiotemporal distribution of urban heat island effect based on MODIS data in Chongqing,China
[J].
城市热岛效应研究进展
[J].
Research progress in urban heat island
[J].
基于遥感的北京市城市化发展与城市热岛效应变化关系研究
[J].
Research on the relation of the urbanization and urban heat island effect changes in Beijing based on remote sensing
[J].
超大城市热岛效应的季节变化特征及其年际差异
[J].
Study on seasonal variations of the urban heat island and its interannual changes in a typical Chinese megacity
[J].
近10a武汉市城市热岛效应演变及其与土地利用变化的关系
[J].
Evolution of urban heat island effect and its relationship with land use change in Wuhan City in recent 10 years
[J].
Estimation of the relationship between urban park characteristics and park cool island intensity by remote sensing data and field measurement
[J].DOI:10.3390/f4040868 URL [本文引用: 1]
基于Landsat-8影像的沿海城市公园冷岛效应——以厦门为例
[J].
Quantifying the cool-island effects of urban parks using Landsat-8 imagery in a coastal city,Xiamen,China
[J].
The bigger,the better? The influence of urban green space design on cooling effects for residential areas
[J].DOI:10.2134/jeq2015.01.0062 URL [本文引用: 1]
Quantifying the influences of various ecological factors on land surface temperature of urban forests
[J].DOI:10.1016/j.envpol.2016.06.004 URL [本文引用: 1]
城市湿地气候调节功能遥感监测评估
[J].
Monitoring and evaluation for climate regulation service of urban wetlands with remote sensing
[J].
城市绿地对热岛效应的缓解作用研究——以台州市为例
[J].
Heat island effect mitigation by urban green space system:A case study of Taizhou City
[J].
城市绿地空间格局对热岛效应的影响研究进展
[J].
Research progress about the impact of urban green space spatial pattern on urban heat island
[J].
Studying dynamical monitoring of heat island effect based on MODIS data in coastal cities of southeast Fujian Province
[C].
The characteristics of urban heat island variation in Beijing urban area and its impact factors
[C].
Effects of land use/cover changes and urban forest configuration on urban heat islands in a loess hilly region:Case study based on Yan’an City,China
[J].DOI:10.3390/ijerph14080840 URL [本文引用: 1]
Effects of spatio-temporal landscape patterns on land surface temperature:A case study of Xi’an City,China
[J].DOI:10.1007/s10661-018-6787-z URL [本文引用: 1]
Quantifying spatial-temporal pattern of urban heat island in Beijing:An improved assessment using land surface temperature (LST) time series observations from Landsat,MODIS,and Chinese new satellite GaoFen-1
[J].
Quantifying the cool island effects of urban green spaces using remote sensing data
[J].
The degree,extent and value of air temperature amelioration by urban green spaces in Bulawayo,Zimbabwe
[J].DOI:10.1080/03736245.2019.1685405 URL [本文引用: 1]
Effects of landscape composition and pattern on land surface temperature:An urban heat island study in the megacities of Southeast Asia
[J].DOI:10.1016/j.scitotenv.2016.10.195 URL [本文引用: 1]
Optimizing urban greenspace spatial pattern to mitigate urban heat island effects:Extending understanding from local to the city scale
[J].
珠三角城市群热岛时空分布及定量评估研究
[J].
Research on quantitative evaluations and spatial and temporal distribution of heat islands for the Pearl River Delta agglomeration
[J].
基于遥感的城市绿色空间演化过程的温度效应研究——以福州主城区为例
[J].
Temperature effect under the green space evolution based on remote sensing:A case study of Fuzhou,China
[J].
基于RS与GIS唐山海岸带地区近50年土地利用格局时空特征分析
[J].
Analysis of temporal and spatial characteristics of land use pattern in Tangshan coastal zone from 1956 to 2005 based on RS and GIS
[J].
基于Landsat系列数据地表温度反演算法对比分析——以齐齐哈尔市辖区为例
[J].
Algorithms comparison of land surface temperature retrieval from Landsat series data:A case study in Qiqihar,China
[J].
用陆地卫星TM6数据演算地表温度的单窗算法
[J].
DOI:10.11821/xb200104009
[本文引用: 1]

陆地卫星 TM数据 (TM6)热波段表示地表热辐射和地表温度变化。长期以来,从 TM6数据中演算地表温度通常是通过所谓大气校正法。这一方法需要估计大气热辐射和大气对地表热辐射传导的影响,计算过程很复杂,误差也较大,在实际中应用不多。根据地表热辐射传导方程,推导出一个简单易行并且精度较高的演算方法,把大气和地表的影响直接包括在演算公式中。该算法需要用地表辐射率、大气透射率和大气平均温度 3个参数进行地表温度的演算。验证表明,该方法的地表温度演算较高。当参数估计没有误差时,该方法的地表温度演算精度达到 <0.4℃,在参数估计有适度误差时,演算精度仍达 <1.1℃。因该方法适用于仅有一个热波段的遥感数据,故称为单窗算法。
Mono-window algorithm for retrieving land surface temperature from Landsat TM6 data
[J].
DOI:10.11821/xb200104009
[本文引用: 1]
Landsat TM data has a thermal band (TM6) to monitor the thermal radiance and surface temperature of the earth. For a long time, retrieval of surface temperature from TM6 data is done through the method called atmospheric correction, which requires the estimate of atmospheric thermal radiance and absorption. The computation is complicated and the accuracy is strongly subjected to the estimate, hence has few applications in real world. In this paper, a new method with simple computation and high accuracy is developed on the basis of thermal radiance transfer equation of the ground. The impacts of both atmosphere and the emitted ground on the thermal radiance transfer of the ground are directly involved into the proposed algorithm, which requires 3 essential parameters for the retrieval: emissivity, transmittance and atmospheric average temperature. Validation indicates that the accuracy of the algorithm is high up to <0.4℃ for the estimate of the essential parameters with no errors and <1.1℃ for the estimate moderate errors. Since the method is applicable for the remote sensing data with only one thermal band, it has been termed as mono window algorithm.
A generalized single-channel method for retrieving land surface temperature from remote sensing data
[J].
用辐射传输方程从MODIS数据中反演地表温度的方法
[J].
Retrieving land surface temperature from MODIS data by using radiance transfer equation
[J].
Derivation of land surface temperature for Landsat-8 TIRS using a split window algorithm
[J].
DOI:10.3390/s140405768
PMID:24670716
[本文引用: 1]
Land surface temperature (LST) is one of the most important variables measured by satellite remote sensing. Public domain data are available from the newly operational Landsat-8 Thermal Infrared Sensor (TIRS). This paper presents an adjustment of the split window algorithm (SWA) for TIRS that uses atmospheric transmittance and land surface emissivity (LSE) as inputs. Various alternatives for estimating these SWA inputs are reviewed, and a sensitivity analysis of the SWA to misestimating the input parameters is performed. The accuracy of the current development was assessed using simulated Modtran data. The root mean square error (RMSE) of the simulated LST was calculated as 0.93 °C. This SWA development is leading to progress in the determination of LST by Landsat-8 TIRS.
陆地卫星TM6波段范围内地表比辐射率的估计
[J].
The estimation of land surface emissivity for Landsat TM6
[J].
Landsat8数据地表温度反演算法对比
[J].
Comparison of four algorithms to retrieve land surface temperature using Landsat 8 satellite
[J].
Urban thermal environment dynamics and associated landscape pattern factors: A case study in the Beijing metropolitan region
[J].DOI:10.1016/j.rse.2015.11.027 URL [本文引用: 1]
城市绿化的发展思路—绿色空间建设
[J].
Ideas on urban greening-green space construction
[J].
