

0 引言
海水养殖业是世界海洋经济发展最快的行业之一,过去几十年其均处于不断扩张的过程[1]。中国海域面积广阔,大陆海岸线达1.8万km2,优越的水热条件使得中国海水养殖业发展迅速[2]。作为世界第一海水养殖大国,中国海水养殖业约占全球海水养殖的2/3,仍呈现出巨大的发展潜力,为国家发展提供了巨大的经济效益[3]。然而,海水养殖业的快速发展,虽然满足了日益增长的海产品消费需求,但也导致海岸带区域出现一系列严重的生态环境问题[4],如海水富营养化、赤潮等生态问题,加之人类活动的持续影响,使得海岸带区域成为生态灾害频发的生态脆弱重点区域[5⇓-7]。因此,及时准确地掌握海水养殖区的空间分布及面积变化趋势十分重要,这有利于管理部门合理规划区域海水养殖区,以协调海水养殖与海洋生态环境之间的关系,对于沿海区域的科学管理和海水养殖业的可持续发展具有重要的促进作用。
遥感技术具有覆盖范围广、成本低等特点[8-9]。因此,利用遥感影像对海水养殖区进行长时间、大范围的信息提取,已成为海洋经济和海洋生态领域的重要研究内容之一。当前,使用遥感影像对海水养殖区的提取方法主要包括目视解译法[10]、特征分析法[11-12]和面向对象法[13]。具体而言,即通过人工目视解译提取海水养殖区,利用空间形态和光谱特征对海水养殖区开展特征分析和信息提取以及基于面向对象技术提取海水养殖区信息。这些方法有效地利用遥感影像提取海水养殖区,获得相关特征信息,为海洋管理做出了一定的贡献。但是,人工目视解译费时费力,并且依赖于目视解译者的经验,可重复性差,具有较强的主观随意性。而相较于人工目视解译识别,利用空间形态、光谱特征以及面向对象技术等方法具有更高的海水养殖区识别精度,但需要进行多次实地调查采样,无法有效地对广阔海域开展海水养殖区提取。此外,上述方法往往需要调整部分分析参数,依赖于参数调优和专家经验,或仅适用于背景环境光谱差异较大区域。
近年来深度学习发展迅速,已被广泛地运用于图像处理领域,其对遥感影像分类和语义分割,都能够有效地利用其光谱纹理特征,减少人工干预[14]。深度学习网络模型包括卷积神经网络(convolutional neural network,CNN)、深度信念网络(deep belief networks,DBN)、全卷积神经网络(fully convolutional network,FCN)等类型[14]。其中,U-Net卷积神经网络是2015年ISBI Challenge竞赛中提出的一种分割网络,由于其较好的分割效果而被应用于医学图像分割领域[15]。U-Net模型是对 FCN的借鉴和发展,是FCN的一种改进模型。不同于FCN的上采样阶段对浅层和深层特征的融合采用简单相加,U-Net模型中是将两者拼接起来,近年来已被广泛地运用于遥感影像分类领域[16]。相关研究表明,基于U-Net模型的遥感影像分类,能够更好地对地物本质特征进行提取,分类效果较好,具有更高的分类精度[17⇓-19]。
广东省是海洋大省,海水养殖业在其沿海地区海洋经济中占据重要地位。但由于海水养殖主要是自发行为,分布较为分散,不利于海域管理。因此,摸清广东省海水养殖区现状,掌握海水养殖区变化趋势,对于提高广东省海域管理水平,优化其海洋产业结构具有重要意义。鉴于此,本文使用U-Net模型作为深度学习模型,开展广东省沿海区域的多时相海水养殖区识别,并进行海水养殖区空间分布及面积变化分析,以了解广东省海水养殖区变化趋势,揭示广东省海水养殖区的时空格局特征。
1 研究区及数据源
1.1 研究区概况
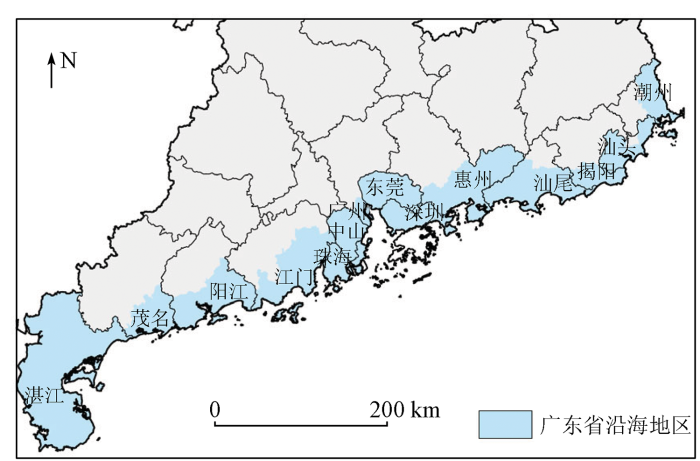
广东省地处中国大陆最南部,东西跨度约800 km,其大陆海岸线东起南澳县南澎列岛的赤仔屿,西至雷州市纪家镇的良坡村,全长约为4 114 km,约占全国大陆海岸线总长的1/4,居全国第一位。此外,广东省属东亚季风区,水热条件优越,为海水养殖业提供优越的先天条件。本研究区包括广东省大陆海岸线所覆盖的14个城市(潮州、汕头、揭阳、汕尾、惠州、深圳、东莞、广州、中山、珠海、江门、阳江、茂名、湛江),共计40个区县单元,海水养殖区的最远距离距海岸线10 km(图1)。
图1
1.2 数据源与预处理
本文所使用的数据包括Landsat系列多光谱遥感影像、行政边界、大陆海岸线和海岛海岸线等。其中,所使用的Landsat 系列多光谱遥感影像,空间分辨率为30 m,下载于美国地质勘探局网站。本文研究期为1998—2021年,其中1998年、2002年、2006年以及2010年使用Landsat5 TM影像,2014年、2018年以及2021年使用Landsat8 OLI影像。此外,考虑影像云覆盖量及数据可获取性[20],各年份的多光谱遥感影像分别收集于当年9—11月。此外,在对Landsat遥感影像的数据预处理过程中,需要进行辐射定标、大气校正、影像镶嵌和图像裁剪等步骤,以获得覆盖研究区域的多时相遥感影像。其中,辐射定标用以保证传感器获取遥感数据的准确性。大气校正用以消除大气和光照等因素对地物反射的影响。
2 研究方法
本文选用U-Net模型作为广东省海水养殖区深度学习提取模型。首先,基于高分辨率遥感影像(无人机遥感影像及高分遥感影像)和实地调研采集数据,绘制海水养殖区样本,以此构建海水养殖区标准样本库。其次,基于ArcGIS Pro 2.8软件内深度学习模块中的U-Net模型,开展海水养殖区解译模型训练与分类,并要求海水养殖区的原始分类精度不小于90%,优化后模型分类精度不低于95%。若模型分类效果低于预期,则重新训练解译模型以达到模型优化效果。最后,对数据进行分类后处理,通过精度验证、人工校正和数据格式转换等步骤,获取海水养殖区的识别结果。
2.1 U-Net模型结构
U-Net网络结构如图2所示,U-Net模型网络左侧为收缩路径,右侧为扩张路径,呈现出对称结构。左侧收缩路径是一个典型的CNN结构,由多组结构相同的收缩块结构组成,每一收缩块结构依次为连续2组卷积核大小 3×3 的卷积操作(padding=0),每次卷积之后跟随 ReLU 激活函数,2组卷积之后为一窗口大小为 2×2、滑动步长为 2 的最大池化操作对特征图进行下采样。每一组收缩块实现将特征图尺寸缩小的同时,也使得特征图维度扩增一倍。右侧扩张路径由多组结构相同的扩张块结构组成,每一扩张块结构依次为连续2组卷积核大小 3×3 的卷积操作(padding=0),每次卷积之后跟随 ReLU激活函数,2组卷积之后为一卷积核大小为 2×2 的反卷积操作实现对特征图的放大。每一扩张块实现将特征图尺寸扩大的同时,也使得特征图维度减少一半[25⇓-27]。
图2
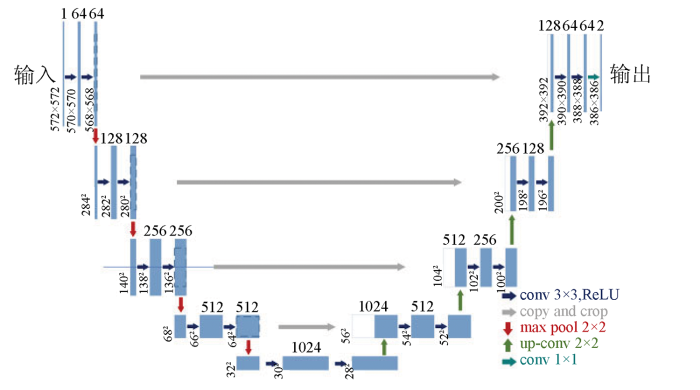
同时,每一扩张块的输出特征图将和其同一层的收缩块输出相结合,并进入下一扩张块。由于整个网络中卷积操作的padding=0,导致同一层次的收缩块输出比扩张块输出大,对二者进行融合时会首先对收缩块输出特征图进行裁剪操作,使其与扩张块输出尺寸相同。通过对深层特征图进行反卷积扩张到浅层特征图尺寸,并与浅层特征图融合后,通过卷积操作提取到结合了上下文信息的特征,右侧路径逐层连接左侧低维特征,最终输出为原始尺寸。
2.2 模型样本库构建
样本的精确绘制和数量对于深度学习任务,即训练优质的深度学习模型至关重要。由于卷积神经网络是逐像素进行学习的,最终得到的结果也是基于像素尺度,所以标注样本时必须要精准,准确的人工标记是模型训练的基础和关键。本文利用ArcGIS Pro 2.8软件,结合高分辨率遥感影像和现场调查结果,对遥感影像中的海水养殖区样本(围海养殖区以及开放式网箱养殖区)进行人工标记。样本范围覆盖广东省沿海各市,样本数量共计2 000个,其中围海养殖区样本数为1 500个,开放式网箱养殖区样本数为500个。本文将海水养殖区的属性设为 1,将背景及其他地物的属性设为 0。同时,在海水养殖区样本标注过程中,尽可能地放大遥感影像,减少不必要的错误标记,以提高样本标记准确率。
2.3 海水养殖区图斑解译
海水养殖区图斑解译依托于ArcGIS Pro 2.8软件的深度学习工具集展开,其是利用神经网络中的多个图层来检测影像中的要素。解译思路可分为导入训练样本、训练深度学习模型以及使用深度学习模型分类要素3个阶段。
首先,导入训练样本。输入遥感影像与标注样本数据,以生成海水养殖区的分类片段,并转换为深度学习所需要的训练数据集。其次,基于上述导入的训练数据集,训练海水养殖区解译模型。同时,通过迭代不同年份海水养殖区样本数据集,以提升解译模型的精度,优化模型解译效果。最后,使用深度学习模型解译,即通过运行上述模型训练后的海水养殖区解译模型生成海水养殖区分类栅格,得到海水养殖区分类图斑。
分类后处理首先依次对海水养殖区分类图斑进行先腐蚀后膨胀的图像操作; 然后,将栅格数据格式的识别结果转化为矢量数据格式; 最后,对识别结果进行检验与修正,剔除错分的海水养殖区图斑,补充绘制不完整的海水养殖区图斑或未分类图斑。
由于经过模型解译的海水养殖区图斑中存在一些孤立的噪声点。因此,为了使模型解译的结果更加精确,对分类图斑使用数学形态学运算进行腐蚀操作,将检测出的过小海水养殖区图斑移除,以消除小且无意义的孤立区域。同时,对于海水养殖区图斑中存在边界不平滑,或内部具有细小空洞的情况,则使用数学形态学运算进行膨胀操作,将与海水养殖区接触的所有背景点合并到物体中,使边界向外扩张,向内填充缺失值。此外,还需对矢量化后的海水养殖区图斑进行检验与修正,即通过目视修改去除误分类别、修正错分类别。人工检验与修正遵循总体观察、综合分析、对比分析、观察方法正确、尊重影像的客观实际等原则,剔除错分的海水养殖区图斑,补充未分类的海水养殖区图斑,修正未完全分类的海水养殖区图斑。
3 结果与分析
3.1 精度评价
选用U-Net模型作为广东省海水养殖区深度学习解译模型,初次提取精度达到95.3%以上,初次分类结果经过人工修正后分类准确率得到进一步提升。同时,将U-Net模型与基于遗传算法的K均值(K-Means)聚类分析和DBN进行比较,具体结果如图3所示。通过图3可知,K-Means聚类分析、DBN和U-Net这3种分类方法均能识别出海水养殖区的大致轮廓,但是在检测精度上存在较大差异。K-Means聚类分析法对海水养殖区图斑解译识别率较低,容易将颜色相近的海域错误识别为海水养殖区。DBN对海水养殖区识别产生的结果较为破碎,并且和K-Means聚类分析法有同样问题,即易受海水、沿岸建筑物阴影等其他物体干扰,误识率较高。U-Net模型中因为包含特征融合结构,总体解译结果较好。
图3
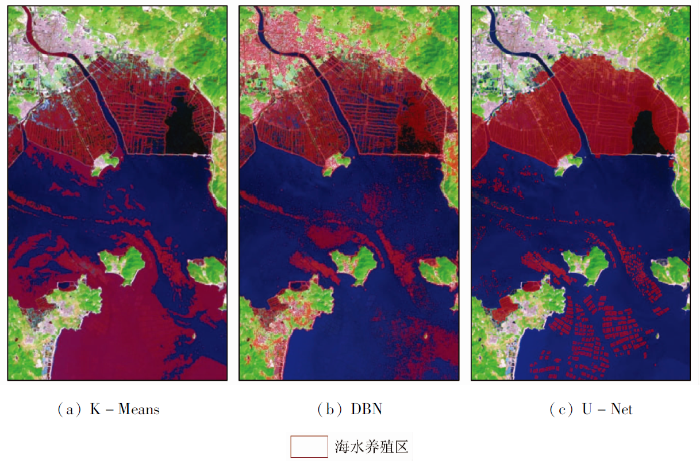
图3
3类模型识别海水养殖区对比
Fig.3
Comparison of three types of models to identify mariculture areas
在时效性方面,对于同一景遥感影像进行海水养殖区解译,上述3个模型所耗费的时间分别为: 0.62 h,6.8 h以及1.75 h。K-Means耗时最短,而DBN耗时最长。为比较使用各模型识别出的海水养殖区识别精度,在研究区内选取1 000个随机样本点,并使用高分辨率遥感影像将样本点标记为海水养殖区和非海水养殖区,以计算Kappa系数(表征样本点识别情况与样本真实属性的一致性)。在结果准确性方面,使用上述3个模型识别出海水养殖区的Kappa系数分别为: 0.557,0.486以及0.843。基于U-Net模型识别的海水养殖区具有最高的Kappa系数。
综上,3类解译模型中,以U-Net模型分类效果最佳,调查中的海水养殖区主要区域基本能识别; DBN的识别结果虽然基本能识别主要海水养殖区,但存在图斑分类效果过于破碎的缺点; K-Means分类速度最快,但是模型的错分率和漏分率最高。因此,U-Net模型最适用于对广东省海水养殖区进行解译,具有较高的解译精度,同时解译结果中海水养殖区与其他地物的分割较为清楚,海水养殖区斑块破碎化程度较低,解译结果不易受其他物体的干扰,在视觉效果上更接近真实值。
3.2 长时间序列海水养殖区图斑识别
对广东省海水养殖区开展大范围长时间序列遥感解译。此外,将2008年修测的大陆海岸线与2019年补充修测的海岛海岸线以外的区域作为海水养殖区提取范围的主要依据。基于此,对遥感解译后的海水养殖区识别结果进行提取,最终获得广东省1998—2021年海水养殖区图斑数据(表1)。根据广东省海水养殖区识别结果,1998年、2002年、2006年、2010年、2014年、2018年和2021年广东省海水养殖区总面积分别为47 954 hm2,48 741 hm2,55 209 hm2,51 884 hm2,52 446 hm2,50 943 hm2和495 02 hm2。
表1 1998—2021年广东省海水养殖区分布
Tab.1
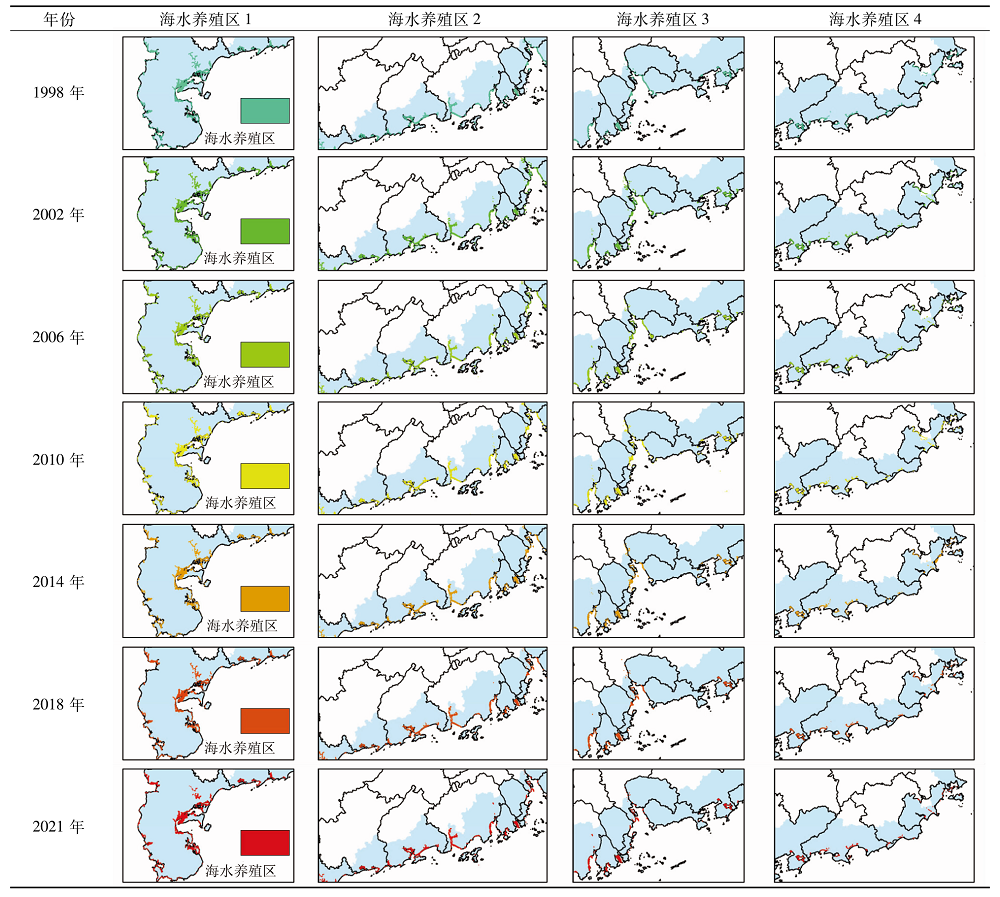 |
近23 a来,广东省海水养殖区主要集中分布在广东省西侧区域,而海岸线东侧区域的海水养殖区分布较少。广东省海水养殖区面积最大的城市分别为湛江市、江门市、阳江市和珠海市,而潮州市、东莞市和揭阳市的海水养殖区面积较小。其中,2021年湛江市海水养殖区面积占全省比重超过50%,湛江市、江门市、阳江市和珠海市等4个城市的海水养殖区面积总和占全省海水养殖区的比重达90%。总体而言,广东省海水养殖区变化幅度较小,但空间分布不均匀。
3.3 海水养殖区面积变化趋势
开展海水养殖区面积趋势性分析助力于把握研究区内海水养殖区的面积增减的变化趋势。根据广东省全海域多年份海水养殖区数据,进行空间叠置,最终得到广东省沿海城市的海水养殖区历年面积统计数据(表2)。
表2 1998—2021年广东省沿海城市海水养殖区面积统计
Tab.2
| 城市 | 1998年 | 2002年 | 2006年 | 2010年 | 2014年 | 2018年 | 2021年 |
|---|---|---|---|---|---|---|---|
| 潮州 | 130 | 87 | 20 | 49 | 43 | 46 | 16 |
| 汕头 | 646 | 495 | 479 | 688 | 1743 | 547 | 317 |
| 揭阳 | 64 | 93 | 93 | 160 | 103 | 140 | 92 |
| 汕尾 | 827 | 797 | 1 014 | 1 054 | 1 076 | 1 009 | 836 |
| 惠州 | 1 152 | 1 569 | 1 531 | 1 462 | 1 399 | 1 228 | 1 337 |
| 深圳 | 1 814 | 2 186 | 2 557 | 1 210 | 887 | 699 | 143 |
| 东莞 | 110 | 150 | 42 | 70 | 144 | 58 | 23 |
| 广州 | 19 | 225 | 137 | 99 | 215 | 557 | 597 |
| 中山 | 783 | 847 | 956 | 1 660 | 1 066 | 745 | 242 |
| 珠海 | 3 103 | 3 282 | 3 101 | 4 272 | 3 535 | 3 949 | 3 758 |
| 江门 | 6 050 | 7 339 | 8 506 | 7 588 | 7 938 | 7 684 | 7 567 |
| 阳江 | 5 880 | 5 567 | 7 163 | 6 579 | 6 658 | 6 982 | 6 632 |
| 茂名 | 1 032 | 1 305 | 1 378 | 1 680 | 1 427 | 1 114 | 1 317 |
| 湛江 | 26 344 | 24 798 | 28 232 | 25 317 | 26 211 | 26 187 | 26 626 |
根据结果可知,1998—2006年间广东省海水养殖区面积总体为正向增长趋势,2006—2021年期间广东省海水养殖区面积表现为波动下降趋势。整体上,广东省海水养殖区面积数值变化幅度较小,海水养殖区总面积位于47 954~ 55 209 hm2区间。基于海水养殖区历年面积统计与海水养殖区时空分布结果可知,广东省海水养殖区空间分布不均衡,主要聚集于广东省西侧区域,即湛江市、阳江市和江门市,而广东省东侧区域海水养殖区分布较少。广东省各城市海水养殖区面积可分为3个梯队,第一梯队为海水养殖区面积超过25 000 hm2的城市,即湛江市; 第二梯队为海水养殖区面积位于5 000~10 000 hm2的城市,即江门市和阳江市; 第三梯队为海水养殖区面积小于5 000 hm2的城市,即广东省其余沿海城市。广东省各城市海水养殖区面积未发生显著变动,1998—2021年各城市海水养殖区各梯队内城市也未发生变化。
然而,广东省各城市海水养殖区面积比重在不同年份略有差异,不同区域的海水养殖区面积变化也呈现出特定规律。例如,在1998—2021年期间,位于珠三角的深圳市、东莞市和中山市海水养殖区面积萎缩趋势明显。其中,深圳市海水养殖区面积减少最为显著,海水养殖区面积从1998年的1 814 hm2锐减至2021年的143 hm2。然而,与此同时,同样位于珠三角区域的广州市海水养殖区面积却呈现上升趋势。
同时,为分析研究时段内海水养殖区的年均变化强度,对海水养殖区动态度进行统计(表3)。
表3 1998—2021年广东省沿海城市海水养殖区动态度统计
Tab.3
| 城市 | 1998— 2002年 | 2002— 2006年 | 2006— 2010年 | 2010— 2014年 | 2014— 2018年 | 2018— 2021年 |
|---|---|---|---|---|---|---|
| 潮州 | -8.3 | -19.3 | 36.3 | -3.1 | 1.7 | -21.7 |
| 汕头 | -5.8 | -0.8 | 10.9 | 38.3 | -17.2 | -14.0 |
| 揭阳 | 11.3 | 0.0 | 18.0 | -8.9 | 9.0 | -11.4 |
| 汕尾 | -0.9 | 6.8 | 1.0 | 0.5 | -1.6 | -5.7 |
| 惠州 | 9.0 | -0.6 | -1.1 | -1.1 | -3.1 | 3.0 |
| 深圳 | 5.1 | 4.2 | -13.2 | -6.7 | -5.3 | -26.5 |
| 东莞 | 9.1 | -18.0 | 16.7 | 26.4 | -14.9 | -20.1 |
| 广州 | 271.1 | -9.8 | -6.9 | 29.3 | 39.8 | 2.4 |
| 中山 | 2.0 | 3.2 | 18.4 | -8.9 | -7.5 | -22.5 |
| 珠海 | 1.4 | -1.4 | 9.4 | -4.3 | 2.9 | -1.6 |
| 江门 | 5.3 | 4.0 | -2.7 | 1.2 | -0.8 | -0.5 |
| 阳江 | -1.3 | 7.2 | -2.0 | 0.3 | 1.2 | -1.7 |
| 茂名 | 6.6 | 1.4 | 5.5 | -3.8 | -5.5 | 6.1 |
| 湛江 | -1.5 | 3.5 | -2.6 | 0.9 | 0.0 | 0.6 |
根据表3可知广东省及其各城市各时间段内海水养殖区面积的变化强度。其中,在1998—2002年期间,广东省海水养殖区主要呈增长趋势,其中广州市海水养殖区面积增加最快,其动态度达271.1%,其海水养殖区主要增加在南沙区万顷沙镇区域。2002—2006年期间,珠三角区域海水养殖区呈明显的下降趋势,而其他区域海水养殖区普遍增加。2006—2010年广东省海水养殖区总体表现为减少趋势,该时间段内深圳市海水养殖区的下降程度最高,变化动态度为-13.2%。2010—2014年广东省海水养殖区总体上为增加趋势,其中汕头市海水养殖区变化动态度为38.3%,为广东省海水养殖区增加强度最大的区域。2014—2018年广东省海水养殖区主要表现为下降趋势,该时间段内海水养殖区减少区主要集中在广东省珠三角城市以及东部沿海城市,即东莞市、潮州市、汕头市、深圳市以及中山市,而广东省西部沿海城市海水养殖区主要表现为轻微增长趋势。
3.4 海水养殖区空间格局特征
图4
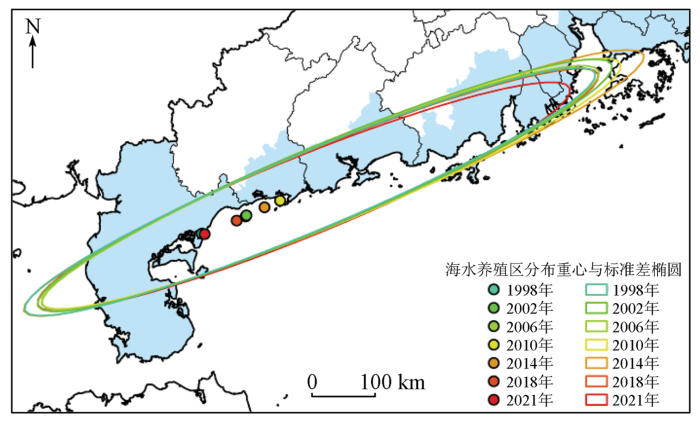
图4
1998—2021年广东省海水养殖区空间格局
Fig.4
Spatial pattern of mariculture areas in Guangdong from 1998 to 2021
由图4可知,广东省海水养殖区分布重心在茂名市与湛江市海域内往复移动。其中,广东省海水养殖区分布重心在1998—2002年向东北方向快速移动,移动距离达40.29 km。而后2002—2006年其分布重心变化不明显,仅往西南方向轻微移动1.08 km。2006—2010年海水养殖区重心重新恢复向东北方向移动,移动距离为31.54 km。而2010—2021年广东省海水养殖区重心逐年向西南方向移动,移动距离分别为14.09 km,25.67 km和29 km。由此得知,1998—2002年与2006—2010年期间,广东省东部沿海城市海水养殖区增速较快,2002—2006年广东省各区域总体海水养殖区变化较为均衡,而2010—2021年期间,广东省海水养殖区主要集中在广东省海岸线西侧,即湛江市和茂名市。
基于1998—2021年广东省海水养殖区标准差椭圆参数的对比分析可知,近23 a来,广东省海水养殖区标准差椭圆分布趋势变化较小,空间格局总体变化不大。广东省海水养殖区标准差椭圆在西南—东北方向延伸趋势较其他方向明显,主要覆盖广东省海岸线西侧的大部分海水养殖区。由此可知,广东省海水养殖区总体上集中在湛江市、茂名市和阳江市等西部沿海城市,而东部沿海城市分布较少。同时,广东省海水养殖区在空间范围上呈现出1998—2014年向外扩张,2014—2021年向内收缩的趋势。
4 结论与讨论
本研究基于多时相Landsat TM/OLI遥感影像,选用U-Net卷积神经网络作为深度学习解译模型,识别1998—2021年广东省沿海城市海水养殖区,得出以下研究结论:
1)相较于K-Means聚类分析和深度信念网络等网络模型,U-Net模型更加适用于对广东省海水养殖区的解译,具有较高的解译精度,同时解译结果中海水养殖区与其他地物的分割较为清楚,海水养殖区斑块破碎化程度较低。
2)广东省海水养殖区空间分布不均,主要集中分布在广东省西侧区域,而海岸线东侧区域的海水养殖区分布较少,湛江、江门、阳江与珠海等4个城市的海水养殖区面积总和占全省比重达90%。
3)广东省各城市海水养殖区面积可分为3个梯队,且变化幅度较小,保持相对稳定状态,但各城市海水养殖区面积比重在不同年份略有差异,不同区域的海水养殖区面积变化也呈现出特定规律。
4)广东省海水养殖区标准差椭圆分布趋势变化较小,空间格局总体变化不大,但海水养殖区在空间范围上呈现出1998—2014年向外扩张、2014—2021年向内收缩的趋势。
但受影像数据质量限制,本研究未对海水养殖区进行类型划分。而沿海地区的海水养殖区包含围海养殖以及开放式网箱养殖等类型。当前,高分系列等高分辨率遥感影像日益丰富,并且无人机遥感已得到大规模应用。因此,在后续研究中将考虑使用不同类型及不同空间分辨率的遥感影像数据。一方面,通过使用多源遥感影像进行识别,提高所用深度学习模型对海水养殖区提取的鲁棒性。另一方面,后续研究将对不同海水养殖类型(围海养殖和开放式网箱养殖等)进行全面识别,以实现对研究区海水养殖产业发展趋势的综合评价。
参考文献
中国海水养殖业绿色发展:水平测度、区域对比及发展对策研究
[J].
Green development of mariculture in China:Estimation,regional comparison and research on development strategy
[J].
高质量发展要求下我国海水养殖业竞争力评价
[J].
Competitiveness evaluation of China’s mariculture industry under the requirements of high-quality development
[J].
基于灰色预测模型的我国海洋渔业发展趋势研究
[J].
Study on development of China’s marine fisheries based on GM (1,1) model
[J].
改进型双支网络模型的遥感海水网箱养殖区智能提取方法
[J].
An improved double-branch network method for intelligently extracting marinecage culture area
[J].
Global estimation of areas with suitable environmental conditions for mariculture species
[J].
Spatio-temporal features of microplastics pollution in macroalgae growing in an important mariculture area,China
[J].DOI:10.1016/j.scitotenv.2020.137490 URL [本文引用: 1]
基于Landsat8数据的近海养殖区自动提取方法研究
[J].
Research on automatic extraction method for coastal aquaculture area using Landsat8 data
[J].
基于自然区块的城市热环境空间分异性研究
[J].
DOI:10.18306/dlkxjz.2019.12.010
[本文引用: 1]

通过有效解决建设用地子类划分,实现定量评价城市热环境的空间分异性,对改善城市生态环境、实现城市化的健康发展具有重要的意义和科学价值。论文以广州市为例,参考自然城市的概念,基于5类兴趣点(Point Of Interest,POI)开放数据,结合城市建设用地分类标准,构建5类自然区块;在Landsat 8遥感影像地表温度反演的基础上,计算分析自然区块下地表热场等级分布格局、热场平均值及热环境足迹范围,以对城市热环境空间分异性进行评价。研究表明:① 自然区块的构建,能准确地反映各类POI数据空间分布情况,能够实现对建设用地子类型的划分;② 5类自然区块内部地表热场等级均以高温像元为主,但等级分布具有显著差异。同时,自然区块的热场平均值由高到低的排序为:工业区块>商业服务业区块>交通与道路区块>居住区块>公共管理与服务区块;③ 自然区块形成的高温集聚区,存在热量扩散现象,实际影响范围大于其物理边界,5类自然区块的热环境足迹范围具有分异性。热环境足迹影响范围由大到小排序为:工业区块>商业服务业区块>居住区块>道路与交通区块>公共管理与服务区块。研究结果可为微观尺度上分析城市热环境、改善城市生态环境、实现城市化的健康发展提供科学依据。
Spatial variability of urban thermal environment based on natural blocks
[J].
DOI:10.18306/dlkxjz.2019.12.010
[本文引用: 1]
Addressing the issue of subdivision of construction land for quantitative evaluation of spatial variability of urban thermal environment is of great significance for improving the ecological environment of cities and realizing the healthy development of urban areas. In this study, we used Landsat 8 remote sensing imageries to retrieve the surface temperature data of Guangzhou City. Based on the concept of natural city combined with the classification standard of urban construction land, we identified five types of natural blocks based on the open data of point of interest (POI). On this basis, the distribution pattern of land surface heat field levels, thermal field average value of natural blocks, and thermal environment footprint range were calculated and analyzed to evaluate the spatial variability of the urban thermal environment of the city. The results show that: 1) The identification of natural blocks may accurately reflect the spatial distribution of all kinds of POI and realize a meaningful division of the sub-types of construction land. 2) Land surface heat field in the five types of natural blocks was dominated by high temperature pixels (more than 90%), and the distribution range of low temperature pixels is small (less than 1%). But the distribution of the heat field levels was significantly different across the natural blocks. In the residential, road and traffic, and public management and service natural blocks, the proportion of land surface heat field levels was similar; the proportion of mesothermal pixels in the commercial and services natural block was less than half of the above three types of natural blocks. The proportion of high temperature pixels in the industrial natural block was the highest, reaching 99%, and there was no low temperature pixel. The order of thermal field average value of natural blocks from high to low is: industrial natural block > commercial and services natural block > road and traffic natural block > residential natural block > public management and service natural block. 3) Heat diffusion exists in the high temperature agglomeration area formed by natural blocks, and the actual influence range is larger than its physical boundary. The thermal environment footprint range of the five types of natural blocks was different. The thermal environment footprint of industrial natural block was the widest, and the 6th ring buffer zone was still in the scope of impact. While the thermal environment footprint of public management and service natural block only affects the 2nd ring buffer zone, compared with the other four types of natural blocks, the effect of heat diffusion was not significant. The influence range of thermal environment footprint from large to small is: industrial natural block > commercial and services natural block > residential natural block > road and traffic natural block > public management and service natural block. The result of this study may provide some scientific basis for the analysis of urban thermal environment, the improvement of urban ecological environment, and the healthy development of urbanization.
基于无人机低空遥感和现场调查的潮滩地形反演研究
[J].
Inversion of tidal flat topography based on unmanned aerial vehicle low-altitude remote sensing and field surveys
[J].
面向对象的池塘养殖用海信息提取
[J].
Object-oriented information extraction of pond aquaculture
[J].
Extraction of coastal raft cultivation area with heterogeneous water background by thresholding object-based visually salient NDVI from high spatial resolution imagery
[J].DOI:10.1080/2150704X.2018.1468103 URL [本文引用: 1]
三沙湾海水养殖区时空动态变化及其影响因素
[J].
Spatiotemporal dynamics of mariculture area in Sansha Bay and its driving factors
[J].
基于关联规则面向对象的海岸带海水养殖模式遥感识别
[J].
Remote sensing identification of coastal zone mariculture modes based on association-rules object-oriented method
[J].
Extraction of offshore aquaculture areas from medium-resolution remote sensing images based on deep learning
[J].DOI:10.3390/rs13193854 URL [本文引用: 2]
Recurrent residual U-Net for medical image segmentation
[J].
Multi-temporal SAR data large-scale crop mapping based on U-Net model
[J].DOI:10.3390/rs11010068 URL [本文引用: 1]
Extracting raft aquaculture areas from remote sensing images via an improved U-Net with a PSE structure
[J].DOI:10.3390/rs11172053 URL [本文引用: 1]
U-Net:Deep learning for cell counting,detection,and morphometry
[J].DOI:10.1038/s41592-018-0261-2 URL [本文引用: 1]
深度学习U-Net方法及其在高分辨卫星影像分类中的应用
[J].
U-Net neural networks and its application in high resolution satellite image classification
[J].
人口空间化下公共医疗服务水平匹配度评价——以广州市为例
[J].
Evaluation of the matching degree of public medical service level based on population spatialization:A case study of Guangzhou
[J].
Towards better exploiting convolutional neural networks for remote sensing scene classification
[J].DOI:10.1016/j.patcog.2016.07.001 URL [本文引用: 1]
Multilabel remote sensing image retrieval based on fully convolutional network
[J].DOI:10.1109/JSTARS.2019.2961634 URL [本文引用: 1]
Large-scale palm tree detection in high resolution satellite images using U-Net
[J].DOI:10.3390/rs11030312 URL [本文引用: 1]
Small waterbody extraction with improved U-Net using Zhuhai-1 hyperspectral remote sensing images
[J].
Computer vision-based concrete crack detection using U-Net fully convolutional networks
[J].DOI:10.1016/j.autcon.2019.04.005 URL [本文引用: 1]
DENSE-Inception U-Net for medical image segmentation
[J].DOI:10.1016/j.cmpb.2020.105395 URL [本文引用: 1]
MultiResUNet:Rethinking the U-Net architecture for multimodal biomedical image segmentation
[J].
DOI:S0893-6080(19)30250-3
PMID:31536901
[本文引用: 1]
In recent years Deep Learning has brought about a breakthrough in Medical Image Segmentation. In this regard, U-Net has been the most popular architecture in the medical imaging community. Despite outstanding overall performance in segmenting multimodal medical images, through extensive experimentations on some challenging datasets, we demonstrate that the classical U-Net architecture seems to be lacking in certain aspects. Therefore, we propose some modifications to improve upon the already state-of-the-art U-Net model. Following these modifications, we develop a novel architecture, MultiResUNet, as the potential successor to the U-Net architecture. We have tested and compared MultiResUNet with the classical U-Net on a vast repertoire of multimodal medical images. Although only slight improvements in the cases of ideal images are noticed, remarkable gains in performance have been attained for the challenging ones. We have evaluated our model on five different datasets, each with their own unique challenges, and have obtained a relative improvement in performance of 10.15%, 5.07%, 2.63%, 1.41%, and 0.62% respectively. We have also discussed and highlighted some qualitatively superior aspects of MultiResUNet over classical U-Net that are not really reflected in the quantitative measures.Copyright © 2019 Elsevier Ltd. All rights reserved.
