

0 引言
传统的土壤盐渍化监测需土壤采集和实验室测定,耗时费力。遥感技术的发展弥补了传统手段的缺陷,遥感技术凭借其独特优势被广泛应用于土壤盐渍化监测[5-6]。最便捷的土壤盐渍化反演多是采用相关的遥感光谱指数或构建遥感盐分监测指数模型对其评价,常用光谱指数有盐分指数(salinity index,SI)、归一化植被指数(normalized difference vegetation index,NDVI)、修改型土壤调节植被指数(modified soil - adjusted vegetation index,MSAVI)、地表反照率(Albedo)、土壤亮度指数(brightness Index,BI)等[7⇓⇓⇓⇓-12]。新疆干旱区土壤盐渍化研究的热点区域主要集中在流域[13⇓-15]和垦区[16-17]等地,研究方法为光谱指数构建遥感盐分监测指数(salinization detection index,SDI)模型,NDVI和SI构建遥感盐分监测指数模型能有效的反演其塔里木南缘于田绿洲土壤盐渍化[18]; MSAVI和SI构建的遥感盐分监测指数模型可作为玛纳斯河流域灌区土壤盐渍化信息提取指标[19]; Albedo与MSAVI构建遥感盐分监测指数模型能够较好地反映渭库绿洲土壤盐渍化情况[20]。因此,通过构建遥感盐分监测指数模型能较好反演干旱区土壤盐渍化信息。
以阿拉尔垦区Landsat8 OLI遥感影像数据和野外实测数据为基础,基于NDVI,Albedo,MSAVI和SI构建4类SDI1(SI-NDVI),SDI2(SI-MSAVI),SDI3(SI-Albedo)和SDI4(Albedo-MSAVI)遥感盐分监测指数模型,探究反演阿拉尔垦区土壤盐渍化最优遥感盐分监测指数模型,为垦区精准治理土壤盐渍化提供科学依据。
1 材料与研究方法
1.1 研究区概况
图1
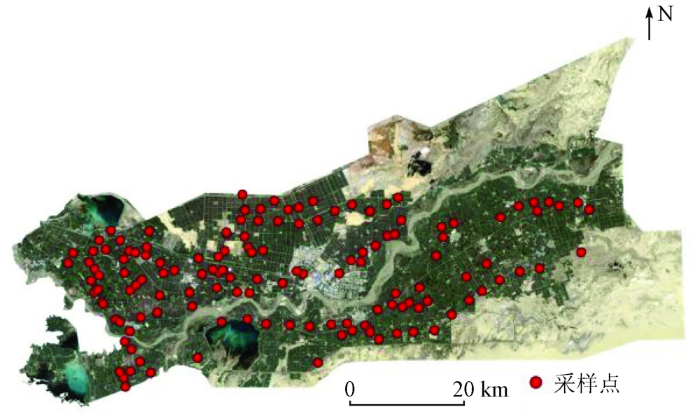
图1
阿拉尔垦区概况及采样点分布
Fig.1
General situation and sampling point distribution of Alar reclamation area
1.2 数据来源
1.3 数据处理
遥感影像数据经过几何纠正、辐射定标、大气校正等预处理后裁剪得到研究区影像图,为避免水体和无植被覆盖的沙地对提取精度造成干扰,故利用归一化土壤湿度指数(normalized difference moisture index,NDMI)和SWIR波段对研究区水体和沙地掩模去除[25]。
将土壤样品按标准规定在烘箱105 ℃烘干8 h,将烘干后同一样点的3份样品磨碎均匀混合为1份,剔除土壤中的植物根系、石子等后过2 mm筛,取蒸馏水100 ml,按水土比例5∶1配置溶液,充分均匀搅动后静止放置5~6 h过滤,用上海科佑电导仪DDS-11A测定土壤电导率。
1.4 光谱指数及模型
表1 遥感光谱指数及模型
Tab.1
1.5 归一化处理
由于每个指数的量纲不同,为了消除不同变量的数据之间单位和数量级差异性带来的影响,在其建立遥感盐分监测指数模型之前对各指数归一化处理[24],公式为:
式中:
2 结果与分析
2.1 二维散点图
图2
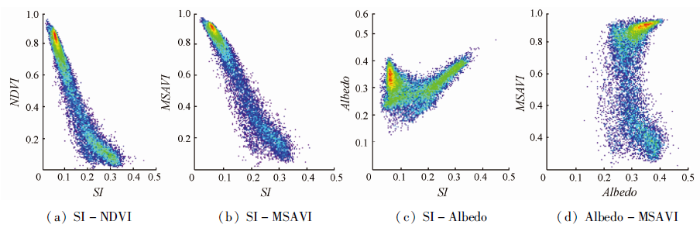
表2 二维散点图模型拟合性
Tab.2
| 二维散 点图 | 光谱指数拟合公式 | 拟合度 |
|---|---|---|
| SI- NDVI | 线性: Y=0.942 6-3.063X 二次: Y=1.165 1-6.570X+9.859 7X2 几何: Y=-2.918X0.2594+2.201 5 双曲: Y=1.0/(0.425 2+14.226X) 对数: Y=-0.670 2-1.565lgX-0.297 7lg(X)2 | R2=0.867 7 R2=0.929 6 R2=0.915 3 R2=0.872 4 R2=0.916 5 |
| SI- MSAVI | 线性: Y=1.053 5-3.087X 二次: Y=1.198 9-5.384X+6.475 4X2 几何: — 双曲: Y=1.0/(0.550 6+9.570 0X) 对数: Y=-0.834 3-2.241lgX-0.677 6lgX2 | R2=0.888 6 R2=0.914 3 — R2=0.859 0 R2=0.909 7 |
| SI- Albedo | 线性: Y=0.282 8+0.185 9X 二次: Y=0.363 2-1.085X+3.583 5X2 几何: — 双曲: Y=1.0/(3.556 1-2.169X) 对数: — | R2=0.097 5 R2=0.336 1 — R2=0.115 3 — |
| Albedo- MSAVI | 线性: Y=0.677 6-0.237 9X 二次: Y=-0.800 5+9.844 8X-16.65X2 几何: Y=0.254 5X-0.064 5+0.3284 双曲: Y=1.0/(1.500 1+0.504 1X) 对数: Y=-1.022-6.013lgX-5.416lgX2 | R2=0.001 9 R2=0.050 5 R2=0.000 2 R2=0.001 5 R2=0.033 3 |
2.2 盐分反演
表3 阿拉尔垦区土壤盐渍化分类
Tab.3
| 模型 | 非盐渍土 | 轻度盐渍土 | 中度盐渍土 | 重度盐渍土 | 盐土 |
|---|---|---|---|---|---|
| SDI1 | <0.27 | [0.27,0.46) | [0.46,0.67) | [0.67,0.85) | ≥0.85 |
| SDI2 | <0.21 | [0.27,0.40) | [0.46,0.62) | [0.62,0.80) | ≥0.80 |
| SDI3 | <0.13 | [0.13,0.18) | [0.18,0.24) | [0.24,0.30) | ≥0.30 |
| SDI4 | >1.09 | [0.97,1.09) | [0.85,0.97) | [0.74,0.85) | ≤0.74 |
图3
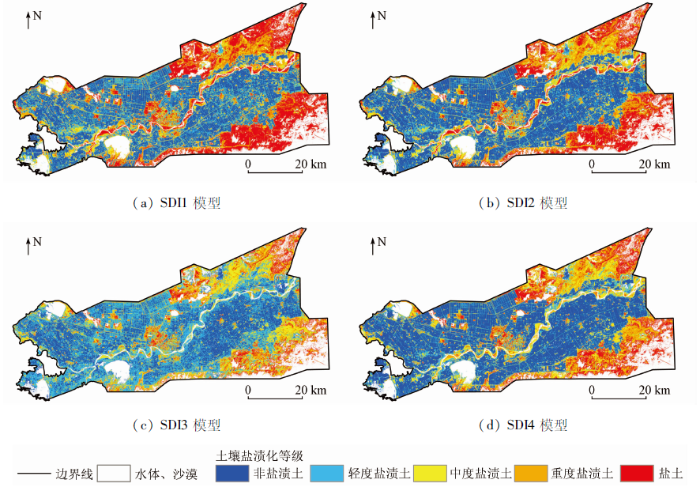
图3
不同模型下的阿拉尔垦区土壤盐渍化等级分布
Fig.3
Distribution of soil salinization grade in Alar Reclamation Area under different models
由图3可知,遥感盐分监测指数模型SDI1和SDI2反演阿拉尔垦区土壤盐分以轻度盐渍土、非盐渍土为主,中度盐渍土、重度盐渍土和盐土主要分布在垦区的东北、东南地区。遥感盐分监测指数模型SDI3反演阿拉尔垦区土壤盐分则以轻度盐渍土和中度盐渍土为主,重度盐渍土少量分布在垦区的东北、东南地区,盐土在垦区几乎无分布。遥感盐分监测指数模型SDI4反演阿拉尔垦区土壤盐分以非盐渍土为主,中度盐渍土和重度盐渍土主要分布在垦区的东北、东南地区,较SDI2模型差异在于重度盐渍土和盐土的分布较少4类遥感盐分监测指数模型在一定程度上都有所差异,因此对模型进行精度验证,选取反演精度较高的遥感盐分监测指数模型是十分必要的。
2.3 精度评价
表4 模型样点精度验证
Tab.4
| 模型 | 样点分 类正确 | 样点分类错误 | 总体精 度/% | |||||
|---|---|---|---|---|---|---|---|---|
| 非盐 | 轻度 | 中度 | 重度 | 盐土 | 共计 | |||
| SDI1 | 116 | 10 | 2 | 6 | 3 | 2 | 23 | 83.45 |
| SDI2 | 97 | 6 | 6 | 16 | 6 | 8 | 42 | 69.78 |
| SDI3 | 74 | 35 | 3 | 14 | 6 | 7 | 65 | 53.23 |
| SDI4 | 100 | 3 | 6 | 18 | 6 | 6 | 39 | 71.94 |
图4
由表4可知,利用遥感盐分监测指数模型反演阿拉尔垦区土壤盐分,SDI1模型样点分类正确个数较多,SDI3模型样点分类正确个数较少,SDI1模型、SDI2模型、SDI3模型、SDI4模型总体精度分别为83.45%,69.78%,53.23%和71.94%。样点分类错误中,SDI1模型样点分类错误主要为非盐渍土,SDI2模型样点分类错误主要为中度盐渍土,SDI3模型样点分类错误主要为非盐渍土,SDI4模型样点分类错误主要为中度盐渍土。
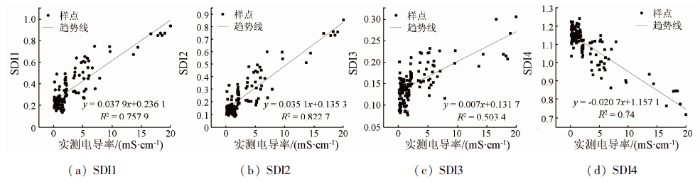
由遥感盐分监测指数模型与实测电导率拟合效果可知(图4),SDI模型、SDI2模型、SDI3模型、SDI4模型的拟合度分别为0.757 9,0.822 7,0.503 4和0.740 0,SDI模型、SDI2模型、SDI3模型与实测电导率呈正相关,SDI4模型与实测电导率呈负相关。
综上,SI和NDVI光谱指数构建遥感盐分监测指数模型SDI1其分类总体精度达83.45%,模型与实测电导率拟合R2=0.757 9,综合对比选择SDI1模型对阿拉尔垦区土壤盐渍化信息提取较好,更适合反演垦区土壤盐渍化程度。
2.4 阿拉尔垦区土壤盐渍化时空分布
图5
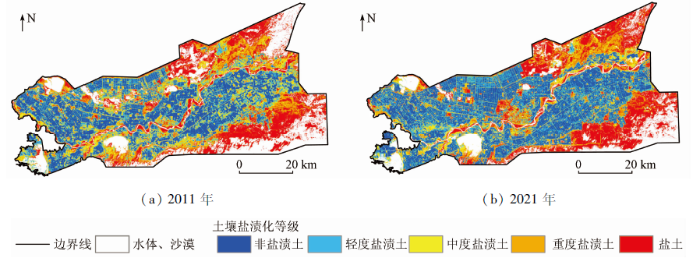
图5
2011、2021年阿拉尔垦区土壤盐渍化等级分布
Fig.5
Distribution of soil salinization grade in Alar reclamation area in 2011 and 2021
表5 2011年、2021年阿拉尔垦区土壤盐渍化面积统计
Tab.5
| 年份 | 非盐渍土 | 轻度盐渍土 | 中度盐渍土 | 重度盐渍土 | 盐土 |
|---|---|---|---|---|---|
| 2011年 | 906.31 | 524.37 | 519.46 | 538.39 | 787.72 |
| 2021年 | 1116.39 | 606.86 | 410.34 | 506.88 | 830.03 |
由图5分布状况并结合奥维地图分析,非盐渍土主要分布在垦区农田,轻度盐渍土呈零散形分布于垦区内,中度盐渍土、重度盐渍土主要分布在阿拉尔市中心、垦区南部和垦区东北地区,盐土主要分布在垦区东北和东南地区。
2011—2021年,垦区土壤盐渍化面积呈现出非盐渍土、轻度盐渍土面积增加,中度、重度盐渍土面积下降,盐土面积增加。其中,非盐渍土面积增加210.08 km2,增加的区域主要分布在垦区北部、南部和东部地区,由中度盐渍土和重度盐渍土转入为主; 轻度盐渍土面积增加82.49 km2,增加的区域以零散化分布在垦区; 中度盐渍土、重度盐渍土面积分别减少109.12 km2和31.51 km2,减少的区域主要在垦区南部和东部地区; 盐土面积增加42.31 km2,增加的区域则主要位于垦区东北和东南地区。近10 a间,垦区的北部、南部和东部地区非盐渍土明显增加,土壤盐渍化程度有所改善。
3 讨论
1)模型选择。常规土壤盐分监测多由野外数据采集结合实验室测定得来,多光谱遥感数据获取简单、成本低、易操作,直接通过光谱指数构建遥感盐分监测指数模型,能快速对其研究区土壤盐分进行测定。选择模型时,考虑不同研究区所处地理位置的地形和气候条件存在差异性,不同光谱指数构建的遥感盐分监测指数模型精度结果不一致,直接选取一种模型反演垦区盐分,不能确保为最优精度。边玲玲等[28]对黄河三角洲垦利县土壤盐渍化反演中认为遥感盐分监测指数模型SDI3(SI-Albedo)效果最佳,冯娟等[20]认为SDI4(Albedo-MSAVI)反演新疆渭库绿洲土壤盐分精度更高,故选择不同光谱指数构建常用4类遥感盐分监测指数模型进行对比分析。
2)模型精度。对4类遥感盐分监测指数模型总体精度进行验证,盐分指数和归一化植被指数构建的遥感盐分监测指数模型对阿拉尔垦区土壤盐渍化反演效果更好。由总体精度对比可知,植被指数参与构建的遥感盐分监测指数模型SDI1,SDI4和SDI2高于无植被指数参与构建的遥感盐分监测指数模型SDI3,其原因可能是遥感影像选择为植被覆盖旺盛时期,此时植被指数能反映出植被长势状况,植被长势受不同盐分含量影响,故而更能间接反映出垦区土壤盐渍化状况。同时,SDI2,SDI4模型对阿拉尔垦区非盐渍土和轻度盐渍土反演效果较好,对中度盐渍土、重度盐渍土和盐土反演效果较差,说明SDI2,SDI4模型对垦区土壤盐渍化监测具有一定参考意义,但适宜性还需进一步验证。总之,不同研究区应根据自身特性合理选择光谱指数构建遥感盐分监测指数模型,以便能精确反演土壤盐分信息。
3)垦区土壤盐分分布。通过遥感盐分监测指数模型SDI1对阿拉尔垦区土壤盐渍化进行反演,反演结果中农田分布状况同吴家林[27]基于高光谱研究垦区棉田土壤盐渍化结果基本一致。土壤盐渍化分布受自然因素和人为因素影响[10],土壤水分对土壤盐分影响较大,土壤中的盐分会随着水分的运移而迁移[1]。垦区位于新疆南部干旱区,光照强,蒸发量较大,土壤水分蒸发会携带盐分一同上移,农田多在春季或冬季采用漫灌洗盐,采用膜下滴灌控制水量和土壤盐分,极大降低了农田中表层土壤的盐分含量,故垦区农田主要以非盐渍土和轻度盐渍土为主。通过结合奥维地图分析,垦区重度盐渍土和盐土主要是裸地和植被覆盖稀少的沙地,日照时间长、降水量和灌水量低是导致土壤盐分多量汇集在土壤表层形成盐斑的原因之一。
土壤盐渍化反演精度一定程度上受遥感影像数据分辨率影响,本研究选取Landsat8卫星数据,空间分辨率30 m,故分类精度只能是一个近似区域,若进一步提高土壤盐渍化反演精度,可采用高分辨率的遥感影像数据,如国产高分系列、WorldView系列、GeoEye系列、IKONOS系列等。
4 结论
研究利用Landsat8 OLI遥感影像,通过盐分指数(SI)、归一化植被指数(NDVI)、地表反照率(Albedo)、修改型土壤调节植被指数(MSAVI)构建遥感盐分监测指数模型SDI1,SDI2,SDI3及SDI4对阿拉尔垦区土壤盐渍化进行信息提取,结合实测电导率进行精度评价,得出以下结论:
1)遥感盐分监测指数模型SDI1,SDI2,SDI3及SDI4与实测电导率的拟合度分别为0.757 9,0.822 7,0.503 4和0.740 0,样点总体分类精度为83.45%,69.78%,53.23%和71.94%,综合比较,阿拉尔垦区土壤盐渍化信息提取的模型精度依次是SDI1>SDI2>SDI4>SDI3。
2)SDI2和SDI4总体反演精度近70%,表明在一定程度上对阿拉尔垦区土壤盐渍化监测有一定的参考意义。
3)利用遥感盐分监测指数模型SDI1对阿拉尔垦区土壤盐渍化信息提取,阿拉尔垦区以非盐渍土和轻度盐渍土为主,非盐渍土分布在垦区西部、北部和东部地区,轻度盐渍土则零散分布于垦区。中度盐渍土、重度盐渍土和盐土主要分布在垦区南部、东北和东南地区。
参考文献
利用多源光谱信息反演宁夏银北地区干湿季土壤含盐量
[J].
Inversion of soil salinity in dry and wet seasons based on multi-source spectral data inYinbei area of Ningxia,China
[J].
北疆常年膜下滴灌棉田土壤盐分积累特征研究
[J].
Study on characteristics of cotton field soil salt accumulation under perennialmulched drip irrigation in Northern Xinjiang
[J].
多源数据的区域土壤盐渍化精确评估
[J].
Accurate evaluation of regional soil salinization using multi-source data
[J].
Detection and modeling of soil salinity variations in arid lands using remote sensing data
[J].
DOI:10.1515/geo-2020-0244
URL
[本文引用: 1]

Soil salinization is a ubiquitous global problem. The literature supports the integration of remote sensing (RS) techniques and field measurements as effective methods for developing soil salinity prediction models. The objectives of this study were to (i) estimate the level of soil salinity in Abu Dhabi using spectral indices and field measurements and (ii) develop a model for detecting and mapping soil salinity variations in the study area using RS data. We integrated Landsat 8 data with the electrical conductivity measurements of soil samples taken from the study area. Statistical analysis of the integrated data showed that the normalized difference vegetation index and bare soil index showed moderate correlations among the examined indices. The relation between these two indices can contribute to the development of successful soil salinity prediction models. Results show that 31% of the soil in the study area is moderately saline and 46% of the soil is highly saline. The results support that geoinformatic techniques using RS data and technologies constitute an effective tool for detecting soil salinity by modeling and mapping the spatial distribution of saline soils. Furthermore, we observed a low correlation between soil salinity and the nighttime land surface temperature.
Estimating soil salinity in Pingluo County of China using QuickBird data and soil reflectance spectra
[J].DOI:10.1016/j.jag.2013.06.002 URL [本文引用: 1]
Detecting soil salinity with arid fraction integrated index and salinity index in feature space using Landsat TM imagery
[J].
DOI:10.1007/s40333-013-0183-x
[本文引用: 1]
Modeling soil salinity in an arid salt-affected ecosystem is a difficult task when using remote sensing data because of the complicated soil context (vegetation cover, moisture, surface roughness, and organic matter) and the weak spectral features of salinized soil. Therefore, an index such as the salinity index (SI) that only uses soil spectra may not detect soil salinity effectively and quantitatively. The use of vegetation reflectance as an indirect indicator can avoid limitations associated with the direct use of soil reflectance. The normalized difference vegetation index (NDVI), as the most common vegetation index, was found to be responsive to salinity but may not be available for retrieving sparse vegetation due to its sensitivity to background soil in arid areas. Therefore, the arid fraction integrated index (AFII) was created as supported by the spectral mixture analysis (SMA), which is more appropriate for analyzing variations in vegetation cover (particularly halophytes) than NDVI in the study area. Using soil and vegetation separately for detecting salinity perhaps is not feasible. Then, we developed a new and opera-tional model, the soil salinity detecting model (SDM) that combines AFII and SI to quantitatively estimate the salt content in the surface soil. SDMs, including SDM1 and SDM2, were constructed through analyzing the spatial characteristics of soils with different salinization degree by integrating AFII and SI using a scatterplot. The SDMs were then compared to the combined spectral response index (COSRI) from field measurements with respect to the soil salt content. The results indicate that the SDM values are highly correlated with soil salinity, in contrast to the performance of COSRI. Strong exponential relationships were observed between soil salinity and SDMs (<em>R</em><sup>2</sup>>0.86, RMSE<6.86) compared to COSRI (<em>R</em><sup>2</sup>=0.71, RMSE=16.21). These results suggest that the feature space related to biophysical properties combined with AFII and SI can effectively provide information on soil salinity.
基于SI-Albedo特征空间的干旱区盐渍化土壤信息提取研究——以克里雅河流域绿洲为例
[J].
SI-ALbedo space based extraction of salinization information in arid area
[J].
基于改进植被指数的黄河口区盐渍土盐分遥感反演
[J].
Remote sensing inversion of saline soil salinity based on modified vegetation index in estuary area of Yellow River
[J].
新疆石河子农区土壤含盐量定量反演及其空间格局分析
[J].
DOI:10.11821/dlyj201411013
[本文引用: 1]
盐渍化严重威胁着土地持续耕作和粮食生产安全,土壤含盐量的快速反演和及时监测,对新疆石河子农区农业可持续发展有着重大意义。以Landsat-8 OLI遥感影像与野外采样测定的72个样点土壤含盐量为数据基础,引入土壤亮度指数、土壤湿度指数、土壤盐盖度指数和土壤辐射水平指数等构建的特征遥感指数定量反演新疆石河子农垦区土壤含盐量,并对其空间布局进行了分析。研究表明:① 利用遥感影像像元特征遥感指数值反演地面对应土壤含盐量的精度较好,反演方法可行,反演精度为66%;② 反演得到土壤含盐量空间分布图在空间上等级明显,层次分明,呈现出“一带一区”的格局,“一带”是玛纳斯流域形成的盐渍化程度较高的条带,“一区”是内在土质形成的严重盐渍化区域;③ 在新疆石河子农区中,35.40%的棉田适合耕作,64.60%的棉田耕地需要进行改良,农区土壤盐渍化治理仍十分紧迫。
Quantitative inversion of soil salinity and analysis of its spatial pattern in agricultural area in Shihezi of Xinjiang
[J].
DOI:10.11821/dlyj201411013
[本文引用: 1]
Salinization has been a serious threat to continuous farming and grain production security, therefore, the rapid inversion of soil salinity is particularly important. The monitoring and prevention of soil salinization are of great significance to agricultural sustainable development in Shihezi, Xinjiang. In this study, we took the remote sensing image of Landsat-8 OLI and the soil salinity of 72 samples measured in the field as a data base. Then we introduced the soil brightness index, soil moisture index, soil cover degree index and soil radiation level index. Finally we built feature remote sensing index to invert quantitatively the soil salinity of Land Reclamation District of Shihezi in Xinjiang, and analyzed the spatial pattern of it. The results showed that: ① The accuracy of characteristic remote sensing index value of image pixel to invert soil salinity which corresponded to the ground was better. The inversion method was feasible. REE and RMSM, the precision validation index of inversion model were 3.07 and 0.34 respectively, and retrieval accuracy was 66%; ② The distribution map of soil salinity with obvious grades and clear levels presented the pattern of 'one stripe and one region'. One stripe referred to the stripe with high salinization formed by Manas basin, mostly located in the alluvial plains, low-lying area, and reservoir areas. And one region referred to the region with serious salinization caused by soil texture. ③ In the farming areas, the non-salinization cotton area accounted for 14.02%, the mild salinization cotton area accounted for 21.38%, the moderate salinization cotton area accounted for 21.27%, severe salinization cotton area accounted for 29.99%, and saline accounted for 13.30% in cotton area. Some 35.40% of the cotton field was suitable for cultivation and 64.60% of the cotton field which needed to be improved. It is urgent to control soil salinization of farming areas.
干旱区土壤盐渍化特征空间建模
[J].
Detecting soil salinization in arid regions using spectral feature space derived from remote sensing data
[J].
玛纳斯河流域农灌区土壤盐渍化遥感定量评价
[J].
Remote sensing quantitative evaluation of soil salinization in agricultural irrigation areas of Manas River Basin
[J].
塔里木河下游绿洲灌区土壤盐渍化特征及季节性变化规律
[J].
Soil salinization characteristics and its seasonal variation in oasis irrigation district of lower reaches of Tarim River
[J].
玛纳斯河流域绿洲农田土壤盐分反演及空间分布特征
[J].
Soil salinity retrieval and spatial distribution of oasis farmland in Manasi river basin
[J].
干旱区棉田表层土壤盐渍化时空变异研究
[J].
Clarifying spatial-temporal variability of surface soil salinization in arid cotton fields
[J].
北疆农区土壤盐渍化遥感监测及其时空特征分析
[J].
DOI:10.13249/j.cnki.sgs.2015.012.1607
[本文引用: 1]
基于MODIS数据,利用归一化植被指数和盐分指数的二维特征空间关系建立土壤盐渍化遥感监测模型,对北疆农区2000年以来的土壤盐渍化状况及其空间动态变化进行了监测分析,并探讨了典型区土壤盐渍化的主要驱动因素。结果表明:① 土壤盐渍化遥感监测指数可以从宏观上定量刻画北疆农区的土壤含盐量;② 北疆农区土壤盐渍化空间特征呈现出总体上逆转、局部严重发展的态势;③ 土壤盐渍化等级在不同时间段的发展或逆转的方向主要由中度向重度及重度向盐土间的相互转化,其中重度盐渍化农用地的转化幅度最大;④ 不同土壤盐渍化等级中盐土的形成与农区降水量和干燥程度具有较好的相关性,未盐渍化(正常)和中度盐渍化与农区有效灌溉面积和农作物播种面积分别呈相关系数较高的正相关和负相关。
Remote sensing monitoring and spatial-temporal characteristics analysis of soil salinization in agricultural area of Northern Xinjiang
[J].
基于NDVI-SI特征空间的土壤盐渍化遥感模型
[J].
Remote sensing monitoring models of soil salinization based in NDVI-SI feature space
[J].
基于MSAVI-SI特征空间的玛纳斯河流域灌区土壤盐渍化研究
[J].
Soil salinization in the irrigated area of the Manas River Basin based on MSAVI-SI feature space
[J].
基于Albedo-MSAVI特征空间的渭库绿洲土壤盐渍化研究
[J].选取新疆塔里木河流域渭库绿洲为研究区,以landsat8 OLI和野外调查为基础数据,分析盐渍化土壤与反照率(Albedo)和修改型土壤调节植被指数(MSAVI)的关系,并提出Albedo-MSAVI特征空间概念,构建监测土壤盐渍化不同指数模型SDI。结果表明:1、Albedo-MSAVI特征空间分布呈现明显的规律性,即地表反照率与修改型土壤调节植被指数在第一象限呈双曲线分布,且盐渍化与非盐渍化土壤分异明显;2、SDI模型与土壤含盐量的决定系数为0.96,能够较好的反应绿洲盐渍化情况;3、不同盐渍化程度的SDI平均差异与非盐渍化SDI平均差异特征明显,其差值在0.12~0.34之间,因此SDI指数可以作为盐渍化信息快速提取的指标,且SDI模型的构建有利于干旱区大尺度定量监测和评价土壤盐渍化工作。
Remote sensing modeling of soil salinization information in arid areas
[J].
阿拉尔垦区近30年耕地变化及其驱动因子分析
[J].
Change of cultivated land and its driving factors in Alar Reclamation Area in the past thirty years
[J].
新疆阿拉尔垦区土壤发生特性及系统分类研究
[J].
Research on the genetic characteristic and taxonomy of soils in Aral irrigated area
[J].
基于SI-MSAVI特征空间的河套灌区盐碱化遥感监测研究
[J].
Remote sensing monitoring of salinization in Hetao irrigation district based on SI-MSAVI feature space
[J].
基于多光谱遥感的盐渍化评价指数对宁夏银北灌区土壤盐度预测的适用性分析
[J].
An applicability analysis of salinization evaluation index based on multispectral remote sensing to soil salinity prediction in Yinbei irrigation area of Ningxia
[J].
The selection of the best possible Landsat TM band combination for delineating salt-affected soils
[J].DOI:10.1080/01431169208904252 URL [本文引用: 2]
基于特征空间的黄河三角洲垦利县土壤盐分遥感提取
[J].
Remote sensing extraction of soil salinity in Yellow River delta Kenli County based on feature space
[J].
Diagnosis and improvement of saline and alkali soils
[J].
