

0 引言
陆地生态系统大约可以吸收45%人为排放的
三江源地区位于我国青藏高原腹地,属于典型的高原高寒地区,是我国江河中下游地区生态环境安全和区域可持续发展的重要生态屏障[5],同时,也是我国重要的陆地生态系统碳收支变化敏感区,因此,三江源地区生态系统的碳源/汇变化研究对于我国“双碳”战略目标的达成意义重大。国内外学者对三江源典型生态系统碳源/汇的变化[6-7]、植被碳利用率[8]、生态系统有机碳储量[9-10]、碳密度[11]、碳排放[12]等方面开展了许多研究,研究结果表明,三江源生态系统具有较强的碳汇功能。任小丽等[13]收集整理了2001—2010年青藏高原10个通量观测站点的观测数据估算了三江源区草地生态系统NEP,结果表明高寒湿地草甸碳汇能力最强,而高寒草甸草原为碳源,NEP变化主要受到气温和光合有效辐射(photosynthetic active radiation, PAR)影响; 陈雪娇等[6]基于BIOME-BGC模型,得出2001—2017年三江源草地群落NEP模拟值并发现三江源草地生态系统具有显著的碳汇贡献,且不同群落NEP对气温和降水的响应程度有所差异。这些研究主要是基于实测数据,仅对三江源地区单种生态系统的碳源/汇做出了定量化分析。然而,三江源地区生态系统涵盖了森林、草原、荒漠、湿地等多种生态系统,仅对单种生态系统的碳源/汇定量化分析不能代表整个区域的情况。同时,因三江源地区特殊的地理位置以及脆弱的生境使得实测数据的获取较为困难,所以,仅靠实测手段难以对整个三江源地区多种生态系统的碳源/汇空间格局实现全面的、定量化的研究。
基于此,为了定量化分析三江源地区的碳储存能力及其变化过程,本研究拟应用谷歌地球引擎(Google Earth Engine, GEE)作为数据云端运算平台[14],利用较高时空分辨率的MODIS数据,对整个三江源区域自2001—2020年共20 a间的森林、草地、荒漠、湿地等植被生态系统NEP进行模型计算,运用Slope一元线性回归分析方法对其长时间序列的动态变化特征进行分析,并采用偏相关分析法探讨降水、气温、太阳辐射等气候因素对不同生态系统植被NEP的综合影响。以期为该区域开展碳汇管理,制定有效的生态保护策略以及陆地生态修复工程的成效评估方法提供支撑。
1 研究区域概况与数据源
1.1 研究区域概况
三江源地区(E89°45'~102°23',N31°39'~36°12')平均海拔3 500~4 800 m,总面积为30.25万km2,其大部分隶属于青海省,约占青海省总面积的43%(图1),是我国典型的高寒地区。三江源地区河流密布、湖泊、沼泽众多,雪山冰川广布,是世界上海拔最高、面积最大、湿地类型最丰富的地区,被誉为“中华水塔”。该地区属高原大陆性气候,虽无四季之分,但干湿两季分明、冷热两季交替,日照时间久、太阳辐射强烈[15]。为了研究三江源地区不同生态区的碳源/汇状况,本文依据中国科学院傅伯杰院士及其团队开发的中国生态区划方案[16]将三江源区分为6个生态分区,分别为: Ⅲ3(2)可可西里半荒漠、荒漠生态区; Ⅲ3(1)柴达木盆地荒漠、盐壳生态区; Ⅲ2(5)羌塘高原高寒草原生态区; Ⅲ2(3)江河源区高寒草甸生态区; Ⅲ2(2)青海东部农牧生态区; Ⅲ1(2)青藏高原东部暗针叶林、高寒草甸生态区。
图1
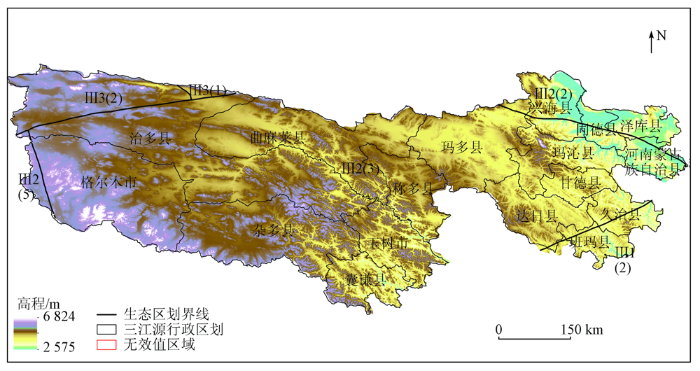
图1
三江源区生态区划及高程示意图
Fig.1
Ecological regions and elevation in the Three-River Headwaters region
1.2 数据来源及处理
本文所采用的遥感数据均基于GEE平台获取(见表1)。NPP资料来源于MOD17A3HGF V6产品提供的500 m空间分辨率的年度NPP数据。气温和太阳辐射数据采用ERA5-Land Hourly - ECMWF Climate Reanalysis逐小时数据集,空间分辨率为 0.1°; 降水数据采用气候危害组红外降水与站点数据(CHIRPS)准全球降水数据集,空间分辨率为0.05°。土地覆盖率和数字高程模型(digital elevation model,DEM)数据分别来自GlobeLand30: 全球地理信息公共产品和地理空间数据云平台,空间分辨率均为30 m。
表1 基于GEE平台的数据清单
Tab.1
| 数据 | 数据集 | 波段 | 分辨率 | 单位 | 提供者 |
|---|---|---|---|---|---|
| NPP | MOD17A3HGF V6 | Npp | 500 m | kg·C/m2 | NASA LP DAAC at the USGS EROS Center |
| 气温 | ERA5-Land | temperature_2m | 0.1° | ℃ | Climate Data Store |
| 降水 | CHIRPS | Precipitation | 0.05° | mm | UCSB/CHG |
| 太阳辐射 | ERA5-Land | surface_net_solar_radiation | 0.1° | J/m2 | Climate Data Store |
GEE是由Google提供的基于云计算的行星级地理空间分析平台,存储着海量公开的地理空间数据集,具有强大的计算力,为较大时空尺度的研究提供便捷[17]。为了保证不同数据源之间的几何匹配精度,本文在GEE平台中对研究区NPP、气温、降水和太阳辐射等数据进行预处理。利用Reproject算法将投影转化为EPSG: 4326并设置scale为500,将影像转换到GCS_WGS_1984地理坐标系,采用最邻近插值法对影像进行重采样至500 m。
2 研究方法
2.1 NEP估算模型
式中: RH为年土壤微生物呼吸碳排放量,gC/(m2·a); T为年平均气温,℃; R为年平均降水量,mm。
2.2 趋势分析和稳定性分析
式中: n为总年份数,本文中n=20; Slope为NEP在这n年间的变化趋势值;
式中: CV为变异系数;
2.3 偏相关性分析
生态系统是一个有机的整体,各生态要素间相互联系、相互制约和相互渗透,某一要素的变化会导致其他要素甚至整个生态系统状态的改变。因此,常通过偏相关分析法对生态系统的影响因素进行分析。偏相关分析方法是指在对其他变量的影响进行控制的条件下,分析多个变量中某2个变量之间的线性相关程度,并计算偏相关系数[28]。计算公式为:
式中
本文采用偏相关分析法对三江源地区NEP与气温、降水和太阳辐射3个气候因子的相关关系进行分析,利用ArcGIS10.7软件里的Reclassify工具将偏相关系数以0、±3、±5、±8作为分割点进行分级。
3 结果与讨论
3.1 三江源NEP的时空变化分析
3.1.1 年际变化分析
通过对三江源区NEP均值的年际变化分析(图2)可以看出,自2001年来,三江源区年均NEP呈波动上升趋势,年际变化率为1.13 gC/(m2·a),其中,2010年达到最大值139.92 gC/(m2·a),而在2008年出现最小值104.68 gC/(m2·a),碳循环总体以碳汇为主(图3)。2001—2020年共20 a间,三江源区碳源区(NEP<0)的面积占三江源区总面积的比重呈波动下降的趋势,其中2002年碳源区面积占比最大。研究资料发现,三江源地区在21世纪初气温发生了突变,年平均气温增温现象显著,三江源地区生态环境不断恶化[15]; 同时,受到过度放牧、垦殖和采矿等人类活动的影响,三江源区地区出现较为严重的水土流失[29],多种原因导致植被总体固碳量较少,土壤呼吸排放碳量大于植被固定碳量,碳源能力增强。近20 a来,碳汇区(NEP>0)的面积呈波动上升趋势,并在2014年以后变化趋于平稳。自2014年实施三江源区生态保护和建设二期工程以来,退牧还草、退耕还林、恶化退化草场治理、水土保持[30]等政策的积极实施,大大改善了区域的整体生态环境,三江源区生态系统的植被覆盖度、生产力明显提高,碳吸收量逐步增加,碳汇功能显著增强,NEP呈显著上升趋势。与之相反,碳源区的面积明显减少且变化趋于稳定。
图2

图2
2001—2020年三江源区年NEP均值年际变化
Fig.2
Interannual variation of annual average NEP in the Three-River Headwaters region from 2001 to 2020
图3

图3
三江源区碳源/汇面积占比变化趋势
Fig.3
Carbon source/sink area variation in the Three-River Headwaters region
为了解各个不同生态区NEP的变化状况,对6个生态区NEP20 a间的变化分别进行了计算分析,可以看出三江源区6个生态区的NEP均呈现增加趋势,但增加速度存在一定差异(图4)。
图4

图4
不同生态区年均NEP年际变化趋势
Fig.4
The interannual variation trend of annual average NEP in different ecological regions
1)20 a间,可可西里半荒漠、荒漠生态区的植被生态系统NEP值一直偏低(图4(a)),在11.22~25.27 gC/(m2·a)之间变化,年际变化率为0.65 gC/(m2·a),最低值出现在2003年,最大值出现在2020年。该生态区NEP的平均值为17.94 gC/(m2·a),累积NEP为358.88 gC/(m2·a),虽然生态区的NEP一直维持在较低的水平,但仍然表现为弱碳汇区。
2)柴达木盆地荒漠、盐壳生态区因植被覆盖稀少,土壤沙化、盐渍化严重,气候干燥少雨,植被的总体固碳量较少。由图4(b)可知,该地区是三江源6个生态区中NEP最低的区域,累积NEP仅为234.70 gC/(m2·a),20 a间的NEP平均值为11.73 gC/(m2·a),年际变化率为0.47 gC/(m2·a)。在2001年该生态区气温较低,太阳辐射较弱,NEP仅为6.65 gC/(m2·a),2020年达到最大值,为18.54 gC/(m2·a)。虽然NEP值很低,但仍属于弱碳汇区。
3)羌塘高原高寒草原生态区位于青海高原西北部,地势偏高,降水少、气温低,气候条件恶劣,仅适合高寒草原植被生长,植被覆盖度总体偏低,牧草分布稀疏。20 a间,该生态区NEP在17.26~33.46 gC/(m2·a)之间(图4(c)),平均值为25.08 gC/(m2·a),累积NEP为501.55 gC/(m2·a),年际变化率为0.6 gC/(m2·a)。2008年该生态区的NEP到达最小值,可能是气温的突然降低导致的; 在2018年达到最大值。虽然高寒草原生态区的碳汇能力有限,但属于明显的弱碳汇区。
4)随着地理位置的变化,江河源区高寒草甸生态区NEP明显增高(图4(d))。20 a间的NEP在97.23~132.78 gC/(m2·a)之间变化,平均值为114.01 gC/(m2·a),累积NEP达到为2 280.24 gC/(m2·a),年际变化率为1.07 gC/(m2·a)。虽然2008年该生态区NEP的最小值为97.23 gC/(m2·a),但已远高于高寒草原区、柴达木盆地荒漠区和可可西里荒漠区,2010年则达到20 a间的最大值。该地区植被覆盖类型以草地为主,低、中等覆盖度草地占绝对优势,降水充足、气温适宜,水热耦合作用良好,植被固碳能力显著增强,属于显著的碳汇区。
5)青海东部农牧生态区位于青海高原东部,地处河湟谷地,是三江源区重要的耕地分布区,该地区气候温暖湿润,有利于植被生长。由图4(e)可知,20 a间,NEP在190.5~267.93 gC/(m2·a)之间变化,平均值为227.25 gC/(m2·a),累积NEP为4 545.28 gC/(m2·a),年际变化率为2.54 gC/(m2·a)。2001年水热条件较差,该生态区NEP到达最小值; 2018年降水丰富,NEP达到最大值。根据生态区平均NEP和累积NEP来看,青海东部农牧生态区是重要的碳汇生态区。
6)青藏高原东部暗针叶林、高寒草甸生态区20 a间NEP在230.42~295.36 gC/(m2·a)间变化(图4(f)),平均值为258.91 gC/(m2·a),累积NEP平均值为5 178.46 gC/(m2·a),年际变化率为0.94g C/(m2·a),在2004年到达最小值,在2006年达到最大值。该区草地和森林资源较为丰富,水热组合条件良好,是三江源区最为重要的碳汇贡献区域。
3.1.2 空间变化分析
2001—2020年三江源区地区NEP的空间格局存在明显的空间异质性(图5),其变化梯度由东南向西北递减,与区域高程变化相反。三江源区NEP多年平均值为120.93 gC/(m2·a),累积NEP平均值为2 418.51 gC/(m2·a)。其中,碳汇区(NEP>0)面积约为39.56万km2,占总面积的99.89%,年平均固碳量为188.43 gC/(m2·a); 碳源区(NEP<0)面积约为14.55万km2,占总面积的0.11%,年碳排放量平均值为-61.70 gC/(m2·a)。因此,三江源区是明显的碳汇区,具有非常重要的二氧化碳吸收价值。
图5

图5
三江源区2001—2020年年均NEP空间分布
Fig.5
Spatial distribution of annual average NEP in the Three-River Headwaters region from 2001 to 2020
3.1.3 三江源NEP趋势变化和稳定性变化
本文利用ESRI公司开发的ArcGIS10.7软件,将趋势分析和稳定性分析的结果按自然间断点法分为明显变差、轻微变差、基本不变、轻微变好、明显变好5类变化趋势以及稳定性低、较低、中等、较高、高5级。
表2 三江源区2001—2020年NEP趋势变化统计
Tab.2
| slope趋势分级 | 变化等级 | 面积/km2 | 比例/% |
|---|---|---|---|
| [-1,-0.477) | 明显变差 | 6 335.17 | 2.09 |
| [-0.477,0) | 轻微变差 | 8 635.27 | 2.85 |
| [0,0.484) | 基本稳定 | 42 243.85 | 13.96 |
| [0.484,0.813) | 轻微好转 | 44 727.26 | 14.79 |
| [0.813,1] | 明显好转 | 200 558.45 | 66.30 |
图6

图6
三江源区2001—2020年NEP变化趋势空间分布
Fig.6
Spatial distribution of NEP variation trend in the Three-River Headwaters region from 2001 to 2020
NEP有增加趋势的地区占总面积的95.05%,其中,明显好转区域的面积占66.30%,轻微好转面积占14.79%。NEP明显好转的区域主要分布在青海东部农牧生态区和江河源区高寒草甸生态区西南部和中部部分地区,这些区域温度适宜、水源丰富,植被NEP明显增加,且降水量、气温年际变化幅度较小,土壤呼吸消耗碳量偏少,植被碳汇能力逐年增加。轻微好转的区域主要分布在研究区西部。
相比之下,NEP减少的面积稀少且分散,仅占总面积的4.94%,其中,明显变差的区域仅占总面积的2.09%,轻微变差的区域为2.85%。这些变差区域呈斑块状分布在研究区的东南部和北部极少数地区,虽然降水的增加改善了干旱对这些地区胁迫,但温度的持续升高使土壤的呼吸作用增加,消耗了大量有机碳,抑制了植被NEP[34],导致区域碳汇功能下降。
研究区域中NEP基本稳定的区域约占总面积的13.96%,主要分布在可可西里半荒漠、荒漠生态区、柴达木盆地荒漠、盐壳生态区以及江河源区高寒草甸生态区西部部分地区。
稳定性分析结果表明,2001—2020年,三江源区NEP变异系数存在明显的空间差异,总体呈现出从东南向西北递增的趋势,变异系数以低、较低波动居多,仅在有限地区呈现高波动,稳定性较高(表3,图7)。NEP波动低、较低、中等、较高、高区域占总面积的比例分别为36.76%、38.00%、18.51%、4.57%和2.16%。低波动区主要分布于青藏高原东部暗针叶林、高寒草甸生态区、青海东部农牧生态区东南部和江河源区高寒草甸生态区东南部。结合图5可以看出,低波动区域的分布与NEP高值区分布基本一致,表明这些地区20 a间持续且稳定地发挥着碳汇功能。高波动区主要分布在三江源区西部,包括可可西里半荒漠、荒漠生态区和江河源区高寒草甸生态区西部。这些区域荒漠、半荒漠化严重,气候严寒,生态环境极其脆弱,植被覆盖度较低,生态敏感性高,降水、温度等气候因子的任何异常均会导致该生态区植被及植被NEP的变化,植被碳汇功能不稳定。
表3 三江源区2001—2020年NEP稳定性变化统计
Tab.3
| CV变异系数分级 | 稳定性等级 | 面积/km2 | 比例/% |
|---|---|---|---|
| [-0.078,0.138) | 高 | 111 203.09 | 36.76 |
| [0.138,0.219) | 较高 | 114 947.61 | 38.00 |
| [0.219,0.339) | 中等 | 56 001.25 | 18.51 |
| [0.339,0.559) | 较低 | 13 818.14 | 4.57 |
| [0.559,0.75) | 低 | 6 529.90 | 2.16 |
图7

图7
三江源区2001—2020年NEP稳定性空间分布
Fig.7
Spatial distribution of NEP stability in the Three-River Headwaters region from 2001 to 2020
3.2 三江源区NEP与气候因子的关系
植被的固碳过程非常复杂,受到多种因素的综合影响,单一气候因素无法对这一过程进行分析和解释,因此本文采用二阶偏相关系数分析法,对气温、降水和太阳辐射三种气候因素对三江源NEP变化的影响进行了分析。
结果表明,三江源70.05%的区域NEP与气温呈负相关,这些生态区NEP随温度升高而降低(图8(a)、图 9(a))。其中江河源区高寒草甸生态区、青藏高原东部暗针叶林、高寒草甸生态区和青海东部农牧生态区NEP与气温呈负相关的面积分别为93.73%,71.6%和76.85%。这是因为高温会显著影响光合作用的酶活性以及植被蒸腾作用和营养物质的运输[35],抑制植被生长,从而导致植被总体固碳量减少,土壤的呼吸排放碳量大于植被固定碳量,碳源趋势增强。与植被分布茂密的区域不同,在气温寒冷,植被稀疏的在羌塘高原高寒草原生态区和可可西里半荒漠、荒漠生态区,分别有79.53%和81.16%的地区NEP与气温呈正相关,区内NEP随温度升高而增加。尤其是在羌塘高原高寒草原生态区,有13.7%的地区偏相关系数在0.5~0.8之间,相比其他生态区,区域NEP与气温相关关系较高。高寒地区,适当的温度升高能较好地促进植被生长,光合作用明显增强,植被覆盖度、生产力提高[36],同时,植被的生长期被延长,碳吸收量增加,碳汇功能随着温度的升高有所增强。前文关于各生态区NEP的研究结果也发现羌塘高原高寒草原生态区NEP的最低值出现在2008年,这与当年的气温偏低,降水量偏少,各种条件均不利于植被生长有显著关系。
图8
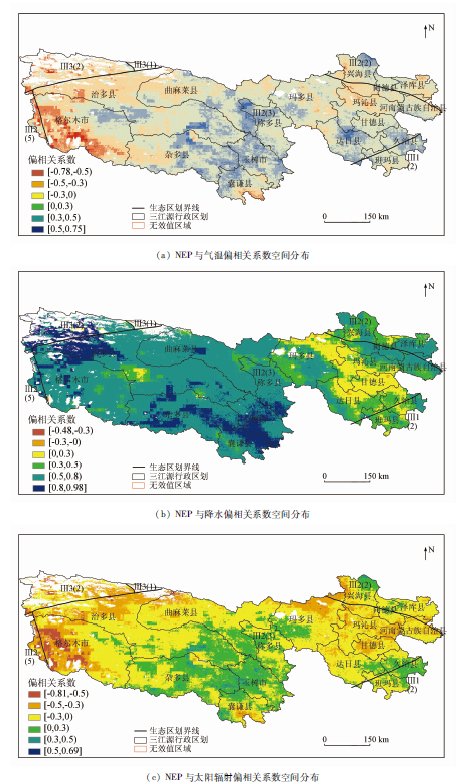
图8
三江源区NEP与气温、降水和太阳辐射偏相关系数的空间分布
Fig.8
Spatial distribution of partial correlation coefficients between NEP and precipitation, temperature, and solar radiation in the Three-River Headwaters Region from 2001—2020
图9

图9
2001—2020年三江源各生态区降水、气温、太阳辐射对NEP影响的面积百分比
Fig.9
Percentage of the areas affected by precipitation, temperature, and solar radiation in the Three-River Headwaters Region from 2001—2020
降水与三江源生态区NEP的相关性分析发现,偏相关系数在0.5~0.8之间的区域分别占羌塘高原高寒草原生态区、江河源区高寒草甸生态区和青海东部农牧生态区的68.75%,61.08%,50.46%,而在可可西里半荒漠、荒漠生态区,偏相关系数大于0.8的区域占54.11%,三江源99.79%的地区NEP与降水呈正相关(图8(b)、图9(b)),表明降水是影响该地区NEP的关键因子。土壤含水量是保证植被所需养分运输的最重要介质[36],降水量的增多提高了土壤湿度,促进了植被生长,增强了植被生产力。与此同时,植被的生长也促进了土壤微生物的活性,增加了土壤的碳输入和碳储存,最终表现为整个生态区NEP随降水量的增加而提高。这与降水量增加能够促进草地生态系统水平的碳循环的结论相一致[37⇓-39]。生态区NEP与降水呈负相关的区域主要集中在柴达木盆地荒漠、盐壳生态区,该生态区32.2%的地区NEP与降水呈负相关。荒漠区土壤贫瘠,过多的降水会导致土壤中的氮磷等营养物质缺失,同时,植被根系及土壤微生物因水分过多而缺氧,从而对本就稀疏的植被生长带来威胁[40],进而影响植被固碳功能。
NEP与太阳辐射的偏相关分析表明(图8(c)、图9(c)),在江河源区高寒草甸生态区、青藏高原东部暗针叶林、高寒草甸生态区和青海东部农牧生态区内,偏相关系数在-0.3~0.3之间的区域所占面积分别为80.27%,99.68%和81.15%,说明这些地区NEP与太阳辐射之间的关系较弱,NEP对太阳辐射的响应不显著。在青藏高原东部暗针叶林、高寒草甸生态区、江河源区高寒草甸生态区和青海东部农牧生态区内有少部分地区偏相关系数在0.3~0.5之间,表明太阳辐射的增加会加快植被光合作用的效率,提高了该区域NEP。羌塘高原高寒草原生态区、可可西里半荒漠、荒漠生态区和柴达木盆地荒漠、盐壳生态区NEP与太阳辐射呈负相关的面积均达98%以上,这些地区海拔较高,太阳辐射过强,增加了水分蒸发,不利于植被生长,从而使得该地区NEP降低。
4 结论
本研究利用长时间序列遥感数据,分析了2001—2020年共20 a间三江源区地区NEP的时空变化特征,并探讨了NEP与气温、降水和太阳辐射等气候因素之间的关系。结果表明:
1)三江源生态系统NEP总体上呈现东南高、西北低、从东南向西北逐渐递减的空间分布格局,不同生态区之间差异显著。三江源区NEP的平均值为120.93 gC/(m2·a),碳汇区(NEP>0)占研究区域总面积的99.89%; 碳源区(NEP<0)仅占总面积的0.11%,因此,三江源地区是重要的陆地生态系统碳汇区。
2)通过20 a的长时间序列上看出,三江源生态系统NEP总体上呈增长趋势,年增长率为1.13 gC/(m2·a),年平均值在104~140 gC/(m2·a)之间波动,三江源区植被碳汇功能逐步增强。
3)从空间变化格局上看,20 a间三江源生态系统NEP呈增长趋势的地区占研究区域总面积的95.05%。变化趋势以明显变好为主,碳汇功能随着生态系统的稳定变好而逐步增强,生态工程等人为活动对植被NEP的改善作用明显。
4)三江源NEP与降水呈正相关,与气温和太阳辐射呈负相关。99.79%的区域NEP与降水呈正相关关系,其中极显著相关的区域占14.13%,主要分布在江河源区高寒草甸生态区的西部和南部; 气温对NEP产生负面影响的区域占总面积的70.05%,主要发生在青藏高原东部暗针叶林、高寒草甸生态区、青海东部农牧生态区和江河源区高寒草甸生态区的中部和东南部地区。
综合来看,生态系统NEP的动态变化受多种因素的共同影响,自然环境条件改变和人为因素均对三江源生态系统碳源/汇发展和变化产生重要影响,需要建立多种耦合模型进行更加精准的分析和验证。
参考文献
Recent pause in the growth rate of atmospheric CO2 due to enhanced terrestrial carbon uptake
[J].
DOI:10.1038/ncomms13428
[本文引用: 1]

Terrestrial ecosystems play a significant role in the global carbon cycle and offset a large fraction of anthropogenic CO2 emissions. The terrestrial carbon sink is increasing, yet the mechanisms responsible for its enhancement, and implications for the growth rate of atmospheric CO2, remain unclear. Here using global carbon budget estimates, ground, atmospheric and satellite observations, and multiple global vegetation models, we report a recent pause in the growth rate of atmospheric CO2, and a decline in the fraction of anthropogenic emissions that remain in the atmosphere, despite increasing anthropogenic emissions. We attribute the observed decline to increases in the terrestrial sink during the past decade, associated with the effects of rising atmospheric CO2 on vegetation and the slowdown in the rate of warming on global respiration. The pause in the atmospheric CO2 growth rate provides further evidence of the roles of CO2 fertilization and warming-induced respiration, and highlights the need to protect both existing carbon stocks and regions, where the sink is growing rapidly.
沙化和退化状态对甘南草地生态系统固碳的影响
[J].
Effects of desertification and degradation on carbon sequestration of grassland ecosystem in Gannan
[J].
中国及全球陆地生态系统碳源汇特征及其对碳中和的贡献
[J].
Terrestrial carbon sinks in China and around the world and their contribution to carbon neutrality
[J].
The biota and the world carbon budget
[J].
青海省植被净初级生产力(NPP)时空格局变化及其驱动因素
[J].
Spatial and temporal patterns of planting NPP and its driving factors in Qinghai Province
[J].
2001—2017年三江源区典型草地群落碳源/汇模拟及动态变化分析
[J].
Simulation and dynamic change of carbon source/sink in the typical grassland communities in the Three River Source area from 2001 to 2017
[J].
三江源植被碳利用率动态变化及其对气候响应
[J].
Study on spatio-temporal dynamics of vegetation carbon use efficiency and its response to climate factors in Three-River Headwaters region
[J].
基于MODIS GPP/NPP数据的三江源地区草地生态系统碳储量及碳汇量时空变化研究
[J].DOI:10.16258/j.cnki.1674-5906.2015.01.002 [本文引用: 1]
Spatial-temporal change of carbon storage and carbon sink of grassland ecosystem in the Three-River Headwaters region based on MODIS GPP/NPP data
[J].
三江源自然保护区森林植被层碳储量及碳密度研究
[J].
Study on carbon storage and carbon density of forest vegetation in Sanjiangyuan Nature Reserve
[J].
2001—2010年三江源区草地净生态系统生产力估算
[J].
Net ecosystem production of alpine grasslands in the Three-River Headwaters region during 2001—2010
[J].
30 m resolution global annual burned area mapping based on Landsat images and Google Earth Engine
[J].
DOI:10.3390/rs11050489
URL
[本文引用: 1]
Heretofore, global Burned Area (BA) products have only been available at coarse spatial resolution, since most of the current global BA products are produced with the help of active fire detection or dense time-series change analysis, which requires very high temporal resolution. In this study, however, we focus on an automated global burned area mapping approach based on Landsat images. By utilizing the huge catalog of satellite imagery, as well as the high-performance computing capacity of Google Earth Engine, we propose an automated pipeline for generating 30-m resolution global-scale annual burned area maps from time-series of Landsat images, and a novel 30-m resolution Global annual Burned Area Map of 2015 (GABAM 2015) was released. All the available Landsat-8 images during 2014–2015 and various spectral indices were utilized to calculate the burned probability of each pixel using random decision forests, which were globally trained with stratified (considering both fire frequency and type of land cover) samples, and a seed-growing approach was conducted to shape the final burned areas after several carefully-designed logical filters (NDVI filter, Normalized Burned Ratio (NBR) filter, and temporal filter). GABAM 2015 consists of spatial extent of fires that occurred during 2015 and not of fires that occurred in previous years. Cross-comparison with the recent Fire_cci Version 5.0 BA product found a similar spatial distribution and a strong correlation ( R 2 = 0.74) between the burned areas from the two products, although differences were found in specific land cover categories (particularly in agriculture land). Preliminary global validation showed the commission and omission errors of GABAM 2015 to be 13.17% and 30.13%, respectively.
基于Google Earth Engine平台的三江源地区生态环境质量动态监测与分析
[J].
DOI:10.12082/dqxxkx.2019.190095
[本文引用: 2]
三江源是中国陆地生态系统最脆弱和敏感的区域之一,一旦遭到破坏则不可逆转。受三江源地区多云等不利气象条件的影响,很难获取大范围尺度上季相一致的、无云的Landsat遥感影像。本文利用Google Earth Engine平台,对1990-2015年的相同季节的3766景Landsat影像进行像元级融合并重构最小云量影像集,借助GEE的并行云端计算,快速得到了能够反映生态环境质量的遥感生态指数(RSEI),对三江源地区的生态环境质量进行了评价与监测。三江源时空变化与差异分析表明:1990-2000年生态环境质量呈快速下降状态,RSEI平均值从0.588下降到了0.505,生态环境质量变化以轻度恶化为主;2000-2015年生态环境质量下降速度变缓,并于2015年呈现变好态势,生态环境质量变化以不变为主,且轻度恶化面积大幅减少;该地区的生态环境状况呈现出空间分异,自西向东,生态状况变差。基于GEE平台在三江源地区的实验结果表明,GEE可以作为大区域范围的生态环境质量评价与监测的计算平台。
Monitoring and assessment of the eco-environment quality in the Sanjiangyuan region based on Google Earth Engine
[J].
中国生态区划方案
[J].
Scheme of ecological regionalization in China
[J].
基于GEE的杭州湾慈溪段潮滩提取及时空变化分析
[J].
Extraction and spatio-temporal change analysis of the tidal flat in Cixi section of Hangzhou Bay based on Google Earth Engine
[J].
内蒙古草地生态系统碳源/汇时空格局及其与气候因子的关系
[J].
DOI:10.11821/dlxb201601002
[本文引用: 1]
草地净生态系统生产力(NEP)能够表征草地生态系统的固碳能力,直接定性定量地描述草地生态系统的碳源/汇性质和大小.因此,研究区域尺度草地生态系统NEP具有重要的实践意义.基于卫星遥感资料,地面气象观测资料及实地采样数据,结合光能利用率模型估算了2001-2012年内蒙古草地生态系统净初级生产力(NPP).同时,应用土壤呼吸模型估算了逐月平均土壤呼吸量(Rs),进而估算内蒙古草地净生态系统生产力(NEP).研究揭示了2001-2012年内蒙古草地生态系统NPP,NEP年际变化规律,气候因子的年际变化规律,以及草地NPP,NEP与主要气候因子的关系.结果表明:2001年以来,内蒙古草地生态系统整体发挥碳汇效应,净碳汇总量达到0.55 Pg C,年均固碳率约为0.046 Pg C/a;研究区大部分草地NPP,NEP与降水均呈正相关关系,与温度相关性不显著,内蒙古草地生态系统仍有巨大的固碳潜力.
Spatial-temporal features of carbon source-sink and its relationship with climate factors in Inner Mongolia grassland ecosystem
[J].
DOI:10.11821/dlxb201601002
[本文引用: 1]
In this paper, field sampling data, remote sensing data, and ground meteorological observation data were used to estimate the net primary productivity (NPP) in the grassland ecosystem in Inner Mongolia from 2001 to 2012 based on a light use efficiency model. The spatiotemporal distribution of the NEP in the Inner Mongolia grassland ecosystem was then analyzed by estimation of the NPP and soil respiration from 2001 to 2012. This paper also investigated the response of the NPP and NEP to main climatic variables on the spatial and temporal scales from 2001 to 2012. Results showed that most of the grassland area in Inner Mongolia has functioned as a carbon sink since 2001 and that the annual carbon sequestration rate amounts to 0.046 Pg C·yr-1. The total net carbon sink of the Inner Mongolia grassland ecosystem over the 12-year period reached 0.557 Pg C. The carbon sink area accounted for 60.28% of the total grassland area and sequestered 0.692 Pg C, whereas the C source area accounted for 39.72% of the total grassland area and released 0.135 Pg C. The NPP and NEP of the Inner Mongolia grassland ecosystem have more significant correlations with precipitation than with temperature, and the Inner Mongolia grassland ecosystem has great potential for carbon sequestration.
甘肃白龙江流域净生态系统生产力时空变化
[J].
Temporal and spatial distribution of net ecosystem productivity in the Bailongjiang Watershed of Gansu Province
[J].
2001—2015年青藏高原草地碳源/汇时空变化及其与气候因子的关系
[J].
Spatiotemporal features of carbon source-sink and its relationship with climate factors in Qinghai-Tibet Plateau grassland ecosystem during 2001—2015
[J].
Carbon balance in an alpine steppe in the Qinghai-Tibet Plateau
[J].DOI:10.1111/jipb.2009.51.issue-5 URL [本文引用: 1]
中国西北干旱区植被碳汇估算及其时空格局
[J].
Estimation and spatial-temporal characteristics of carbon sink in the arid region of northwest China
[J].
2000—2010年东北三省碳源汇时空动态遥感研究
[J].
Temporal-spatial variations of carbon sink / source in Northeast China from 2000 to 2010
[J].
桂西北喀斯特区域植被变化趋势及其对气候和地形的响应
[J].
Trends in vegetation and their responses to climate and topography in northwest Guangxi
[J].
退耕还林草20年来榆林市植被覆盖度时空变化及影响因素分析
[J].
Spatio-temporal changes and influencing factors of vegetation coverage in Yulin city during the past 20 years since the implementation of the “Grain for Green” Program
[J].
基于MODIS NDVI数据的粤港澳大湾区植被覆盖时空演变
[J].
Temporal-spatial evolution of vegetation coverage in Guangdong-HongKong-Macao Greater Bay Area based on MODIS NDVI data
[J].
基于MODIS-NDVI的地表植被时空变化特征及其与环境因子的关系
[J].
Temporal and spatial variation characteristics of surface vegetation and its relationship with environmental factors based on MODIS-NDVI
[J].
三江源地区人类活动对植被覆盖的影响
[J].
Influence of human activities on variation of vegetation cover in the Three-River Source region
[J].
2005—2009年三江源自然保护区生态保护和建设工程生态成效综合评估
[J].
DOI:10.11821/dlyj201309007
[本文引用: 1]
本文评价了三江源自然保护区生态系统宏观结构及涵养水源、保持水土、保护生物多样等主要生态服务功能,分析了自然保护区生态保护与建设工程的生态成效及其原因。结果显示,工程实施后,各自然保护区的土地覆被转类指数明显增加,生态系统宏观状况好转;保护区内草地生产力皆呈增加趋势,水域面积增加,食物供给能力提高,栖息地生境好转。森林类保护区的森林面积减少趋势得到遏制;湿地类保护区的湿地面积多呈增加趋势;草地类保护区的草地减少趋势缓解,荒漠化明显遏制,草地植被覆盖度有所增加;冰川类保护区多条冰川出现明显退缩导致冰川融水增多,有利于雪线以下草地净初级生产力的增加。
Integrated assessment on the effectiveness of ecological conservation in Sanjiangyuan National Nature Reserve
[J].
DOI:10.11821/dlyj201309007
[本文引用: 1]
Sanjiangyuan, located in Qinghai Province, is known as the water tower of China. This paper assessed the ecological effectiveness of those projects in Sanjiangyuan, through comparisons of ecological macrostructure, soil erosion and conservation, and grassland production before and after the projects. The natural and human driving factors for effectiveness were also analyzed. The results showed that land cover change index increased obviously, which represented the ecosystem restoration in Sanjiangyuan National Nature Reserves. The increased grassland net primary production and expanded water area were helpful to supply enough food and water to wildlife. Moreover, the declining trends of forest area were restrained in forest related nature reserves. In wetland related nature reserves, wetland area was increased. In grassland related reserves, decreasing trends of grassland and enlarging desertification were also restrained, and wetland expansion and increasing vegetation cover were obvious. In glacier related reserves, retreating glacier and thawing permafrost results to increasing water were useful to vegetation growth; however, it is uncertain in the long term.
2000—2015年青海省不同功能区NDVI时空变化分析
[J].
DOI:10.11733/j.issn.1007-0435.2017.04.003
[本文引用: 1]
基于2000-2015年MOD13Q1的NDVI陆地专题的产品,揭示了青海省不同功能区植被时空分布特征及变化规律,应用趋势分析法阐述过去16年不同功能区NDVI的变化规律,及利用变异系数揭示NDVI稳定性分布规律。结果表明:青海省植被NDVI表现为东南偏高,西北偏低,由东南向西北、由东向西逐渐递减的分布特征。三江源地区NDVI频度分布呈"M"型的双峰模型,柴达木盆地为频度分布最低的单峰模型,东部农业区与环湖地区相似且频度略高的单峰模型。从CV分析,高稳定性地区分布在东部农业区和环湖地区,低稳定性地区分布在柴达木盆地边缘和青海湖南部。由趋势分析可知,过去16年青海省NDVI呈波动性缓慢上升趋势,变化率为0.012·10a<sup>-1</sup>。东部农业区和柴达木盆地增加趋势显著。本文揭示了气候变化和人为因素双重作用下青海省不同功能区植被NDVI变化规律,为各区生态保护提供基础数据和科学参考。
Spatial and temporal variation of NDVl in different functional areas of Qinghai from 2000 to 2015
[J].
基于NDVI的三江源地区植被生长对气候变化和人类活动的响应研究
[J].
Response of vegetation to climate change and human activity based on NDVl in the Three-River Headwaters region
[J].
2000-2011年三江源区植被覆盖时空变化特征
[J].基于MODIS-NDVI 数据,辅以线性趋势分析、Hurst 指数及偏相关系数等方法,本文从三个尺度分析了近12 年三江源区植被覆盖时空变化特征、未来趋势及其驱动因素。结果表明:(1) 近12 年三江源区植被覆盖呈现增加趋势,增速为1.2%/10a,其中长江源区、黄河源区植被均呈增加趋势,而澜沧江源区植被呈下降趋势。(2) 三江源区植被覆盖具有显著的区域差异,且NDVI频度呈现“双峰”结构。(3) 近12 年三江源区植被覆盖呈增加趋势和减少趋势的面积分别占64.06%和35.94%,且表现为源区北部增加、南部减少的空间格局。(4) 三江源区植被变化的反向特征显著,植被变化由改善趋势转为退化趋势的区域主要分布在长江源区和黄河源区的北部,而由退化趋势转为改善趋势的区域主要分布在澜沧江源区。(5) 三江源区植被对降水和潜在蒸散的响应存在时滞现象,而对气温的响应不存在时滞现象。(6) 三江源区植被覆盖的增加主要归因于气候暖湿化以及生态保护工程的实施。
The spatial-temporal changes of vegetation coverage in the Three-River Headwater region in recent 12 years
[J].The Three-River Headwater Region is the source areas of the Yangtze River, the Yellow River, and the Lancang River. The region is not only of key importance to the ecological security of China. Due to climate change and human activities, ecological degradation occurred in this region. Therefore, "The nature reserve of Three-River Source Regions" was established, and "The project of ecological protection and construction for the Three-River Headwater Nature Reserve" was implemented by Chinese government. This study, based on MODIS-NDVI and climate data, aims to analyze the spatial-temporal changes of vegetation coverage and its driving factors in the Three-River Headwater Region between 2000 and 2011 from three dimensions. Linear regression, Hurst index and partial correlation analysis were employed. The results showed that: (1) In the past 12 years (2000-2011), the NDVI of the study area increased, with a linear tendency being 1.2%/10a, of which the Yangtze and the Yellow river source regions presented an increasing trend, while the Lancang River source region showed a decreasing trend. (2) Vegetation coverage presented an obvious spatial difference in the Three-River Headwater Region, and NDVI frequency was featured by a bimodal structure. (3) The vegetation coverage improved area was larger than the degraded area, being 64.06% and 35.94% respectively in the 12 years, and presented an increase pattern in the north and a decrease one in the south. (4) The reverse characteristic of vegetation coverage change is significant. In future, the degradation trends will be mainly found in the Yangtze River Basin and north of the Yellow River, while the improving trend areas are mainly distributed in the Lancang River Basin. (5) The response of vegetation coverage to precipitation and potential evapotranspiration has time lag, while the temperature does not have. (6) The increased vegetation coverage is mainly attributed to the warm-wet climate change and the implementation of the ecological protection project.
Climate change regionalization in China (1961—2010)
[J].DOI:10.1007/s11430-014-4889-1 URL [本文引用: 1]
NDVI-indicated long-term vegetation dynamics in Mongolia and their response to climate change at biome scale
[J].DOI:10.1002/joc.4286 URL [本文引用: 1]
Water and heat availability are drivers of the aboveground plant carbon accumulation rate in alpine grasslands on the Tibetan Plateau
[J].DOI:10.1111/geb.v29.1 URL [本文引用: 2]
Water and nitrogen availability co-control ecosystem CO2 exchange in a semiarid temperate steppe
[J].
DOI:10.1038/srep15549
[本文引用: 1]
Both water and nitrogen (N) availability have significant effects on ecosystem CO2 exchange (ECE), which includes net ecosystem productivity (NEP), ecosystem respiration (ER) and gross ecosystem photosynthesis (GEP). How water and N availability influence ECE in arid and semiarid grasslands is still uncertain. A manipulative experiment with additions of rainfall, snow and N was conducted to test their effects on ECE in a semiarid temperate steppe of northern China for three consecutive years with contrasting natural precipitation. ECE increased with annual precipitation but approached peak values at different precipitation amount. Water addition, especially summer water addition, had significantly positive effects on ECE in years when the natural precipitation was normal or below normal, but showed trivial effect on GEP when the natural precipitation was above normal as effects on ER and NEP offset one another. Nitrogen addition exerted non-significant or negative effects on ECE when precipitation was low but switched to a positive effect when precipitation was high, indicating N effect triggered by water availability. Our results indicate that both water and N availability control ECE and the effects of future precipitation changes and increasing N deposition will depend on how they can change collaboratively in this semiarid steppe ecosystem.
The impacts of precipitation increase and nitrogen addition on soil respiration in a semiarid temperate steppe
[J].DOI:10.1002/ecs2.1655 URL [本文引用: 1]
降水和氮沉降对草地生态系统碳循环影响研究进展
[J].
DOI:10.11733/j.issn.1007-0435.2018.02.003
[本文引用: 1]
随着全球变化的不断加剧,陆地生态系统碳循环备受关注,近年来预测未来降水格局变化和氮沉降增加对草地生态系统碳循环影响的研究不断深入。本文综述了全球背景下降水格局变化和氮沉降增加对草地生态系统碳循环的影响及其内在机理。降水量、强度、时间分布和频度以及氮沉降量、频度和形态的变化,通过改变土壤含水量、土壤温度、土壤养分及微生物活性影响生态系统的物种组成和结构,最终影响生态系统水平的碳循环。降水格局变化和氮沉降增加对生态系统水平碳循环是否存在交互作用没有统一的结论,因此在将来的研究中应采用多因子的实验,才能够更好的研究未来全球变化下生态系统碳循环的响应机理。
Advances in the influences of precipitation and nitrogen deposition change on the carbon cycle of grassland ecosystem
[J].
黄河流域1982—2015年不同气候区植被时空变化特征及其影响因素
[J].
Vegetation changes and influencing factors in different climatic regions of Yellow River basin from 1982 to 2015
[J].
中国西北地区植被NPP多时间尺度变化及其对气候变化的响应
[J].
Multi-time scale changes of vegetation NPP in six provinces of northwest China and their responses to climate change
[J].
