

0 引言
在植被定量遥感中,红边位置是绿色植被在波长680~780 nm之间反射光谱中最大斜率的点,也是一阶导数光谱最大值所对应的波长。已有研究表明,红边波段有利于植被叶绿素含量、生物量和相对含水量等的研究[15],能有效反映植被特有的光谱特性[16⇓⇓-19]。目前除了高光谱传感器带有红边波段,越来越多的多光谱遥感卫星也设计了红边波段,德国Rapid Eye、美国WorldView-2/3和欧空局Sentinel-2,2018年6月2日中国发射的高分六号(GF-6)卫星成为国内首个提供红边波段(710 nm和750 nm)用于植被观测的低轨光学遥感卫星[17]。自高分六号卫星发射以来,对它的应用研究也逐步开展,但基于高分六号卫星数据的红边波段在红树林提取上的贡献度和应用价值方面鲜少有人研究。
鉴于此,为探究高分六号卫星数据的红边波段在红树林提取上的贡献度,通过研究典型地物反射光谱曲线,由植被强吸收的波段建立基线,基线之上反射率的平均值定义了适用于高分六号卫星数据的潮间红树林指数(intertidal mangrove forest index,IMFI),同时建立了融合红边波段的红边归一化植被指数(red-edge normalized difference vegetation index,RENDVI),这2种指数与归一化植被指数(normalized difference vegetation index,NDVI)和归一化水体指数(normalized difference water index,NDWI)等常用指数通过箱线图进行对比分析,并基于IMFI和RENDVI构建决策树模型对海南省最大的红树林区域东寨港东南部的典型红树林进行提取,最后通过总体精度和Kappa系数对提取结果进行分析验证,为国产红边卫星数据在生态方面的应用提供参考。
1 研究区及数据源
1.1 研究区概况
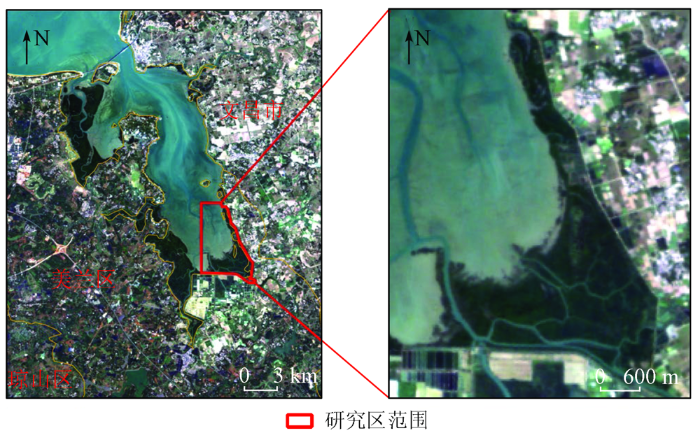
研究区选取了海南省东寨港东南部的一个典型区域,东寨港位于海南岛的东北部(E110°32'0″~110°37'0″,N19°51'0″~20°1'0″)(如图1所示),地处热带北缘,属于热带季风气候,年平均气温为23.8 ℃,年降水量为1 700~1 933 mm,5—9月为雨季。东寨港于1986年升级为国家级红树林自然保护区,是中国第一个国家级红树林自然保护区,1992年被列入国际重要湿地名录,是拉姆萨尔公约规定的国际重要湿地,总面积为3 338 hm2,2019年红树林面积约1 771 hm2。
图1
1.2 数据选取
高分六号卫星是一颗三轴稳定的对地观测卫星,于2018年6月2日成功发射,是我国第一颗设置红边波段的多光谱遥感卫星,它配置了2 m全色/8 m多光谱高分辨率传感器(PMS)和16 m多光谱中分辨率宽幅传感器(WFV),其中WFV传感器观测幅宽为800 km。高分六号卫星可以获取从海岸波段到近红外波段的多光谱遥感数据,具有多传感器在光谱-空间-时间等多维综合观测信息方面的优势,具有高空间分辨率、宽覆盖、高质量成像、高效能成像、高国产化率等特点,已成为我国农业生产监测、自然资源调查、农村人居环境改善、防灾减灾和公共安全等遥感业务领域的主要数据源之一[25]。
为了准确提取红树林的遥感信息,选择高分六号卫星数据时考虑: 在春夏季,生长在潮间带上以互花米草等为主的植物生长旺盛,叶片叶绿素含量较高,其光谱反射率和红树林的比较接近,在光谱曲线中难以找到区分的波段,因此容易引起两者的混淆; 而在秋冬季,以互花米草等为主的植物叶片枯黄,其光谱反射率和红树林有着较大的差异,能够较准确地将两者区分开来[26]。因此,本研究选取冬季(2021年1月14日)在研究区域无云量覆盖的高分六号卫星数据。为了准确获取验证样本点,通过中国海事服务网(www.cnss.com.cn)查询与东寨港距离最近且具有潮汐表数据的铺前港作为潮汐信息获取的依据,最终选择低潮时、云量覆盖率低的(2020年8月10日)高分二号(GF-2)卫星数据。综上,本研究选取的研究数据为空间分辨率16 m的GF-6 WFV卫星数据; 实验和验证样本数据为空间分辨率1 m的GF-2 PMS卫星数据,选取数据的主要参数信息详见表1。
表1 卫星数据描述
Tab.1
| 卫星 | 传感器 | 采集时间 | 产品序列号 | 11: 00 对应潮 高/cm | 12: 00 对应潮 高/cm |
|---|---|---|---|---|---|
| GF-2 | PMS1 | 2020-08-10 11: 29: 34 | 4982331 | 113 | 130 |
| 2020-08-10 11: 29: 37 | 4982332 | ||||
| PMS2 | 2020-08-10 11: 29: 34 | 4982394 | |||
| 2020-08-10 11: 29: 37 | 4982395 | ||||
| GF-6 | WFV | 2021-01-14 11: 44: 49 | 1120071535 | 181 | 164 |
1.3 样本点构建
1.3.1 标准样本点
为了便于比较研究区内典型地物的反射光谱曲线特征,基于高空间分辨率的高分二号卫星数据,通过目视解译在研究区内针对典型地物选取了纯像元标准样本点,其中水体31个样本点,陆生植被59个样本点,裸地17个样本点,草地25个样本点,潮间红树林56个样本点,红树林50个样本点。
1.3.2 验证样本点
为了更好地验证红树林提取的准确性,一共采取了2种验证方式: 一种是通过制图的方式进行典型区域的空间分布对比分析; 一种是基于定量的方式通过混淆矩阵选取应用较广泛的总体精度、Kappa系数、生产者精度和用户精度进行验证。针对第二种定量的验证手段,利用目视解译在高分二号高分辨率遥感数据中随机均匀地选择红树林93个、水体97个样本点作为检验样本点进行精度评价。
2 研究方法
2.1 总体技术路线
本研究的总体技术路线主要是高分卫星数据预处理、样本点构建、指数构建、精度验证以及制图分析,具体如图2所示。
图2
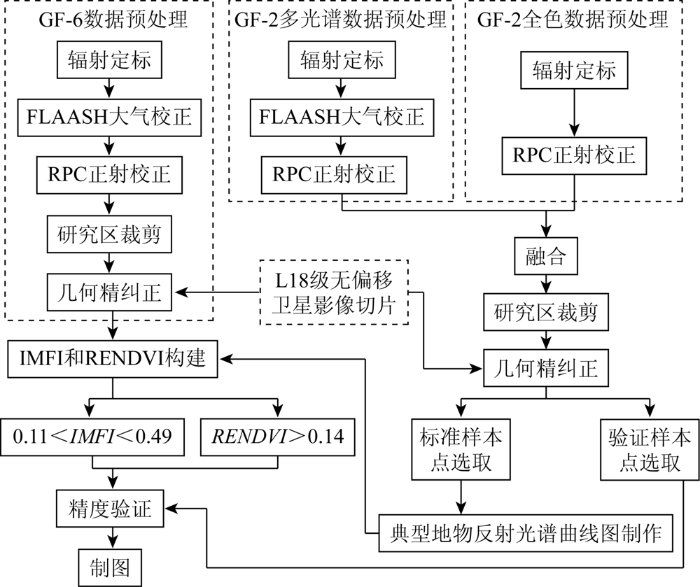
2.2 高分卫星数据预处理
高分六号卫星数据的预处理包括辐射定标、FLAASH大气校正、RPC正射校正、研究区裁剪和几何精纠正。高分二号卫星数据多光谱影像的预处理包括辐射定标、FLAASH大气校正和RPC正射校正; 全色影像的预处理包括辐射定标和RPC正射校正,预处理后的全色和多光谱影像进行融合、研究区裁剪和几何精纠正。其中,几何精纠正的辅助数据基于L18级无偏移的卫星影像切片数据。
2.3 红树林提取指数构建
2.3.1 典型地物反射光谱曲线构建
为了便于比较研究区内典型地物的反射光谱特征,基于标准样本点构建典型地物反射光谱曲线,如图3所示。图3为研究区内潮间红树林、红树林、陆生植被、裸地、水体和滩涂典型地物平均反射光谱曲线。红树林与陆生植被光谱曲线具有典型的植被反射率特征,红树林由于处于湿地环境,其红光波段和红边波段1的反射率明显低于陆生植被; 潮间红树林由于具有周期性被潮水淹没的特点,所有样本点在高潮时其反射光谱曲线并未能够很好拟合,分布在红树林与水体反射光谱曲线之间(图3中的潮间红树林1—3分别为选取的典型潮间红树林样本),虽然反射光谱总体上表现出了植被的特征,但因为水体的影响,弱化了其植被特征趋势,当潮高达到一定值,NDVI将接近于0,红光波段和近红外波段之间的差异显著降低,但经观察高分六号卫星数据增加的2个红边波段仍然出现了反射峰; 滩涂和水体的可见光区域反射率高于植被,而红边波段和近红外波段区域反射率则明显低于植被。
图3
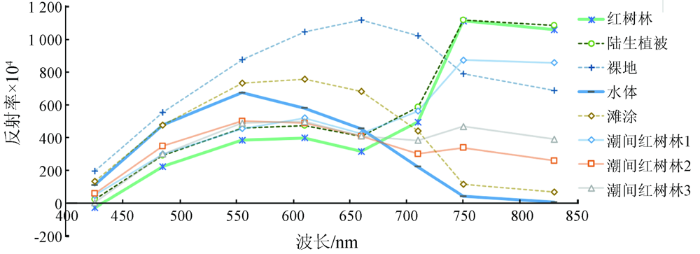
图3
研究区典型地物反射光谱曲线
Fig.3
Reflectance spectral curves of typical land cover types in study area
2.3.2 常用植被和水体指数
式中:
2.3.3 IMFI构建
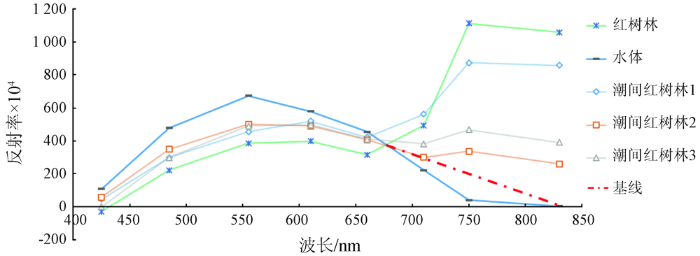
由于红树林具有周期性被潮水淹没的特点,在高潮时,其反射光谱曲线分布在红树林与水体反射光谱曲线之间,无法很好拟合,且极大损失了植被光谱特性。通过典型地物反射光谱曲线的研究,发现高分六号卫星数据增加的2个红边波段,使得被潮水淹没的红树林能够在红光波段与近红外波段之间形成波峰,但其波峰并不十分明显到具备通过某种植被指数能够区分潮间红树林和水体的能力。
针对本研究的数据源及应用场景,基于基线理论提出了一种适用于高分六号卫星数据的IMFI。水体和红树林2条反射波谱曲线在红光波段和红边波段1之间有交点,通过计算该交点的波长和反射率作为基线的起点,水体在近红外波段的反射率作为基线的终点,确定基线后分别计算红边波段1和红边波段2在基线上的反射率(如图4所示)。最后利用红边波段1、红边波段2和近红外波段与基线之间反射率距离的均值定义为IMFI,其具体计算公式为:
式中:
图4
2.3.4 RENDVI构建
由研究区典型地物反射光谱曲线可以看到潮间红树林和红树林在红边波段1和近红外波段呈现下降趋势,被潮水覆盖的红树林潮高越高,红树林的反射率受水体的影响越大,其反射光谱曲线的变化趋势越接近于水体。NDVI是通过近红外和红光波段反射光谱之间的变化来体现植被特征的,因此NDVI不适用于具有湿地环境特征的红树林的准确提取。经研究典型地物反射光谱曲线发现,在高潮时红边波段1和红光波段之间呈明显变化趋势,因此通过红边波段1和红光波段构建RENDVI,其具体计算公式为:
2.4 IMFI和RENDVI与常用指数定量比较
图5
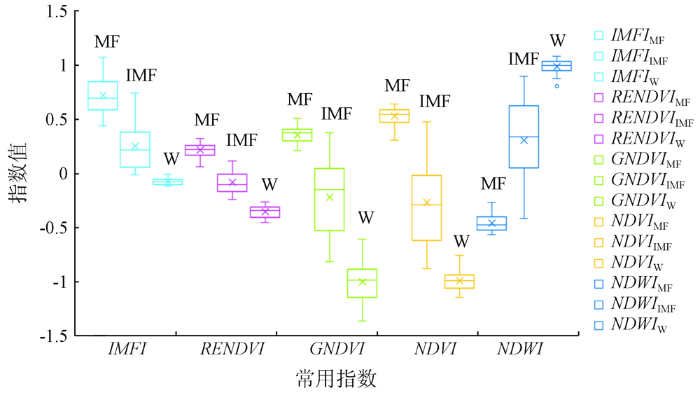
图5
红树林、潮间红树林和水体各指数值的箱线图
Fig.5
Boxplot of different index values of mangrove forest,intertidal mangrove forest and water
从图5中可知,所有潮间红树林样本点的IMFI值均高于水体的IMFI值,且潮间红树林的最小值基本等于水体最大值,红树林和潮间红树林样本点的IMFI值混在一起的较多,由此可见,IMFI是潮间红树林和水体分离的优选指标,但并不适用于红树林和潮间红树林分离,但RENDVI却能够较好地对红树林和潮间红树林进行分离。同时,可以看到红树林、潮间红树林和水体样本点在GNDVI,NDVI和NDWI中的值都很明显混在一起,这足以显示出IMFI和RENDVI在潮间红树林与水体分离、红树林和潮间红树林分离中对比其他常用指数具有比较好的优势。
2.5 决策树模型构建
首先通过0.11<IMFI<0.49条件将水体剔除,保留潮间红树林区域; 再通过RENDVI>0.14条件提取红树林区域,2个区域取并集即为最终的红树林区域。其中,IMFI 和RENDVI的阈值是基于样本数据经过反复试验确定。
3 结果与分析
为了更好地分析研究区域红树林提取的精度,从空间定性和定量2个方面对提取结果进行精度分析与评价。
3.1 空间定性精度分析
利用高分二号数据与红树林提取结果通过制图的手段进行红树林空间分布分析,并选取了2个典型区域(a区域和b区域)通过局部放大对结果进行定性分析,提取结果如图6所示。
图6
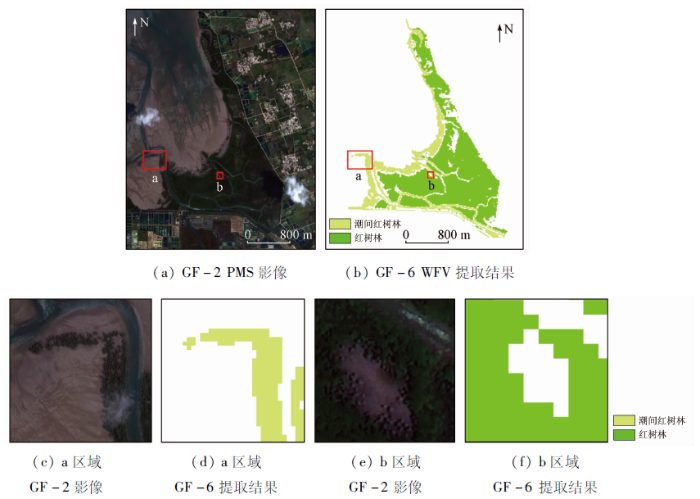
对比a区域提取结果可以看出通过本文的提取方法可以很好地将潮间红树林识别出来,其边界轮廓得到很好的贴合; 对比b区域提取结果可以看出对于红树林区域内的空洞也能够很好地识别,如果是人工勾画的方式,这种空洞经常性被忽略。空间定性分析结果表明本文的研究方法能够很好地提取红树林区域,且极大地凸显了利用遥感技术手段充分保留数据客观性的优势。
3.2 定量精度分析
基于验证样本点对研究区红树林提取结果进行定量精度分析,利用混淆矩阵评价红树林提取结果,评价结果如表2所示。通过本文方法对红树林提取的总体精度达到95%,Kappa系数为0.90。
表2 红树林提取精度统计
Tab.2
| 覆盖类型 | 分类结果 | |||
|---|---|---|---|---|
| 红树林 | 其他 | 总计 | 生产者精度/% | |
| 红树林 | 89 | 4 | 93 | 96 |
| 其他 | 5 | 91 | 96 | 95 |
| 总计 | 94 | 95 | 189 | — |
| 用户精度/% | 95 | 96 | — | — |
4 结论与讨论
以高分六号卫星数据为数据源,充分利用高分二号数据高空间分辨率的特点,以定量遥感理论为基础并辅以基线理论,构建适合高分六号卫星数据的研究区红树林提取指数,结合决策树模型最终实现对研究区的潮间红树林和红树林的准确提取。主要结论如下:
1)红树林周期性被潮水淹没的特点使得潮间红树林的光谱曲线在水体与红树林的标准光谱曲线之间分布,且相对分散。
2)IMFI和RENDVI可反映红边波段与近红外波段反射光谱的差异性,能够更好地对潮间红树林、红树林和水体进行分离。其中IMFI能够有效分离潮间红树林和水体,有利于解决高潮时红树林被水淹没无法准确识别的问题; RENDVI利用红边波段的加入,解决红树林在提取时由于湿地特性其近红外和红光波段之间差异性降低无法准确识别的问题。
3)基于IMFI和RENDVI构建的决策树模型可有效提取红树林分布信息,其总体精度为95%,Kappa系数为0.90。
本研究的误差主要受数据源光谱波段信息量和空间分辨率信息贡献的限制,事实证明,该方法可有效从高潮卫星遥感数据中提取红树林。但是,算法的普适性一直是定量遥感界的难题,尽管该红树林提取方法的特征阈值在时空拓展性方面有待进一步研究,后续需要进一步通过选取多时空的数据进行混合验证。但针对本文的研究区域,足以表明高分六号卫星数据因红边波段的引入在红树林提取上发挥了重要作用,具有很大的应用潜力,本文的研究思路及方法可以为国产红边卫星数据在生态方面的应用提供参考。
参考文献
中国红树林湿地资源及其保护
[J].
The mangrove wetland resources and their conservation in China
[J].
DOI:10.11849/zrzyxb.2001.01.005
[本文引用: 1]

Mangrove wetlands are evergreen tree and shrub communities mainly consisting of mangrove plants, usually growing on the upper part of tidal flat of tropical and subtropical coasts, and periodically inundated by tidal water. Mangroves are naturally distributed in Hainan, Guangxi, Guangdong, Taiwan and Fujian provinces, with an area of about 15,000 ha.There are 26 exclusive mangrove species and 11 semi exclusive mangrove species in China. The mangrove wetland in China has low direct economic values, but plays an important role in protecting coastline, keeping coastal biodiversity and fishery resources, clarifying sea water, beautifying environment, and so on. It is a coastal ecologically critical area that is specially easy to be undervalued.The mangrove areas have been sharply reduced because of humans unreasonable exploiting activities,such as des troying mangroves for agricultural and salt fields, for aquaculture ponds and for urban construction, and the mangrove wetland resources are in danger and need urgent efficient management and protection. Eighteen mangrove natural reserves have been established. It is essential to attract scientists to take an active part in scientific researches on mangrove wetlands, to spread the knowledge about mangrove environmental functions, to reverse its decline trend and to achieve the ecological restoration and sustainable deve lopment of mangrove wetland ecosystem.
多源遥感影像红树林信息提取方法比较
[J].
Comparison of different metho-ds of mangrove extraction from multi-source remote sensing images
[J].
中国红树林湿地资源、保护现状和主要威胁
[J].DOI:10.16258/j.cnki.1674-5906.2016.07.021 [本文引用: 1]
Resources,conservation status and main threats of mangrove wetlands in China
[J].
An object-based classification of mangroves using a hybrid decision tree-support vector machine approach
[J].DOI:10.3390/rs3112440 URL [本文引用: 1]
Monitoring mangrove forests: Are we taking full advantage of technology?
[J].DOI:10.1016/j.jag.2017.07.004 URL [本文引用: 1]
Satellite remote sensing of mangrove forests: Recent advances and future opportunities
[J].
DOI:10.1177/0309133310385371
URL
[本文引用: 1]
Mangroves are salt tolerant woody plants that form highly productive intertidal ecosystems in tropical and subtropical regions. Despite the established importance of mangroves to the coastal environment, including fisheries, deforestation continues to be a major threat due to pressures for wood and forest products, land conversion to aquaculture, and coastal urban development. Over the past 15 years, remote sensing has played a crucial role in mapping and understanding changes in the areal extent and spatial pattern of mangrove forests related to natural disasters and anthropogenic forces. This paper reviews recent advancements in remote-sensed data and techniques and describes future opportunities for integration or fusion of these data and techniques for large-scale monitoring in mangroves as a consequence of anthropogenic and climatic forces. While traditional pixel-based classification of Landsat, SPOT, and ASTER imagery has been widely applied for mapping mangrove forest, more recent types of imagery such as very high resolution (VHR), Polarmetric Synthetic Aperture Radar (PolSAR), hyperspectral, and LiDAR systems and the development of techniques such as Object Based Image Analysis (OBIA), spatial image analysis (e.g. image texture), Synthetic Aperture Radar Interferometry (InSAR), and machine-learning algorithms have demonstrated the potential for reliable and detailed characterization of mangrove forests including species, leaf area, canopy height, and stand biomass. Future opportunities include the application of existing sensors such as the hyperspectral HYPERION, the application of existing methods from terrestrial forest remote sensing, investigation of new sensors such as ALOS PRISM and PALSAR, and overcoming challenges to the global monitoring of mangrove forests such as wide-scale data availability, robust and consistent methods, and capacity-building with scientists and organizations in developing countries.
Textural-spectral feature-based species classification of mangroves in Mai Po Nature Reserve from Worldview-3 imagery
[J].DOI:10.3390/rs8010024 URL [本文引用: 1]
Evaluating combinations of Sentinel-2 data and machine-learning algorithms for mangrove mapping in West Africa
[J].
DOI:10.3390/rs11242928
URL
[本文引用: 1]
Creating a national baseline for natural resources, such as mangrove forests, and monitoring them regularly often requires a consistent and robust methodology. With freely available satellite data archives and cloud computing resources, it is now more accessible to conduct such large-scale monitoring and assessment. Yet, few studies examine the reproducibility of such mangrove monitoring frameworks, especially in terms of generating consistent spatial extent. Our objective was to evaluate a combination of image processing approaches to classify mangrove forests along the coast of Senegal and The Gambia. We used freely available global satellite data (Sentinel-2), and cloud computing platform (Google Earth Engine) to run two machine learning algorithms, random forest (RF), and classification and regression trees (CART). We calibrated and validated the algorithms using 800 reference points collected using high-resolution images. We further re-ran 10 iterations for each algorithm, utilizing unique subsets of the initial training data. While all iterations resulted in thematic mangrove maps with over 90% accuracy, the mangrove extent ranges between 827–2807 km2 for Senegal and 245–1271 km2 for The Gambia with one outlier for each country. We further report “Places of Agreement” (PoA) to identify areas where all iterations for both methods agree (506.6 km2 and 129.6 km2 for Senegal and The Gambia, respectively), thus have a high confidence in predicting mangrove extent. While we acknowledge the time- and cost-effectiveness of such methods for the landscape managers, we recommend utilizing them with utmost caution, as well as post-classification on-the-ground checks, especially for decision making.
A new vegetation index to detect periodically submerged mangrove forest using single-tide Sentinel-2 imagery
[J].
DOI:10.3390/rs11172043
URL
[本文引用: 1]
Mangrove forests are tropical trees and shrubs that grow in sheltered intertidal zones. Accurate mapping of mangrove forests is a great challenge for remote sensing because mangroves are periodically submerged by tidal floods. Traditionally, multi-tides images were needed to remove the influence of water; however, such images are often unavailable due to rainy climates and uncertain local tidal conditions. Therefore, extracting mangrove forests from a single-tide imagery is of great importance. In this study, reflectance of red-edge bands in Sentinel-2 imagery were utilized to establish a new vegetation index that is sensitive to submerged mangrove forests. Specifically, red and short-wave near infrared bands were used to build a linear baseline; the average reflectance value of four red-edge bands above the baseline is defined as the Mangrove Forest Index (MFI). To evaluate MFI, capabilities of detecting mangrove forests were quantitatively assessed between MFI and four widely used vegetation indices (VIs). Additionally, the practical roles of MFI were validated by applying it to three mangrove forest sites globally. Results showed that: (1) theoretically, Jensen–Shannon divergence demonstrated that a submerged mangrove forest and water pixels have the largest distance in MFI compared to other VIs. In addition, the boxplot showed that all submerged mangrove forests could be separated from the water background in the MFI image. Furthermore, in the MFI image, to separate mangrove forests and water, the threshold is a constant that is equal to zero. (2) Practically, after applying the MFI to three global sites, 99–102% of submerged mangrove forests were successfully extracted by MFI. Although there are still some uncertainties and limitations, the MFI offers great benefits in accurately mapping mangrove forests as well as other coastal and aquatic vegetation worldwide.
Comparison of different vegetation indices for assessing mangrove density using Sentinel-2 imagery
[J].
Development and application of a new mangrove vegetation index (MVI) for rapid and accurate mangrove mapping
[J].DOI:10.1016/j.isprsjprs.2020.06.001 URL [本文引用: 1]
Retrieval of leaf area index and stress conditions for Sundarban mangroves using Sentinel-2 data
[J].DOI:10.1080/01431161.2019.1655174 URL [本文引用: 1]
基于Sentinel-2的潮间红树林提取方法
[J].
Extraction method of intertidal mangrove by using Sentinel-2 images
[J].
The red edge position and shape as indicators of plant chlorophyll content,biomass and hydric status
[J].DOI:10.1080/01431169408954177 URL [本文引用: 1]
GF6卫星红边波段对春季作物分类精度的影响
[J].为探究高分六号(GF6)宽幅遥感影像红边波段在春季作物识别中的应用,以河南省杞县为研究区,通过分析2019年3月25日单时相影像及其光谱特征,利用随机森林算法完成4种不同红边波段方案下冬小麦、大蒜和其他作物(油菜、蔬菜等)的分类提取,并基于地面采样数据实现不同方案分类精度评价、样本间可分性测度以及光谱反射率计算分析。结果表明,有红边波段参与下,较无红边波段参与时作物总体分类精度和不同作物可分性测度值均有所提高;单红边波段参与下,红边波段2作物总体分类精度较红边波段1提高了1.98个百分点;引入全部红边波段较无红边参与方案的作物总体分类精度由81.56%提高到86.19%,提高了4.63个百分点,Kappa系数由0.72提高到0.79,冬小麦-大蒜、冬小麦-其他作物、大蒜-其他作物的J-M(Jeffries-Matusita)可分性测度也分别增加了0.085 6、0.076 1和0.025 1。研究表明,红边波段的引入不仅增加了作物间的可分性测度,降低了分类结果中作物误分、漏分情况,也在一定程度上降低了结果中的“椒盐现象”,为国产红边卫星数据在农业上的应用提供参考。
Impact of red-edge waveband of GF6 satellite on classification accuracy of spring crops
[J].
高分六号红边特征的农作物识别与评估
[J].
Crop recognition and evaluation using red edge features of GF-6 satellite
[J].
高分六号卫星WFV新增谱段对农作物识别精度的改善
[J].
Improvement of the accuracy of crop recognition by the newly added spectrum of the GF-6 satellite WFV
[J].
高分六号遥感卫星新增波段下的树种分类精度分析
[J].
DOI:10.12082/dqxxkx.2019.190116
[本文引用: 1]
高分六号卫星具有覆盖广、多种分辨率、波段多的优势,能为遥感解译提供更丰富的信息。为探究高分六号卫星新增波段在森林树种识别上的应用,本文以覆盖根河市阿龙山林业局的一期高分六号宽幅影像为数据源,基于特征优化空间算法(Feature Space Optimization,FSO)和最大似然分类法,分别利用高分六号的前4个波段和所有波段(8波段)的光谱、纹理等特征进行了森林树种分类,并逐一添加新增波段特征确定了各波段的贡献率排名。结果表明:在加入了优选出的均匀性纹理、均值纹理和角二阶矩纹理3种纹理特征后,前4波段和8波段的分类精度比只基于光谱特征时的精度分别高出13.23%和24.63%;利用8波段信息比只利用前4波段在基于光谱特征上的精度高11.88%,在基于光谱+纹理特征上则高23.24%;基于8波段光谱+纹理特征的树种分类精度最高,达到68.74%,新增4波段的贡献率排名为B6>B5>B8>B7,说明新增红边波段对于本次树种分类试验的贡献率最高,能为北方树种识别提供有效帮助。
Tree species classification based on the new bands of GF-6 remote sensing satellite
[J].
Mapping mangrove forests based on multi-tidal high-resolution satellite imagery
[J].
DOI:10.3390/rs10091343
URL
[本文引用: 1]
Mangrove forests, which are essential for stabilizing coastal ecosystems, have been suffering from a dramatic decline over the past several decades. Mapping mangrove forests using satellite imagery is an efficient way to provide key data for mangrove forest conservation. Since mangrove forests are periodically submerged by tides, current methods of mapping mangrove forests, which are normally based on single-date, remote-sensing imagery, often underestimate the spatial distribution of mangrove forests, especially when the images used were recorded during high-tide periods. In this paper, we propose a new method of mapping mangrove forests based on multi-tide, high-resolution satellite imagery. In the proposed method, a submerged mangrove recognition index (SMRI), which is based on the differential spectral signature of mangroves under high and low tides from multi-tide, high-resolution satellite imagery, is designed to identify submerged mangrove forests. The proposed method applies the SMRI values, together with textural features extracted from high-resolution imagery and geographical features of mangrove forests, to an object-based support vector machine (SVM) to map mangrove forests. The proposed method was evaluated via a case study with GF-1 images (high-resolution satellites launched by China) in Yulin City, Guangxi Zhuang Autonomous Region of China. The results show that our proposed method achieves satisfactory performance, with a kappa coefficient of 0.86 and an overall accuracy of 94%, which is better than results obtained from object-based SVMs that use only single-date, remote sensing imagery.
Mapping mangrove forests using multi-tidal remotely-sensed data and a decision-tree-based procedure
[J].DOI:10.1016/j.jag.2017.06.010 URL [本文引用: 1]
Mapping of mangrove extent and zonation using high and low tide composites of Landsat data
[J].DOI:10.1007/s10750-017-3257-5 [本文引用: 1]
Landsat-based estimation of mangrove forest loss and restoration in Guangxi Province,China,influenced by human and natural factors
[J].DOI:10.1109/JSTARS.4609443 URL [本文引用: 1]
Monitoring loss and recovery of mangrove forests during 42 years: The achievements of mangrove conservation in China
[J].DOI:10.1016/j.jag.2018.07.025 URL [本文引用: 1]
高分六号卫星技术特点与新模式应用
[J].
Technical characteristic and new mode applications of GF-6 satellite
[J].
广西北部湾海岸带红树林变化的遥感监测
[J].
Monitoring the areal variation of mangrove in Beibu Gulf coast of Guangxi China with remote sensing data
[J].
The normalized difference vegetation index (NDVI):Unforeseen successes in animal ecology
[J].DOI:10.3354/cr00936 URL [本文引用: 1]
NDWI-A normalized difference water index for remote sensing of vegetation liquid water from space
[J].DOI:10.1016/S0034-4257(96)00067-3 URL [本文引用: 1]
Remote estimation of chlorophyll content in higher plant leaves
[J].DOI:10.1080/014311697217558 URL [本文引用: 1]
Ocean color satellites show extensive lines of floating sargassum in the Gulf of Mexico
[J].DOI:10.1109/TGRS.2006.882258 URL [本文引用: 1]
A novel ocean color index to detect floating algae in the global oceans
[J].DOI:10.1016/j.rse.2009.05.012 URL [本文引用: 1]
FVI-A floating vegetation index formed with three near-IR channels in the 1.0-1.24 μm spectral range for the detection of vegetation floating over water surfaces
[J].
DOI:10.3390/rs10091421
URL
[本文引用: 1]
Through the analysis of hyperspectral imaging data collected over water surfaces covered by floating vegetation, such as Sargassum and algae, we observed that the spectra commonly contain a reflectance peak centered near 1.07 μm. This peak results from the competing effects between the well-known vegetation reflectance plateau in the 0.81–1.3 μm spectral range and the absorption effects above 0.75 μm by liquid water within the vegetation and in the surrounding water bodies. In this article, we propose a new index, namely the floating vegetation index (FVI), for the hyperspectral remote sensing of vegetation over surface layers of oceans and inland lakes. In the formulation of the FVI, one channel centered near 1.0 μm and another 1.24 μm are used to form a linear baseline. The reflectance value of the third channel centered at the 1.07-μm reflectance peak above the baseline is defined as the FVI. Hyperspectral imaging data acquired with the AVIRIS (Airborne Visible Infrared Imaging Spectrometer) instrument over the Gulf of Mexico and over salt ponds near Moffett Field in southern portions of the San Francisco Bay were used to demonstrate the success in detecting Sargassum and floating algae with this index. It is expected that the use of this index for the global detection of floating vegetation from hyperspectral imaging data to be acquired with future satellite sensors will result in improved detection and therefore enhanced capability in estimating primary production, a measure of how much carbon is fixed per unit area per day by oceans and inland lakes.
