

0 引言
景观生态学是研究景观尺度上的空间格局、生态过程及其之间耦合机制的综合性学科,其采用景观指数定量化描述景观格局及变化,以建立格局与过程之间的联系[1]。近年来,遥感测绘、地理信息系统等领域的飞速发展为人们提供了多源且易获取的时空数据和高效的分析平台,使景观生态学取得了长足发展,成为生态学的前沿热点方向之一[2-3]。景观指数作为景观生态学的核心方法,其理论依据与体系构架也日臻成熟,并被应用于研究和探讨全球不同区域、不同生态系统和不同尺度下的景观破碎度和异质性、生境多样性、时空演变、驱动机制和格局优化等问题[4⇓⇓-7]。海岛作为一个相对独立且与外界缺少能流联系的生态系统,对人类活动影响更为敏感,其所提供的生态服务功能也更易受到景观格局效应的影响[8-9]。因此,定量评价海岛景观格局及演变有助于分析生态系统在空间尺度的配置状态与驱动机制,对制定合理的海岛及海岸带规划管理政策具有重要指导意义[10⇓-12]。
当前学术界广泛使用的景观指数体系虽可浓缩景观格局信息,反映其结构的组成和空间配置某些方面特征[13],但其斑块、类型及景观3个层次的众多指数均是建立在二维尺度上。而很多关键的生态学及人类活动强度信息均与其在三维空间的特征高度相关(如地形地貌、流域汇水过程、植被生物量、人工构筑物体量等)。缺失了第三维度的信息,仅从二维平面尺度来研究和评价生态系统的景观完整性及连通性,其所反映的特征在准确性和全面性方面无疑将大打折扣[14]。新一代的测量技术(星载、机载、船载、车载)使地表三维信息的快速提取和高精度数字表面模型(digital surface model,DSM)的构建成为可能,相关学者也开展了一系列研究。Long等[15]基于改进的三维生态足迹(ecological footprint,EF)和城市规模的人类发展指数开发了EWP模型,并评价了2017年中国4个主要岛屿地区的可持续发展,在传统二维EF模型基础上引入了足迹深度和规模; Hu等[16]利用增强回归树模型研究了不同季节的二维和三维因子研究城市热岛,在三维信息的选取方面具有参考价值; Yu等[17]采用回归模型和夏普利加法解释方法,研究了二维和三维景观格局指数及其与地表温度变化的关系; 宋仁波等[18]结合高分辨率影像和全景影像进行三维建模,为大规模城市建筑物建模提供思路; Liu等[19]提出了建筑物体积密度的计算方法,用于量化区域内的建筑物密度; Xu等[20]引用了空间拥挤程度的概念反映了三维空间中建筑物的拥堵情况。特别是无人机倾斜摄影测量,可从多个角度观察被制作建筑物和植被,更加灵活和真实地反映地物的实际情况,极大地弥补了基于卫星正射影像在分辨率、过境频率和立面信息缺失等方面的不足[21]。然而已有的三维景观指数多基于理论层面,缺少可操作性以及从原始数据获取到指数构建再到评估评价一套完整的过程。
本文将在系统梳理和剖析现有景观指数体系的基础上,构建一套描述海岛三维景观特征的指标体系及全过程评价方法,并以山东田横岛为研究区,基于无人机倾斜摄影测量获取激光点云数据,采用支持向量机(support vector machine,SVM)分类器的方法进行点云分类及处理,以此构建海岛DSM,开展三维景观指数案例运用及验证评估。研究旨在为推进现代测绘技术支持下的景观分析由二维向三维的过渡、发展海岛三维空间的景观生态评价方法提供方法学支撑和案例研究。
1 研究区及数据源
1.1 研究区概况
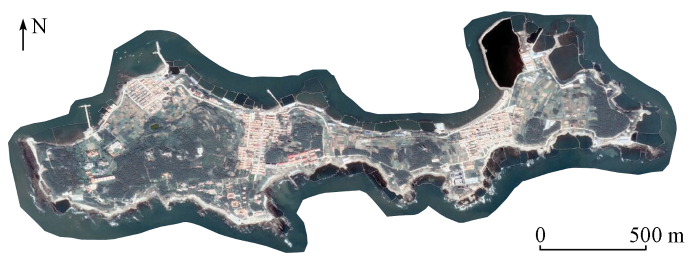
田横岛位于山东省青岛市即墨东部海域的横门湾中,中心位置为N36°25'08",E120°57'32",总面积为1.21 km2,海岸线长8 km,距大陆仅2 km(图1)。田横岛为有居民岛,岛上常住人口约1 200人,主要以养殖、捕捞、旅游业为主,岛内建筑种类繁多,有海神庙等标志性建筑物,岛上南北两坡风格迥异,是我国北方典型的有居民海岛。
图1
1.2 数据源及其预处理
图2
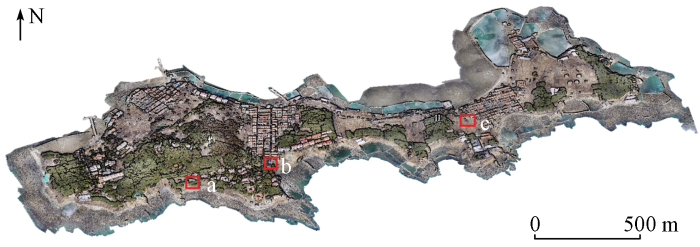
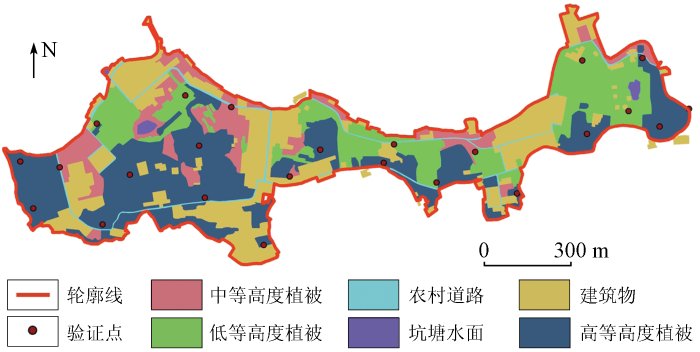
图3

图4
2 研究方法
本文技术流程如图5所示。
图5
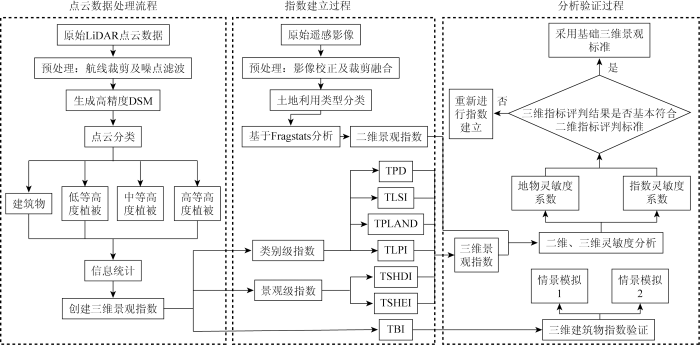
数据处理包括3个步骤: 将田横岛点云数据进行分类处理并创建DSM; 根据田横岛点云分类数据提取信息在传统二维景观指数基础上构建景观三维基础指标; 基于建筑物角度创建景观三维建筑物指数并讨论其生态意义。
2.1 点云数据处理
点云数据处理主要分为预处理、点云粗分类、点云精分类和分类结果检查4步。基于预处理后的点云数据,通过反复建立地表三角网模型的方法分离出地表面上的点,创建地面类,在此基础上生成DSM,如图6所示。采用SVM算法进行点云粗分类,预先选取训练样本根据植被和建筑物在表面粗糙度和形态方面存在差异进行训练[26]; SVM训练集、验证集和测试集的比例为6∶2∶2,正确率为94.7%[27]。点云精分类由Terrasolid软件进行人工目视解译校正进行处理。最终基于目视检查的方式,检查以下4项: ①数据是否完整; ②叠加彩色正射影像,判断点云覆盖物类型; ③按点云类别赋予相应颜色值目视进行检查; ④按点云类别和高度赋予相应颜色值目视进行检查。点云分类结果如图7所示,图7(b)和(d)中红色为建筑物,绿色为植被。
图6
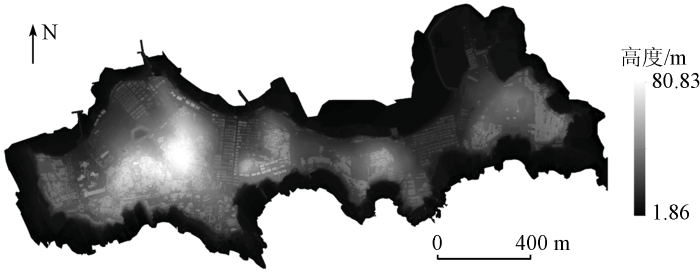
图7

2.2 三维景观基础指数构建
传统景观生态格局的概念基于“斑块”构建而来,二维平面中“斑块”指不同于周围背景的、相对均值的非线性区域[28]。本文在三维空间中将“斑块”定义为空间上的独立三维混合体,即不同于周围空间、结构相对独立的几何空间区域,构成海岛三维景观格局的基本组成单元。同样,三维空间中“类型”定义为具有相同共建结构的斑块组成的混合体; “景观”定义为整个景观区域内所有斑块的混合体。基于“斑块-类型-景观”景观格局概念,选取讨论斑块密度(patch density,PD)、形状指数(landscape shape index,LSI)、斑块占比指数(percentage of landscape index,PLAND)、最大斑块指数(largest patch index,LPI)、香浓多样性指数(Shannon diversity index,SHDI)和香农均匀度指数(Shannon evenness index,SHEI)这6种指数在三维尺度下的生态意义: PD作为景观指数的基础指标最直观地反映着维度之间的体量差异; LSI,PLAND和LPI作为“类型”中的典型指数,对于讨论景观破碎度、丰富度和分布起着重要的意义; SHDI和SHEI反映了景观异质性。此基础上将现有二维景观指数增加高度维度信息,引用体积和表面积替代原有公式中的面积信息并从数学角度完善公式几何意义,提出三维景观基础指数以代替传统二维景观指数用以表征对于复杂闭合区域内景观的复杂性、紧凑性和空间排列规律,同时对指数所对应的景观尺度及其表达意义进行了阐述。该指标中体积、表面积信息通过点云处理软件和编程计算获得[29],斑块信息可采用移动窗口法具体实现。
我国有居民海岛普遍以中低层建筑物为主,建筑物结构较为单一。本文提出三维建筑物影响指数(three-dimensional building impact index,TBI),旨在探究景观区域内建筑物空间格局对自然环境的影响能力,进而分析人类活动对景观干扰强度。相比传统二维景观指数注重平面的延展度,构建三维指数增加高度数据的同时,提高了建筑物离散性,进一步加深了对斑块离散程度的研究。本文通过引用建筑密实比(building coverage ratio,BCR)表示建筑物表面积和建筑物体积之间的量度,平均建筑物结构指数(mean building structure index,MBSI)表示建筑物面积和建筑物高度比值,加以统计容积率(plot ratio,PR)指标进行指数构建,将其复合累加反映人类活动影响下建造建筑物对原有景观生态格局的影响能力[30-31]。并引用Liu等[19]和Xu等[20]的指数方法,添加建筑物密度指数(building volume density,BVD)和空间拥挤指数(space crowding density,SCD),用于后续讨论分析。上述指数计算汇总如表1所示。表1计算公式中:
表1 三维景观指数公式及说明
Tab.1
| 景观尺度 | 指数名称 | 计算公式 | 公式说明 |
|---|---|---|---|
| 类型 | 三维斑块密度TPD | 描述单位体积上的斑块数,是描述景观破碎化的重要基础指标,表示三维景观内的空间异质性和均匀性 | |
| 三维形状指数TLSI | 描述斑块形状与相同面积的规则圆形或正方形之间的偏差,测量其形状复杂程度 | ||
| 三维斑块占比指数TPLAND | 描述各景观类别在海岛区域景观格局中的比重,量化了各斑块类型在景观中的比例丰度 | ||
| 三维最大斑块指数TLPI | 描述各类景观中最大斑块所占该类景观的体积之比,有助于确定景观的优势类型,其大小决定着景观的丰富度或地物占比情况 | ||
| 景观 | 斑块占比 | i类斑块所占体积比,反映斑块类型(类)占景观的比例,是景观多样性统计中的基础 | |
| 三维香农多样性指数TSHDI | 减去所有斑块类型中各斑块类型的丰度比例乘以该比例的总和,用以表示海岛区域内不同斑块类型的多少,即丰富度问题 | ||
| 三维香农均匀度指数TSHEI | 香农多样性指数除以给定景观丰度下的最大可能多样性,TSHEI=0表明景观仅由一种斑块组成,无多样性; TSHEI=1表明各斑块类型均匀分布,有最大多样性 | ||
| 其他 | BCR | 建筑物表面积和建筑物体积之间的量度 | |
| MBSI | 建筑物面积和建筑物高度比值 | ||
| PR | 区域内的地上建筑物总面积与净用地面积的比率 | ||
| TBI | 描述景观尺度内建筑物空间分布格局对原有空间的影响程度 | ||
| BVD | 用于量化建筑物密度程度的指数,其值高度依赖于岛屿的总面积 | ||
| SCD | 所有建筑物的体积累加值占研究区体积的百分比,反映了三维空间中建筑物的拥堵 |
2.3 二维、三维景观指数灵敏度评价方法
在环境质量评价中,指数的灵敏度涉及对环境质量的分辨问题,本文提出一种二维、三维景观指数的灵敏度评价体系,从地物类型和指数类型2个角度出发,探讨本文中三维指数同现有二维景观指数体系的增幅趋势。灵敏度物理意义非常明确,它表示某一自变量每变化单位相对量时所引起因变量的相对变化量。采用地物灵敏度系数(ground object sensitivity coefficient,GSC)表示某一地物类型的指数受维度变化的影响幅度; 指数灵敏度系数(exponential sensitivity coefficient,ESC)表示单一指数受维度变化的影响幅度。其具体公式分别为:
式中:
3 结果与分析
3.1 田横岛三维景观指数计算与分析
田横岛岛屿面积适中,总占地面积为1.21 km2,无人机测得地面以上总点云体积为1 483 242 m3,约为0.001 5 km3,总表面积为2 712 460 m2。岛内整体地势西高东低,西侧多为山地,最大高度为80.83 m; 岛内建筑物多集中于东、中、西3个村落,建筑物平均高度为3.81 m,多为单层或2层建筑物; 建筑物总占地面积为52 384 m2,总表面积为65 141 m2,总体积为199 442 m3,建筑物空间分布较为集中。基于本文所提出的三维景观指数,其计算结果如表2所示。
表2 不同尺度指数计算结果
Tab.2
| 景观 尺度 | 景观指数 | 低等高 度植被 | 中等高 度植被 | 高等高 度植被 | 建筑物 | ||
|---|---|---|---|---|---|---|---|
| 类型 | TPD | 9.334 | 6.121 | 13.796 | 1.345 | ||
| TLSI | 21.409 | 25.061 | 54.887 | 37.764 | |||
| TLPI | 8.360 | 3.296 | 1.074 | 0.016 | |||
| TPLAND | 0.355 | 0.275 | 0.116 | 0.037 | |||
| 景观尺度 | 景观指数 | 海岛 | |||||
| 景观 | TSHDI | 0.732 | |||||
| TSHEI | 0.614 | ||||||
| TBI | 0.523 | ||||||
高等高度植被TPD为13.796,说明高度越高的植物不仅在平面上分布广泛,在空间上破碎程度也越高; TLSI值为54.887,符合高植被地区高程起伏变化大的客观规律; TLPI和TPLAND同属于类型类中统计斑块的指数类型,由景观斑块组成的每个斑块的面积或体积可能是景观中包含的唯一最重要和有用的信息,这些信息不仅是许多斑块、类别和景观指数的基础,而且斑块体积本身在三维尺度具有很大的生态效用。比较TPLAND的值即可确定海岛中的优势景观类型为低等高度植被(0.355),并且其TLPI为8.360确定低等高度植被中的斑块在全海岛景观类型所含斑块中体积最大; TSHDI为0.732,表示斑块类型增加或各斑块类型在景观中呈均衡化趋势; TSHEI等于香农多样性指数除以给定景观丰度下的最大可能多样性(各斑块类型均等分布)。
田横岛区域TBI为0.523,TBI的数值大小反映着人类活动对于原有海岛生态环境的变化程度。海岛受人类活动的影响较小,建筑物景观结构较为单一。当岛内建筑物由低矮平房变为高层居民楼后,即建筑物结构变复杂后,平均高度和总体积将增加,TBI指数增大; 当岛内建筑物数量增多,即空间分布更为广泛后,除高度外其余指标均将增加,TBI指数亦增大。
3.2 二维、三维景观基础指标对比分析
景观格局分析中传统的二维景观格局指数是基于平面信息所得,当需要考虑地形因素时,此指数可能受到局限,而地形是影响景观格局的重要自然因子。不同于基于遥感影像数字高程模型(digital elevation model,DEM)数据提取三维表面积和周长的传统三维指数创建方法,基于无人机激光点云数据不仅可以提取计算出不同斑块、地类和景观在空间上的体积量和分布位置,同时在数据精度方面具有DEM无法比较的优势。
选取现有二维景观生态指数PD,LSI,PLAND,LPI,SHDI和SHEI,同本文构建的景观三维指标进行对比分析,其中PD,LSI,PLAND和LPI为类型级,SHDI和SHEI为景观级。基于Fragstats软件计算二维景观生态指数,二维和三维指标计算结果如表3所示,同时计算GSC和ESC。
表3 二维、三维指数计算结果对比
Tab.3
| 景观类型/指数 | 维度 | PD/TPD | LSI/TLSI | LPI/TLPI | PLAND/TPLAND | SHDI/TSHDI | SHEI/TSHEI | GSC | |||||||
|---|---|---|---|---|---|---|---|---|---|---|---|---|---|---|---|
| 低等高度植被 | 二维 | 5.467 | 7.342 | 6.022 | 0.237 | — | — | 1.877 | |||||||
| 三维 | 9.334 | 21.409 | 8.360 | 0.355 | — | — | |||||||||
| 中等高度植被 | 二维 | 7.870 | 6.521 | 3.115 | 0.178 | — | — | 1.806 | |||||||
| 三维 | 6.121 | 25.061 | 3.296 | 0.275 | — | — | |||||||||
| 高等高度植被 | 二维 | 4.283 | 8.639 | 0.840 | 0.384 | — | — | 2.789 | |||||||
| 三维 | 13.796 | 54.887 | 1.074 | 0.116 | — | — | |||||||||
| 建筑物 | 二维 | 0.247 | 2.243 | 0.112 | 0.123 | — | — | 5.681 | |||||||
| 三维 | 1.345 | 37.764 | 0.016 | 0.037 | — | — | |||||||||
| 海岛尺度 | 二维 | — | — | — | — | 0.568 | 0.663 | — | |||||||
| 三维 | — | — | — | — | 0.732 | 0.614 | — | ||||||||
| ESC | — | 2.788 | 7.487 | 0.967 | 0.911 | 1.289 | 0.926 | — | |||||||
构建GSC描述同一景观类型对应的多种景观指数增幅比例累加后均值,低等高度植被和中等高度植被分别为1.877和1.806,增幅程度较小,表明高程较低的景观类型三维指数变化较小,同时所构建的三维指数基本符合二维指数变化趋势,没有明显异常的指数; 高等高度植被GSC为2.789,建筑物GSC为5.681,增幅程度远远大于低矮植被,其值充分反映地形起伏越大的景观类型,二维景观指数所忽视的高程值影响生态评价的程度越大。
结果可知TLSI对应的ESC值最大,为7.487,由公式可知TLSI表示地形的起伏复杂程度,植被的高度同TLSI成正相关,因此三维指数比二维指数更适用于描述景观类型在空间上的变化。多样性指数中TSHDI和TSHEI受维度变化影响不显著,ESC分别为1.289和0.926,增幅较小,结果表明二维景观多样性指数仍然具有典型性。
3.3 三维建筑物景观指数验证
1)情景1: 假设将岛内建筑物点云数据复制1倍并堆积在其建筑物最高点的平面上(即建筑物平均高度由3.8 m增加至7.6 m,体积和表面积增加2倍,占地面积不变,其目的在于改变建筑物空间结构特征),如图8(a)所示,同理当点云数据复制2倍、3倍后,将增加后的信息带入计算TBI,BVD和SCD。
图8
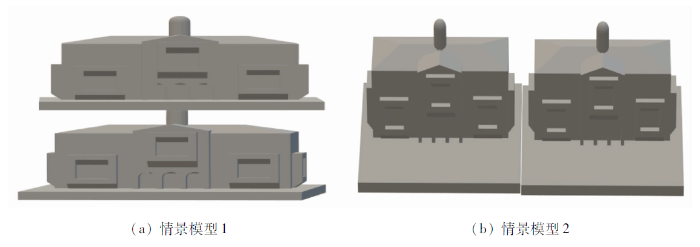
2)情景2: 假设在岛内非建筑物的地面上随机分布增加1 000个正方体建筑物点云数据,每个立方体边长为3.8 m(3.8 m约等于建筑物原有平均高度,其目的在于增加正方体后不改变原有建筑物平均高度和最大高度,改变建筑物的空间分布特征),如图8(b)所示,同理当增加2 000个和3 000个正方体建筑物点云数据后,将增加后的信息带入计算TBI,BVD和SCD。
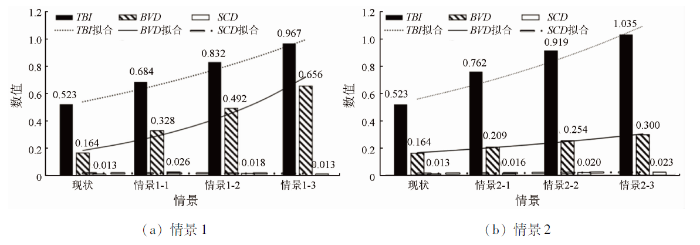
2种不同情景模型的结果分析如图9所示。当岛内空间结构特征发生变化时,TBI,BVD和SCD随着建筑物空间结构复杂程度增加而增加,当在建筑物顶端复制1倍建筑物时,增幅比例分别为1.307,2.001和2.087; 当在建筑物顶端复制2倍建筑物时,增幅比例分别为1.590,3.002和1.391; 当在建筑物顶端复制3倍建筑物时,增幅比例分别为1.848,4.002和1.043。由增幅比例结果可知,BVD呈线性增长模式,TBI为增幅程度小于BVD,TBI和SCD随着建筑物空间结构的愈加复杂,增幅比例有所减小,但SCD最终增幅程度趋于1。结果表明,TBI比起BVD和SCD更趋于理论逻辑,对于人工构筑物空间变化具有较高的灵敏度。当岛内建筑物空间分布特征发生变化时,TBI,BVD和SCD随着建筑物空间分布密集程度增加而增加,当增加1 000个正方体后,增幅比例分别为1.458,1.276和1.277; 当增加2 000个正方体后,增幅比例分别为1.756,1.551和1.553; 当增加3 000个正方体后,增幅比例分别为1.978,1.827和1.829。由增幅比例结果可知,相比较而言TBI对于建筑物分布程度变量更敏感,且随着正方体个数的增加,其增幅比例逐渐减小。
图9
4 结论
针对当前景观生态学普遍基于二维空间构造景观指数所带来的三维信息度缺失,评价结果难以准确反映真实三维景观系统的格局与特征问题,本文基于无人机倾斜摄影测量点云构建了一套包括类型及景观尺度共6个三维景观基础指标用来定量化描述海岛生态景观的三维格局与构成,并构建了建筑物景观指数用以评价人类建设活动对海岛生态系统的影响程度。主要结论如下:
1)基于三维景观基础指标分析,田横岛总体积为0.001 5 km3,总表面积为2.71 km2; 高大植被类型具有较高的隔离度、规律性和空间聚集性,低矮的植被类型则多样性、紧凑性和连通性更大; 建筑物类型的计算结果反映了岛内多为低矮建筑物且空间分布较为密集。由于存在维度差异,三维景观指数比二维指数存在着明显的增幅程度: 不同指数对比中TLSI增幅最为明显,ESC为7.487,结果反映涉及地类地形起伏变化的指数,三维指数包含更丰富的空间信息,其结果可更精确地表达三维景观信息; 不同地类对比中建筑物指数变化最大,GSC为5.681,比起空间特征不规律的植被,三维指数更受建筑物设计特征的影响。
2)海岛三维建筑物指数TBI基于岛陆多为低矮建筑物的现状特点反映其空间上的景观格局,TBI大小决定建筑物空间结构和分布程度,田横岛TBI为0.523,当岛内建筑物分布愈加密集,其值愈大。该指数可应用范围于包括海岛的闭合系统,用以反映人类活动强度程度。基于相关情景模拟分析,当建筑物空间结构复杂程度增加时,TBI增长率为1.307,1.590和1.848,BVD呈线性增加,SCD增幅程度逐渐趋于1; 当建筑物分布密集程度增加时,TBI增长率分别为1.458,1.756和1.978,灵敏度大于BVD和SCD。其结果表明TBI相较BVD和SCD,对于人工构筑物空间变化具有较高的灵敏度,更好地反映了三维空间内建筑物的拥挤程度。
3)本研究重点在于三维景观体系的构建以及从建筑物角度出发探讨海岛上的相关景观影响因子,下一步研究重点将结合植被、道路电线铺设、气候等相关影响因子,在当前指数基础上进一步研发三维植被指数以及其他针对不同专题的三维景观指数以期为更精准地表达三维空间景观的格局与动态演变过程,为助力海岛海岸带空间规划管理评价体系提供方法支撑。
参考文献
Detection of landscape heterogeneity at multiple scales: Use of the quadratic entropy index
[J].DOI:10.1016/j.landurbplan.2016.05.004 URL [本文引用: 1]
Mapping landscape spaces:Methods for understanding spatial-visual characteristics in landscape design
[J].DOI:10.1016/j.eiar.2020.106376 URL [本文引用: 1]
Research trends on integrative landscape assessment using indicators:A systematic review
[J].DOI:10.1016/j.ecolind.2021.107815 URL [本文引用: 1]
基于景观指数的细碎化对耕地利用效率影响研究——以扬州市里下河区域为例
[J].
Analysis on impact of fragmentation based on landscape index to cultivated land use efficiency:A case on Lixiahe District in Yangzhou City
[J].
近35 a来广州城市绿色空间及破碎化时空分异
[J].
DOI:10.11849/zrzyxb.20150869
[本文引用: 1]

伴随城市化进程的加快,绿色空间作为城市基础性要素之一,其稀缺性和作用日益凸显。论文以1979—2014年为研究时段,基于覆盖广州市域的7个时相Landsat影像获取城市绿色空间的信息,首先分析城市绿色空间数量变化与强度,再从研究区整体、境内各行政区单元和自中心城区向外人为划定的梯度景观等不同尺度对绿色空间破碎化的时空分异进行量化研究。得到以下主要结论:城市空间自中心向外扩展蔓延;城市绿色空间总量在研究始末变化不大,但随不同的时段呈起伏变化,其中1979—1990、2000—2005年间增幅较大,分别为2.3%和5.3%,1990—2000年则降幅较大,为-2.7%。绿色空间破碎化的时空差异明显,研究区绿色空间破碎化波动变化,呈减少(1990—2000年)—增加(2000—2005年)—减少(2005—2014年)之态势;而行政区的尺度上,与中心区毗邻的番禺、白云和花都区的阶段性特点突出,破碎化程度较大;在自中心区向外围的圈层梯度景观,也同样呈现阶段性变化特点。表明经济发展与对绿色空间的重视未尽同步,未来城市的可持续发展必须足够重视和优化绿色空间。
The spatial-temporal differentiation of green space and its fragmentation during the past thirty-five years in Guangzhou
[J].
Separate and combined impacts of building and tree on urban thermal environment from two-and three-dimensional perspectives
[J].DOI:10.1016/j.buildenv.2021.107650 URL [本文引用: 1]
改进遥感生态指数的宜宾市三江汇合区生态环境评价
[J].
Ecological environment assessment of three-river confluence in Yibin City using improved remote sensing ecological index
[J].
Dynamic assessment of island ecological environment sustainability under urbanization based on rough set,synthetic index and catastrophe progression analysis theories
[J].DOI:10.1016/j.ocecoaman.2019.04.017 URL [本文引用: 1]
Threshold of island anthropogenic disturbance based on ecological vulnerability assessment:A case study of Zhujiajian Island
[J].DOI:10.1016/j.ocecoaman.2018.10.014 URL [本文引用: 1]
城镇化背景下海岛资源环境承载力评估
[J].
DOI:10.11849/zrzyxb.20160753
[本文引用: 1]
在建设海洋强国的关键时期,海岛的生态保护和开发利用均至关重要。城镇化对海岛生态系统带来了深刻的影响,开展海岛资源环境承载力评估对管控人类开发行为、维护海岛生态平衡具有重要意义。论文以我国北方典型海岛—庙岛群岛为研究区,构建了一套综合开发强度和生态状况的海岛资源环境承载力评估方法并开展评估,结果显示:1)群岛尺度上,海岛资源环境承载力处于临界超载状态;2)单岛尺度上,南长山岛处于轻度超载状态,北长山岛、庙岛和大钦岛处于临界超载状态,小黑山岛、大黑山岛、砣矶岛、小钦岛、南隍城岛和北隍城岛处于可载状态,不同海岛应实施不同的保护与利用模式;3)区块尺度上,海岛资源环境承载力表现出了明显的空间分异性特征,可载区占41.7%,临界超载区占30.0%,轻度、中度和重度超载区分别占15.9%、8.1%和4.3%,超载区主要分布在各岛的城镇建设区域。
Evaluation on island resources and environment carrying capacity under the background of urbanization
[J].
DOI:10.11849/zrzyxb.20160753
[本文引用: 1]
Island ecosystem is vulnerable due to the special position, limited area and isolated space of islands, and the conservation and exploitation of islands are both essential to the construction of strong marine country. Urbanization has profound impact on island ecosystem, which threatened biodiversity and ecosystem productivity, and changed the landscape pattern, thus the evaluation on island resources and environment carrying capacity is of great significance for controlling human activities and maintaining ecological balance. Miaodao Archipelago, typical islands in North China which locate in Changdao County of Shandong Province, was used as the study area. The evaluation model of island resources and environment carrying capacity which integrated the exploitation intensity and ecological status was established. The methods of remote sensing (RS), geographic information system (GIS) and field investigation were adopted, and the resources and environment carrying capacities at archipelago scale, island scale and grid scale were analyzed, respectively. The results indicated: at archipelago scale, the resources and environment carrying capacity was in status of critical overloading; at island scale, Nanchangshan Island was in status of mild overloading, whereas Beichangshan Island, Miao Island and Daqin Island were in status of critical overloading, and the other six islands were in status of no overloading, which suggested that different modes of conservation and exploitation should be implemented in different islands; at grid scale, the island resources and environment carrying capacity had significant spatial heterogeneity with no overloading zones (41.7%), critical overloading zones (30.0%), mild overloading zones (15.9%), moderate overloading zones (8.1%) and severe overloading zones (4.3%) in descending order, where no overloading zones distributed in the non-urban construction areas, critical overloading zones located in suburb areas and parts of non-urban construction areas, and overloading zones concentrated in urban construction areas. Urban construction inevitably decreased the island ecological function. Construction scale control, spatial allocation optimization, environmental impact mitigation, and ecological restoration and construction were important measures to enhance the island resources and environment carrying capacity. The evaluation model comprehensively reflected the features and spatial heterogeneity of island resources and environment carrying capacity, thus provided a basis for allocations of island conservation and exploitation, and it can be widely applied to the evaluation of island resources and environment carrying capacity in different regions and different types of islands.
基于蜂巢格网的北部湾典型海岛景观生态风险空间异质性研究
[J].
Spatial heterogeneity of landscape ecological risk of typical islands in Beibu Gulf based on honeycomb grid
[J].
海岸带地类统计模型中DEM空间尺度优选方法
[J].
An optimization method of DEM resolution for land type statistical model of coastal zones
[J].
A landscape index of ecological integrity to inform landscape conservation
[J].DOI:10.1007/s10980-018-0653-9 [本文引用: 1]
2D与3D景观指数测定山区植被景观格局变化对比分析
[J].
A comparison of 2D and 3D landscape metrics for vegetation patterns change quantification in mountainous areas
[J].
Sustainability evaluation based on the three-dimensional ecological footprint and human development index:A case study on the four island regions in China
[J].DOI:10.1016/j.jenvman.2020.110509 URL [本文引用: 1]
Modeling the impact of 2D/3D urban indicators on the urban heat island over different seasons:A boosted regression tree approach
[J].DOI:10.1016/j.jenvman.2020.110424 URL [本文引用: 1]
Exploring the relationship between 2D/3D landscape pattern and land surface temperature based on explainable extreme gradient boosting tree:A case study of Shanghai,China
[J].
基于多源数据集成的城市建筑物三维建模方法
[J].
A method for 3D modeling of urban buildings based on multi-source data integration
[J].
Complexity of the relationship between 2D/3D urban morphology and the land surface temperature:A multiscale perspective
[J].
DOI:10.1007/s11356-021-15177-7
PMID:34240301
[本文引用: 3]
Urban morphology is a crucial contributor to urban heat island (UHI) effects. However, few studies have explored the complex effect of 2D/3D urban morphology on UHIs from a multiscale perspective. In this study, we chose the central area of Jinan city, which is commonly known as the "furnace," as the case study area. The 2D/3D urban morphology indexes-building coverage ratio (BCR) (for assessing the 2D building density), building volume density (BVD) (for assessing the 3D building density), and frontal area index (FAI) (for assessing 3D ventilation conditions) were calculated and derived to investigate the complexity of the relationship between 2D/3D urban morphology and the land surface temperature (LST) at different scales using the maximum information coefficient (MIC) and geographically weighted regression (GWR). The results indicated that (1) these 2D/3D urban morphology indexes are essential factors that are responsible for LST variation, and BCR is the most important urban morphology index affecting LST, followed by BVD and FAI. Importantly, the relationship between the BCR, BVD, FAI, and LST was an inverse U-shaped curve. (2) The relationship between 2D/3D urban morphology and LST variation showed a significant scale effect. With increased grid size, the correlation between the BCR, BVD, and FAI and the LST strengthened, "inflection point" of inverse U-shaped curve significantly declined, and their explanation rate of the LST first increased and then decreased, with a maximum value at the 700 m scale. Additionally, the FAI exerted a stronger negative effect, while the BCR and BVD generally had stronger positive effects on the LST as the grid size increased. This study extends our scientific understanding of the complex effect of urban morphology on the LST and is of great practical significance for multiscale urban thermal environment regulation.
Analysis of three-dimensional space expansion characteristics in old industrial area renewal using GIS and barista:A case study of Tiexi District,Shenyang,China
[J].
DOI:10.3390/su11071860
URL
[本文引用: 3]
With rapid urban development in China in the last two decades, 3D characteristics have been the main feature of urban morphology. Nevertheless, the vast majority of urban growth research has only focused on area expansion horizontally, with few studies conducted in a 3D perspective. In this paper, the characteristics of 3D expansion that occurred in Tiexi from 1997 to 2011 were evaluated based on geographic information system (GIS) tools, remote-sensing images, and Barista software. Landscape index, the spatiotemporal distribution of changes in buildings’ renewal modes and variations in city skylines as well as the relationship between number and size of high-rise buildings are the specific phenomena and data utilized to quantify the 3D urban expansion. The results showed that the average height of Tiexi increased by 0.69 m annually, the average urban capacity increased by 490.15 m3 annually, and space congestion degree increased by 0.11% annually. The average annual increase of the building evenness index was 36.43. The renewal area occupied up to 75.38% of the total area. The change of the skyline was more consistent with the east–west direction. The change in the south direction was significant, while in the north direction it was relatively slow. The overall shape of the city was that of a weak pyramid, with the angle of the top of the pyramid gradually becoming larger. The methods proposed in this paper laid a foundation for a wide range of study of 3D urban morphology changes.
基于TerraSolid的平原地区点云数据滤波方法
[J]
A filtering point cloud data way on plain region based on TerraSolid
[J].
基于稀疏型机载激光雷达数据的风景林参数估测
[J].
Estimation of the parameters of scenic forests using sparse airborne LiDAR data
[J].
基于地物信息的高光谱遥感图像分类方法
[J].
Classification method of hyperspectral remote sensing image based on feature information
[J].
无锡市景观指数的粒度效应研究
[J].
Grain size effect of landscape metrics in Wuxi City
[J].
DOI:10.11849/zrzyxb.20150303
[本文引用: 1]
Wuxi city in the Yangtze River Delta Area is taken as a representative case of urbanizing regions of China with great pressure of biodiversity conservation and environmental protection. The multi-weight factors model based on natural and artificial factors was applied in the process of identifying local ecological contribution pattern patches. Five main factors, i.e., slope, height, land use type, distances to settlements and traffic network, and their relative weights were obtained from previous results. The basic spatial cell unit is 30 m. By the scale the landscape pattern was converted to ArcGrid formats with grain sizes of 2, 3, 4, 5, 6, 7, 8, 9, 10, 15, 20, 30, 40, 50, 60, 70, 80, 90 and 100 cells. Above two steps were computed in ArcGIS 10.0 environment based on the dataset interpreted from TM images. Landscape metrics were used to detect the grain size effects of ecological pattern. Five landscape connectivity indicators, including number of links (<em>NL</em>), number of components (<em>NC</em>), integral index of connectivity (<em>IIC</em>), probability of connectivity (<em>PC</em>) and importance value of <em>PC</em> (<em>dPC</em>), were computed in ConeforSensinode 2.2 environment. Landscape metrics at class and landscape levels, including total class area (<em>CA</em>), number of patches (<em>NP</em>), patch density (<em>PD</em>), largest patch index (<em>LPI</em>), landscape shape index (<em>LSI</em>), perimeter area fractal dimension (<em>PAFRAC</em>), aggregation index (<em>AI</em>), splitting index (<em>SPLIT</em>), mean shape index (<em>MSI</em>), area-weighted patch fractal dimension (<em>AWMPFD</em>), cohesion index (<em>COHESION</em>), division index (<em>DIVISION</em>), Shannon's diversity index (<em>SHDI</em>), Shannon's evenness index (<em>SHEI</em>), were computed in Fragstats 4.0 environment. The results showed that with the increase of grain size, these metrics changed dramatically, and there existed scale domains of landscape metrics. The scale domains of landscape metrics at class and landscape levels were 2-30 cells and 2-10 cells respectively, and that of landscape connectivity indicators was 2-7 cells. The scale domain of 2-7 cells, i.e. 60-210 m, was recommended. The scale domain of landscape connectivity indicators was more precise compared with those of other landscape metrics. Landscape connectivity indicators were suitable for the research of grain size effect. However, it should be noticed that the response degrees of different landscape connectivity indicators were different.
多分类器组合的LiDAR点云分类
[J/OL].
Multi-classifier combined method for LiDAR point cloud classification
[J/OL].
基于SVM土壤重金属污染评价的训练数据集构建
[J].
Training dataset construction for SVM soil heavy metal pollution assessment
[J].
长白山风灾景观30年格局变化过程分析
[J].
Analysis of the pattern change process of Changbai Mountain wind-damaged landscape in the past thirty years
[J].
3D characterization of a Boston Ivy double-skin green building facade using a LiDAR system
[J].DOI:10.1016/j.buildenv.2021.108320 URL [本文引用: 1]
Urban landscape pattern analysis based on 3D landscape models
[J].DOI:10.1016/j.apgeog.2014.09.006 URL [本文引用: 1]
Large-scale parameterization of 3D building morphology in complex urban landscapes using aerial LiDAR and city administrative data
[J].DOI:10.1016/j.compenvurbsys.2018.09.004 URL [本文引用: 1]
