

0 引言
传统的土地利用调查是一项工作强度大、时间周期长的系统工程[3]。遥感技术的出现和发展为人类提供了从多维和宏观的角度去认识和研究土地利用的新手段和新方法,同时大大节省了获取土地利用信息的时间和成本[4-5]。利用卫星影像数据进行土地利用分类是遥感应用研究的主要方向之一。近些年来,随着机器学习技术的高速发展,遥感影像分类算法得到了极大丰富。影像分类算法主要向传统的多分类算法和新颖的单分类算法2个方向发展。在传统的土地利用分类研究中,其主要目标是如何将观察到的众多地物分开,因此发展了很多非常成熟的分类算法,包括支持向量机(support vector machine,SVM)、随机森林法(random forest,RF)、最大似然法(maximum likelihood classification,MLC)以及人工神经网络(artificial neural network,ANN)等[6]。随着遥感影像应用广度和深度的拓展,研究的兴趣越来越聚焦于某一种地类,而不关注其他地类,这样做的好处是不需要获得与研究目标无关地物的训练样本点,从而使得遥感解译的野外调查工作量减少[7]。因此产生了很多单分类算法,例如单分类支持向量机(one-class support vector machine,OCSVM)、最大熵模型(maximum entropy model, MaxEnt)等。将多分类算法应用在单分类实践中,已经有较多的探索[8-9]。然而将单分类算法应用在多分类的实践中,却很少有研究关注这个问题。这个问题的解决对于拓展遥感多分类算法库有重要的实践意义,同时也对单分类和多分类算法的交叉和融合有重要的理论意义。
MaxEnt是一个近年来在影像单分类领域应用最广泛的算法之一,也被评价为最有潜力的算法[10]。在利用MaxEnt识别单个土地类型时,只需要对感兴趣土地利用类型的样本点进行训练,而不需要训练其他土地利用类型的样本。Li等[7]利用MaxEnt和OCSVM对一幅0.3 m空间分辨率的航空相片进行单个土地类别的分类,结果表明MaxEnt比OCSVM的表现更优; Lin等[11]基于最大熵模型,利用MODIS地表反射率数据、归一化植被指数数据以及夜间灯光遥感数据[12]等进行中国城市用地提取时也获得了较好的效果。然而,这些研究仅仅是利用MaxEnt进行单个土地利用类型分类,而不是多类土地利用分类,从而无法与传统遥感影像多分类算法进行比较。
为了探讨将单分类算法应用来解决多分类问题,并进一步丰富遥感土地利用多分类的算法库,本文建立了利用MaxEnt进行土地利用多分类的技术流程,并将此模型应用于云岩河流域的土地利用解译中。通过比较MaxEnt与传统多分类算法(RF,MLC和SVM)对遥感影像解译的差异,探究MaxEnt在遥感土地利用分类应用中的优劣。本研究为遥感土地利用多分类研究提供了一个新的视角,以期更有利于MaxEnt在遥感领域的应用与发展。
1 研究区概况和数据源
1.1 研究区概况
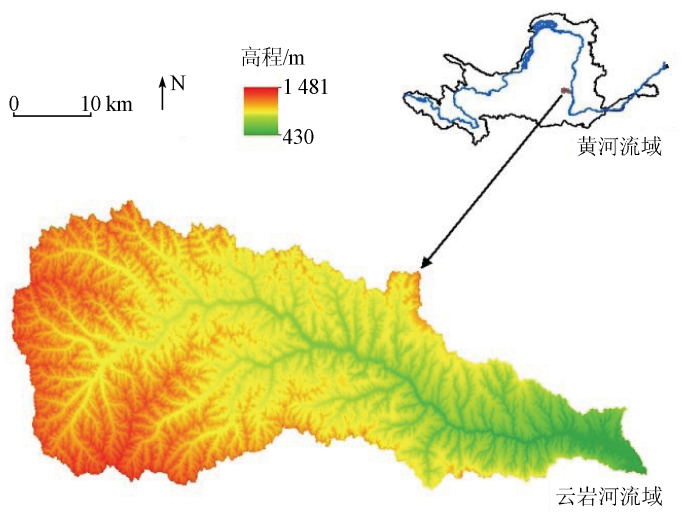
云岩河流域位于陕西省延安市中东部(E109°31'~110°27',N36°10'~36°30',如图1所示),是黄河中游的一级支流,干流全长112.5 km,流域总面积为1 783.35 km2,云岩河流域地势西高东低,海拔大致在430~1 481 m之间。气候属于半干旱大陆性季风型气候,一年四季冷暖干湿差异显著。该流域降水季节差异大,年降水量约为550 mm,并主要集中于7—9月份。流域地表覆盖主要为厚层黄土,属于典型的以黄土塬为主的塬梁沟壑区。该地区水资源比较丰富,建设有小型灌溉设施以及水电工程。
图1
1.2 数据来源及预处理
表1 Landsat8陆地成像仪波段B2—B7参数特征
Tab.1
| 传感器 类型 | 波段 | 波长范 围/μm | 空间分 辨率/m | 主要应用领域 |
|---|---|---|---|---|
| 陆地成像仪OLI | B2 Blue (蓝光波段) | 0.450~0.515 | 30 | 用于水体穿透、分辨植被和土壤等 |
| B3 Green (绿光波段) | 0.525~0.600 | 30 | 用于分辨植被等 | |
| B4 Red (红光波段) | 0.630~0.680 | 30 | 用于观测道路、裸露土壤和植被等 | |
| B5 NIR (近红外波段) | 0.845~0.885 | 30 | 用于估算生物量、分辨潮湿土壤等 | |
| B6 SWIR 1 (短波红外1波段) | 1.560~1.660 | 30 | 用于分辨道路、土壤和水等 | |
| B7 SWIR 2 (短波红外2波段) | 2.100~2.300 | 30 | 用于矿物识别、分辨植被和潮湿土壤等 |
数字高程模型(digital elevation model,DEM)数据是进行流域水文分析的基础空间数据[13],本研究所用的ASTER GDEM 30 m空间分辨率的DEM数据来源于地理空间数据云。首先对初始的2幅DEM数据进行图像镶嵌,使镶嵌后的DEM包含完整的研究区范围; 为了减少计算量、提高运算速度,对镶嵌后的DEM数据进行不规则裁剪处理; 然后利用ArcSWAT模型[14]对经过裁剪处理后的DEM数据进行洼地填充、确定水流方向和计算累积流量等处理,提取云岩河流域矢量边界。ArcSWAT是基于SWAT(soil water assessment tool)模型开发的,与ArcGIS配套使用。
依据我国《土地利用分类现状》(GB/T 21010—2017),并结合云岩河流域的实际情况,本研究将该流域土地利用类型划分为5类: 森林、灌木、草地、耕地、建设用地(房屋和道路)。在对该地区进行广泛实地踏勘的基础上,利用Google Earth平台上的高分辨率影像进行随机采样,使采样点尽可能在研究区范围内均匀分布。本研究一共获得231个坐标点,其中包括森林47个、灌木43个、草地46个、耕地43个、建设用地52个。
2 研究方法
2.1 MaxEnt的基本思想
假设未知概率分布
其中,特征函数
如果模型可以获取训练数据中的信息,那么可以假设未知概率分布的期望值与其经验分布的期望值相同,可以表述为:
未知概率分布
MaxEnt模型认为,应该在所有满足已知约束条件的模型集合中选取熵最大的模型[15]。MaxEnt软件利用“最大熵原理”估计物种的分布概率,其分布(吉布斯分布)形式为:
式中: l为环境变量的个数;
2.2 构建基于MaxEnt的土地利用多分类技术流程
MaxEnt是一种概率模型,主要可用于解决单分类问题[7,10,17]。当MaxEnt应用于遥感影像分类时,研究区的每一个栅格构成了定义MaxEnt概率分布的空间,每一个地类的训练数据构成样本点(即每个地类的“存在”数据),分类特征数据主要包括遥感影像的不同波段和时段的数据。本文利用MaxEnt解决遥感影像的多分类问题,基于Phillips等[18]用JAVA语言编写的可以免费获取的MaxEnt软件 (
图2
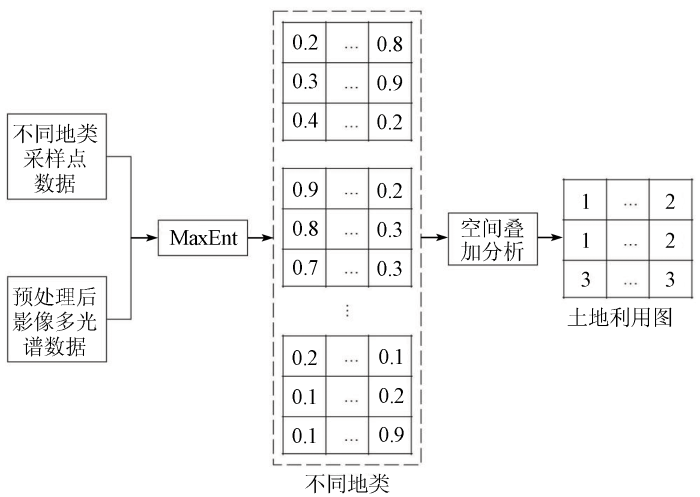
图2
最大熵模型进行土地利用多分类的技术流程
Fig.2
Procedure of multi-classification for land use based on maximum entropy model
1)假设研究区共有n种土地利用类型
2)运行结束后,输出n个概率分布图层,第i个概率分布图层的栅格值代表该栅格属于第
3)分别对n个概率分布图层(土地利用类型)编号为1,2,…,n,对MaxEnt软件输出的n个概率分布图层进行空间叠加分析,通过对比n个图层同一位置的概率数值,输出该位置栅格值最大的图层所对应的图层编号。
4)获得的编号图层即为利用MaxEnt分类得到的土地利用图。
2.3 MaxEnt与传统多分类算法比较
遥感土地利用分类的目的是将影像中的每一个像元根据其在不同波段的光谱特征、空间结构特征以及其他辅助信息,利用不同的分类算法或数学规则划分到不同的土地利用类别中去[5,19]。本研究使用MaxEnt和3种传统算法进行土地利用分类,即RF[20],MLC[21-22]和SVM[15,23 -24]。MaxEnt利用MaxEnt 3.4.1软件[18]和R 4.1.2软件(
2.3.1 4种算法预测准确性评估
利用Python将通过Google Earth高分辨率影像获得的地面采样点数据按照7∶3的比例进行随机分割,其中70%的采样点数据用做训练集,用于训练分类器; 30%的采样点数据用做测试集,用于精度评估。利用总体分类精度(overall accuracy,OA)、Kappa系数、灵敏度指数以及特异度指数作为土地利用分类精度评价指标。
1)总体分类效果评估。OA和Kappa系数是用来反映分类器的整体表现。OA描述了遥感影像的分类结果与地面实际的土地利用类型相一致的概率; Kappa分析是一种用于准确性评估的离散的多元技术,它考虑了混淆矩阵的所有因素,克服了其他精度评价指标的缺陷,因此常作为比较各分类器总体分类表现优劣的指标[5]。OA和Kappa系数的计算公式分别为:
式中: r为土地利用类型数; N为总的用于精度评估的采样点数量;
2)分土地要素的评估。灵敏度和特异度是用来反映分类器在不同土地利用类别上的分类表现[26]。灵敏度和特异度的计算公式分别为:
式中: sen为灵敏度; spe为特异度; a为实际为某一地类且预测为该地类的像元数量(真阳性); b为实际为某一地类但预测不为该地类的像元数量(假阴性); c为实际不为某一地类但预测为该地类的像元数量(假阳性); d为实际不为某一地类且预测不为该地类的像元数量(真阴性)。
2.3.2 4种算法之间一致性评估
表2 Kappa系数评价一致性标准
Tab.2
| Kappa | 一致性程度 |
|---|---|
| [-1.00, 0) | 极差 |
| [0, 0.20) | 微弱 |
| [0.20, 0.40) | 弱 |
| [0.40, 0.60) | 中度 |
| [0.60, 0.80) | 高度 |
| [0.80, 1.00] | 极强 |
3 结果与分析
3.1 总体分类结果与评价
图3
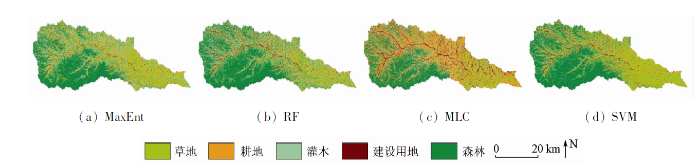
表3 4种算法的OA和Kappa系数
Tab.3
| 指标 | 算法 | |||
|---|---|---|---|---|
| MaxEnt | RF | MLC | SVM | |
| OA/% | 84.06 | 80.88 | 75.76 | 79.71 |
| Kappa | 0.80 | 0.76 | 0.69 | 0.75 |
3.2 不同地类分类结果与评价
通过4种分类算法对5种土地利用类型的灵敏度和特异度(表4)的研究结果表明,4种算法均具有较高的特异度,对5种土地利用类型的特异度指数均达到或超过0.89,说明4种算法均具有较低的Ⅰ型错误(即错误被预测为正确)。4种分类算法在灵敏度上存在一定的差异性,对5种土地利用类型的灵敏度指数在0.15~1.0之间。MaxEnt,RF以及SVM对森林的灵敏度指数均为1,说明这3种算法对森林的识别都较为准确; 其次,4种算法对建设用地的灵敏度指数均大于0.9,说明4种算法对建设用地预测的准确性也较高; MaxEnt和SVM对于草地、耕地的提取表现显著优于其他2种算法; 4种分类算法对灌木的提取均不太理想,特别是SVM表现最差。总体来说,MaxEnt相对于其他3种算法在各个土地利用类型上没有最差的表现,甚至达到最优的表现。
表4 4种算法的分类精度比较
Tab.4
| 土地利用类型 | MaxEnt | RF | MLC | SVM | ||||
|---|---|---|---|---|---|---|---|---|
| 灵敏度 | 特异度 | 灵敏度 | 特异度 | 灵敏度 | 特异度 | 灵敏度 | 特异度 | |
| 草地 | 0.93 | 0.89 | 0.79 | 0.93 | 0.38 | 0.96 | 0.93 | 0.82 |
| 耕地 | 0.85 | 0.96 | 0.69 | 0.96 | 0.75 | 0.91 | 0.85 | 0.98 |
| 灌木 | 0.46 | 0.98 | 0.62 | 0.91 | 0.67 | 0.89 | 0.15 | 0.98 |
| 建设用地 | 0.93 | 1.00 | 0.93 | 1.00 | 1.00 | 0.94 | 1.00 | 1.00 |
| 森林 | 1.00 | 0.96 | 1.00 | 0.96 | 0.93 | 1.00 | 1.00 | 0.96 |
3.3 一致性检验和混合矩阵
4种分类算法产生的土地利用分类图的一致性Kappa检验和混合矩阵结果见图4,小图中格子数字表示不同模型分类结果的匹配栅格数量(万个,大小为30 m×30 m); 小图上的横坐标(X轴)名称为vs符号前面的模型,纵坐标(Y轴)名称为vs符号后面模型。MaxEnt与RF和SVM的Kappa系数都超过了0.6,表明MaxEnt与RF和SVM有较高的一致性,达到了高度一致水平,混合矩阵也表明了这3种算法在各个地类上的较高一致性。但MaxEnt与MLC分类图的Kappa值均小于0.4,表明MaxEnt与MLC分类结果的一致性较差。与此同时,MLC与其他2种算法分类结果的Kappa值也小于0.4,表明MLC与RF和SVM分类结果的一致性较弱,混合矩阵也表明了MLC与其他算法在各个地类上存在较大差异性。
图4
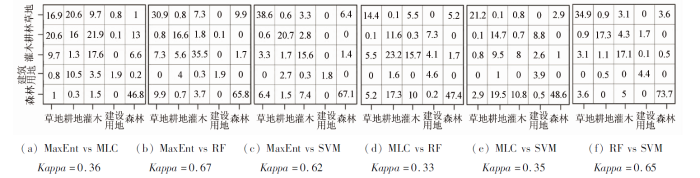
图4
4种分类算法分类结果的Kappa一致性检验和混合矩阵
Fig.4
Kappa consistency test and confusion matrix of classification results of four classification algorithms
4 讨论
4.1 MaxEnt多分类方法体系与土地利用制图
本研究建立了利用MaxEnt进行遥感土地利用多分类的技术流程,并将此算法应用于云岩河流域的土地利用解译中。通过比较MaxEnt与传统多分类算法(RF,MLC和SVM)对遥感影像解译的差异,探究MaxEnt在遥感土地利用分类应用中的优劣。研究发现: ①MaxEnt总体分类精度最大,达到84%,Kappa系数为0.8; ②MaxEnt在各个地类识别上没有最差的表现,甚至在某些地类上达到了最优的表现; ③MaxEnt与RF和SVM的表现一致性较高,这3种算法产生的土地利用分类图之间一致性评估Kappa值均超过了0.6。以上研究结果表明,建立的利用MaxEnt单分类算法解决遥感多分类问题的技术流程是有效的。就目前研究所知,本文是第一次尝试利用MaxEnt来解决遥感多分类问题的。这个工作流的核心是通过比较栅格中各个土地利用类型的发生概率,认为概率发生最大的土地利用类型即为栅格的状态。这种算法的实现不同于单分类研究中依赖阈值的确定方法[10,29]。目前单分类遥感解译中最大的不确定性来源之一就是阈值方法的选择[10],而本文建立的方法体系不需要面临阈值选择的问题,从而能够避免由于阈值选择而带来的不确定性。本文技术流程虽然只是应用在MaxEnt中,但同样适用于其他单分类算法,例如OCSVM、逻辑斯蒂回归模型(logistic regression model,LRM)以及广义线性模型(generalized linear model,GLM)等。
本文不仅为遥感土地利用多分类研究提供了一个新的视角,而且也为云岩河流域土地利用制图提供了最精确的算法工具。以往很多研究,力图从采用更高分辨率影像[30]、多源数据融合[11,31]以及分类算法改进[22]等多方面提高影像分类精度。而本研究基于MaxEnt单分类算法,提出一种新的多分类算法,能从总体分类表现上超过传统算法(RF,MLC和SVM)3~8百分点的准确度,并且在各个地类识别上均表现出最佳或中等以上的分类精度。将MaxEnt的分类结果作为云岩河流域最终的土地利用图,每种土地利用类型的面积如图5所示。研究表明,森林是云岩河流域最主要的土地利用类型,主要分布于研究区的西南部; 其次分别为灌木、草地和耕地,建设用地在该区域分布较少。云岩河流域是黄河的一级支流,该地区是黄土高原水土保持治理的关键区域,及时掌握该地区的土地利用类型及其变化对山水林田湖草沙系统治理具有重要意义[32]。本文利用MaxEnt获得云岩河流域的土地利用图,能够为后续该区域的土地资源优化配置、景观格局分析以及土地信息系统的构建等提供一定的数据支撑。
图5
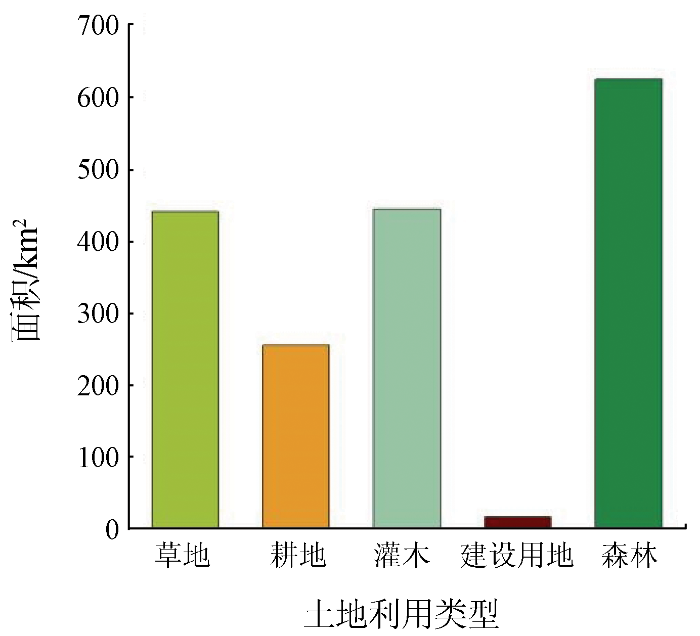
图5
云岩河流域不同土地利用类型的面积
Fig.5
Area of different land use types in Yunyan River watershed
4.2 MaxEnt在遥感土地利用多分类应用中的展望
自从2006年以来,MaxEnt在物种潜在分布研究领域得到了广泛应用[33-34]。近10 a来,MaxEnt模型才开始逐渐应用于遥感影像的单分类研究[7]。当主要研究目标为对单个地类进行信息提取时,只需选择目标地类的样本点作为训练数据,此时利用传统的多分类算法进行地类识别时可能会导致效率低下[10]。在这种情况下,单分类算法可能是一种更为有效的替代方法。在过去利用MaxEnt提取单类土地利用类型的研究中,在城市用地提取[11]、地表水提取[35]以及植被识别[36]等方面都获得了较好的识别效果。以上利用MaxEnt进行单个地类识别大多是基于MaxEnt软件的,然而MaxEnt软件最初是由生态学家们用于物种地理分布的生态位模拟而设计开发的[34],并不是专门用来进行遥感土地利用分类的。因此,有遥感领域学者在MaxEnt的参数优化和阈值调整[10,29]上做了一些研究,发现通过调整默认参数和更改阈值能够在一定程度上提高遥感解译精度。然而,上述研究也只是针对MaxEnt的单分类而言的,关于如何进行内在参数优化配置来改进算法、提高MaxEnt的泛化能力[37],从而获取更优的影像多分类效果仍需要进一步探索。
虽然本研究利用4种算法进行土地利用分类时,MaxEnt总体分类表现最优,但是其分类全过程用时较长。利用MaxEnt进行土地利用分类时,对MaxEnt软件输出的n个概率分布图层进行空间叠加分析以获取最终的土地利用图时,其运算效率取决于遥感影像的像元数量。当研究区遥感影像的空间分辨率进一步提高或研究范围扩大时,利用此方法进行土地利用分类,运行时长将成倍数增加。因此,提高MaxEnt土地利用多分类的运算效率是目前亟须解决的问题。鉴于此,如果在后续的相关研究中将并行计算[38]纳入到分类过程中,将有利于提高该模型的运算效率。因此,若将优化后的MaxEnt集成在遥感影像专业处理软件如ENVI或ERDAS中,则对于该模型在遥感领域的应用和发展具有非常重要的意义。
5 结论
1)MaxEnt比其他3种传统算法(RF,MLC和SVM)更适合云岩河流域的土地利用分类,总体分类精度达到84.06%,Kappa系数为0.80; 利用MaxEnt获取云岩河流域的土地利用图,发现森林是该区域最主要的土地利用类型,其次是灌木、草地、耕地和建设用地。
2)4种不同分类算法对5种地类提取的准确性存在显著差异。4种算法对森林、建设用地的提取都表现较好; MaxEnt和SVM对于草地、耕地的提取表现显著优于其他2种算法; 但MaxEnt对灌木提取的准确性比SVM更好。
3)利用MaxEnt对多光谱影像进行地物信息提取时,其地物识别精度、稳健性等方面都达到或者超过了其他3种传统的分类算法,显示出MaxEnt在遥感多分类研究中的巨大潜力。但是其分类过程的时间效率相对较低,加入并行计算能够提高MaxEnt的时间效率。
4)利用MaxEnt进行遥感多分类的算法仅仅依赖于各个土地利用类型的发生概率,而不依赖阈值的确定方法,从而能够避免由于阈值选择而带来的不确定性。建立的这套技术流程,在其他单分类算法中具有移植性和拓展性。
参考文献
国土调查遥感40年进展与挑战
[J].
DOI:10.12082/dqxxkx.2022.210512
[本文引用: 1]

运用遥感技术进行土地资源调查,摸清其数量及分布状况,长期以来都是遥感领域研究的重要内容。本文首先回顾了过去40年来遥感技术在我国国土调查中的应用情况,然后围绕高分辨率影像的特征提取、大范围影像的样本获取、多时相/多传感器影像的迁移学习以及多源异构数据融合4个方面介绍了相关进展情况;接着归纳总结了现有遥感信息提取技术在国土调查中面临的4个挑战:① 高分辨率影像分类存在如何定义、选择、挖掘高级特征的问题;② 国土调查中的遥感数据集规模庞大,存在着类间不平衡和类内多样性,为这种复杂数据集获取足够、均衡、多样化的样本集是一个巨大挑战;③ 对于多传感器/多时相影像,如何低成本、及时地实现土地利用分类是值得考虑的问题;④ 从土地覆盖到土地利用存在语义鸿沟,如何合适地引入语义信息以弥合语义鸿沟需要被考虑。最后,本文对国土调查遥感技术的未来发展方向和应用点进行了展望。
Forty years’ progress and challenges of remote sensing in national land survey
[J].
Time series analysis for global land cover change monitoring:A comparison across sensors
[J].DOI:10.1016/j.rse.2022.112905 URL [本文引用: 1]
A survey of image classification methods and techniques for improving classification performance
[J].DOI:10.1080/01431160600746456 URL [本文引用: 1]
A maximum entropy approach to one-class classification of remote sensing imagery
[J].DOI:10.1080/01431161003702245 URL [本文引用: 4]
A comparative assessment of machine learning models for landslide susceptibility mapping in the rugged terrain of northern Pakistan
[J].
DOI:10.3390/app12052280
URL
[本文引用: 1]
This study investigated the performances of different techniques, including random forest (RF), support vector machine (SVM), maximum entropy (maxENT), gradient-boosting machine (GBM), and logistic regression (LR), for landslide susceptibility mapping (LSM) in the rugged terrain of northern Pakistan. Initially, a landslide inventory of 200 samples was produced along with an additional 200 samples indicating nonlandslide areas and divided into training (70%) and validation (30%) groups using a stratified loop-based random sampling approach. Then, a geospatial database of 12 possible landslide influencing factors (LIFs) was generated, including elevation, slope, aspect, topographic wetness index (TWI), topographic position index (TPI), distance to drainage, distance to fault, distance to road, normalized difference vegetation index (NDVI), rainfall, land cover/land use (LCLU), and a geological map of the study area. None of the LIFs were redundant for the modeling, as indicated by the multicollinearity test (tolerance > 0.1) and information gain ratio (IGR > 0). We extended the evaluation measures of each algorithm from area-under-the-curve (AUC) analysis to the calculation of performance overall (POA) with the help of precision, recall, F1 score, accuracy (ACC), and Matthew’s correlation coefficient (MCC). The results showed that the SVM was the most promising model (AUC = 0.969, POA = 2669) for the LSM, followed by RF (AUC = 0.967, POA = 2656), GBM (AUC = 0.967, POA = 2623), maxENT (AUC = 0.872, POA = 1761), and LR (AUC = 0.836, POA = 1299). It is important to note that the SVM, RF, and GBM were the top performers, with almost similar accuracy. Thus, each of these could be equally effective for LSM and can be used for risk reduction and mitigation measures in the rugged terrain of Pakistan and other regions with similar topography.
Novel ensemble approaches of machine learning techniques in modeling the gully erosion susceptibility
[J].
DOI:10.3390/rs12111890
URL
[本文引用: 1]
Gully erosion has become one of the major environmental issues, due to the severity of its impact in many parts of the world. Gully erosion directly and indirectly affects agriculture and infrastructural development. The Golestan Dam basin, where soil erosion and degradation are very severe problems, was selected as the study area. This research maps gully erosion susceptibility (GES) by integrating four models: maximum entropy (MaxEnt), artificial neural network (ANN), support vector machine (SVM), and general linear model (GLM). Of 1042 gully locations, 729 (70%) and 313 (30%) gully locations were used for modeling and validation purposes, respectively. Fourteen effective gully erosion conditioning factors (GECFs) were selected for spatial gully erosion modeling. Tolerance and variance inflation factors (VIFs) were used to examine the collinearity among the GECFs. The random forest (RF) model was used to assess factors’ effectiveness and significance in gully erosion modeling. An ensemble of techniques can provide more accurate results than can single, standalone models. Therefore, we compared two-, three-, and four-model ensembles (ANN-SVM, GLM-ANN, GLM-MaxEnt, GLM-SVM, MaxEnt-ANN, MaxEnt-SVM, ANN-SVM-GLM, GLM-MaxEnt-ANN, GLM-MaxEnt-SVM, MaxEnt-ANN-SVM and GLM-ANN-SVM-MaxEnt) for GES modeling. The susceptibility zones of the GESMs were classified as very-low, low, medium, high, and very-high using Jenks’ natural break classification method (NBM). Subsequently, the receiver operating characteristics (ROC) curve and the seed cell area index (SCAI) methods measured the reliability of the models. The success rate curve (SRC) and predication rate curve (PRC) and their area under the curve (AUC) values were obtained from the GES maps. The results show that the ANN model combined with two and three models are more accurate than the other combinations, but the ANN-SVM model had the highest accuracy. The rank of the others from best to worst accuracy is GLM, MaxEnt, SVM, GLM-ANN, GLM-MaxEnt, GLM-SVM, MaxEnt-ANN, MaxEnt-SVM, GLM-ANN-SVM-MaxEnt, GLM-MaxEnt-ANN, GLM-MaxEnt-SVM and MaxEnt-ANN-SVM. The resulting gully erosion susceptibility models (GESMs) are efficient and powerful and could be used to improve soil and water conservation and management.
One-class land-cover classification using MaxEnt:The effect of modelling parameterization on classification accuracy
[J].
DOI:10.7717/peerj.7016
URL
[本文引用: 6]
Multiple-class land-cover classification approaches can be inefficient when the main goal is to classify only one or a few classes. Under this scenario one-class classification algorithms could be a more efficient alternative. Currently there are several algorithms that can fulfil this task, with MaxEnt being one of the most promising. However, there is scarce information regarding parametrization for performing land-cover classification using MaxEnt. In this study we aimed to understand how MaxEnt parameterization affects the classification accuracy of four different land-covers (i.e., built-up, irrigated grass, evergreen trees and deciduous trees) in the city of Santiago de Chile. We also evaluated if MaxEnt manual parameterization outperforms classification results obtained when using MaxEnt default parameters setting. To accomplish our objectives, we generated a set of 25,344 classification maps (i.e., 6,336 for each assessed land-cover), which are based on all the potential combination of 12 different classes of features restrictions, four regularization multipliers, four different sample sizes, three training/testing proportions, and 11 thresholds for generating the binary maps. Our results showed that with a good parameterization, MaxEnt can effectively classify different land covers with kappa values ranging from 0.68 for deciduous trees to 0.89 for irrigated grass. However, the accuracy of classification results is highly influenced by the type of land-cover being classified. Simpler models produced good classification outcomes for homogenous land-covers, but not for heterogeneous covers, where complex models provided better outcomes. In general, manual parameterization improves the accuracy of classification results, but this improvement will depend on the threshold used to generate the binary map. In fact, threshold selection showed to be the most relevant factor impacting the accuracy of the four land-cover classification. The number of sampling points for training the model also has a positive effect on classification results. However, this effect followed a logarithmic distribution, showing an improvement of kappa values when increasing the sampling from 40 to 60 points, but showing only a marginal effect if more than 60 sampling points are used. In light of these results, we suggest testing different parametrization and thresholds until satisfactory kappa or other accuracy metrics values are achieved. Our results highlight the huge potential that MaxEnt has a as a tool for one-class classification, but a good understanding of the software settings and model parameterization is needed to obtain reliable results.
A maximum entropy method to extract urban land by combining MODIS reflectance,MODIS NDVI,and DMSP-OLS data
[J].DOI:10.1080/01431161.2014.960623 URL [本文引用: 3]
夜间灯光遥感数据应用综述和展望
[J].
DOI:10.18306/dlkxjz.2019.02.005
[本文引用: 1]
在遥感应用研究中,夜间灯光遥感作为发展活跃的一个重要分支,近年来受到越来越多来自自然科学领域和社会经济领域的关注。与传统的光学遥感卫星获取地物辐射信息不同,夜间灯光遥感是获取夜间无云条件下地表发射的可见光-近红外电磁波信息。相比于普通的遥感卫星影像,夜间灯光遥感所使用的夜间灯光影像记录的地表灯光强度信息更直接反映人类活动差异,因而被广泛应用于城市化进程研究、不透水面提取、社会经济指标空间化估算、重大事件评估、生态环境评估等领域。目前,虽然基于夜间灯光数据的应用研究成果正在不断积累,但对成果的系统性总结、整理的研究目前存在着覆盖面不全、时效性不强等不足。基于此,论文通过对近几十年来有关夜间灯光数据的研究成果的详细梳理,从数据处理与技术方法、应用研究等方面进行归纳总结。最后,文章从多源数据融合、应用领域拓展和短周期地表灯光监测3个方面指出了未来的研究热点。
Review and prospect of application of nighttime light remote sensing data
[J].
基于SWAT模型定量分析自然因素与人为因素对水文系统的影响——以漳卫南运河流域为例
[J].
DOI:10.31497/zrzyxb.20170882
[本文引用: 1]
“干旱”是由大尺度的气候变化所引起的水分亏缺现象,“水资源短缺”则是因人类长期对水资源不可持续利用引起的水资源亏缺现象。前者无法被水资源管理系统规避,后者则受水资源管理方针政策的影响。然而,通常一个地区由干旱与水资源短缺引起的水分亏缺经常同时发生而且难以区分。因此,论文提出了一种可以定量区分自然因素(干旱)和人为因素(水资源短缺)对水文系统影响的框架,并以漳卫南运河流域为研究对象,利用SWAT模型模拟结果(无人为影响情景下)和观测数据(自然因素和人为因素共同作用结果),对研究区1976—1995年的日径流量序列进行了初步对比和差异性分析。结果表明:1)经率定和验证的SWAT模型能够有效模拟漳卫南运河流域的径流过程;2)无论是丰水年还是枯水年,水资源短缺现象均导致了夏季径流洪峰时期的消失;3)人为因素是引起漳卫南运河流域水文系统发生变化的主要原因,并且人为因素影响造成的径流损失量是自然因素造成径流损失量的4倍。论文提出的框架可以定量化分析自然因素和人为因素对水文系统的相对影响,有助于水资源管理者制定适应干旱与水资源短缺状况的管理政策。
Quantitative analysis of the impact of natural factors and human factors on hydrological system using the SWAT model:The Zhangweinan canal basin case
[J].DOI:10.31497/zrzyxb.20170882 URL [本文引用: 1]
Continuous-time water and sediment-routing model for large basins
[J].DOI:10.1061/(ASCE)0733-9429(1995)121:2(171) URL [本文引用: 1]
Information theory and statistical mechanics
[J].DOI:10.1103/PhysRev.106.620 URL [本文引用: 1]
One-class classification for mapping a specific land-cover class:SVDD classification of Fenland
[J].
Maxent software for modeling species niches and distributions(Version 3.4.1)
[EB/OL]. [2022-08-22]http://-biodiversityinformatics.amnh.org/open_source/maxent/.
光学遥感影像土地利用分类方法综述
[J].
Review of land use classification methods based on optical remote sensing images
[J].
Random forest in remote sensing:A review of applications and future directions
[J].DOI:10.1016/j.isprsjprs.2016.01.011 URL [本文引用: 1]
Analysis of supervised maximum likelihood classification for remote sensing image
[C]//
遥感图像最大似然分类方法的EM改进算法
[J].
The EM-based maximum likelihood classifier for remotely sensed data
[J].
Land cover change assessment using decision trees,support vector machines and maximum likelihood classification algorithms
[J].DOI:10.1016/j.jag.2009.11.002 URL [本文引用: 1]
支持向量机在遥感数据分类中的应用新进展
[J].
DOI:10.11867/j.issn.1001-8166.2009.05.0555
[本文引用: 1]
支持向量机是一种基于统计学习理论的新型机器学习算法,它通过解算最优化问题,在高维特征空间中寻找最优分类超平面,从而解决复杂数据的分类及回归问题。随着应用面的不断扩大,支持向量机在遥感领域也得到了广泛关注。该算法已经成功的应用于遥感数据的土地覆盖、土地利用分类,多时相遥感数据的变化检测,多源遥感数据信息融合等,并且在高光谱遥感数据处理中得到了广泛应用。综述了支持向量机算法在遥感数据分类中的应用。首先对支持向量机的理论进行简要介绍,进而综述了该算法在不同遥感问题中的应用进展,最后阐述了新型支持向量机算法的发展以及在遥感中的应用。
State of the art on remotely sensed data classification based on support vector machines
[J].
DOI:10.11867/j.issn.1001-8166.2009.05.0555
[本文引用: 1]
<p> Support Vector Machine (SVM) is a state-of-the-art machine learning algorithm based on statistical learning theory. It tries to find the optimal classification hyperplane in high dimensional feature space to handle complicated classification and regression problems by solving optimization problems. With the development of the theory and its applications, SVM has been used in remote sensing community successfully. SVM has been applied to land cover/land use classification for remotely sensed data, change detection for multi-temporal remote sensing data, and information fusion for multiple source data. Moreover, it has become a standard technique for hyperspectral data process. In this paper, the applications of SVM in remote sensing are reviewed. First, we introduced the basic theory of the SVM briefly. Then we reviewed the state of the art in different remote sensing applications. At last, we stated the development of several new SVM algorithms, which were derived from the SVM theory, and applications in remote sensing community.</p>
Satellite:Handling and manipulating remote sensing data
[EB/OL]. [2021-10-12]https://cran.r-project.org/web/packages/satellite/index.html.
基于Landsat8卫星影像土地利用景观破碎化研究——以陕西省延安麻塔流域为例
[J].
A study of the landscape fragmentations of land cover structure based on Landsat8 remote sensing image:A case study of Mata watershed in Yanan,Shaanxi Province
[J].
Inter-coder agreement for computational linguistics
[J].
DOI:10.1162/coli.07-034-R2
URL
[本文引用: 1]
This article is a survey of methods for measuring agreement among corpus annotators. It exposes the mathematics and underlying assumptions of agreement coefficients, covering Krippendorff's alpha as well as Scott's pi and Cohen's kappa; discusses the use of coefficients in several annotation tasks; and argues that weighted, alpha-like coefficients, traditionally less used than kappa-like measures in computational linguistics, may be more appropriate for many corpus annotation tasks—but that their use makes the interpretation of the value of the coefficient even harder.
A coefficient of agreement for nominal scales
[J].DOI:10.1177/001316446002000104 URL [本文引用: 1]
In-depth comparisons of MaxEnt,biased SVM and one-class SVM for one-class classification of remote sensing data
[J].DOI:10.1080/2150704X.2016.1265689 URL [本文引用: 2]
增强型DeepLab算法和自适应损失函数的高分辨率遥感影像分类
[J].
Classification of high-resolution remote sensing images based on enhanced Deep Lab algorithm and adaptive loss function
[J].DOI:10.11834/jrs.20209200 URL [本文引用: 1]
基于遥感和多源地理数据的城市土地利用分类
[J].
Urban land use classification based on remote sensing and multi-source geographic data
[J].
2000—2020年黄土高原植被覆盖度时空格局变化分析
[J].
Change of vegetation coverage in the Loess Plateau from 2000 to 2020 and its spatiotemporal pattern analysis
[J].
Projecting species loss and turnover under climate change for 111 Chinese tree species
[J].DOI:10.1016/j.foreco.2020.118488 URL [本文引用: 1]
Maximum entropy modeling of species geographic distributions
[J].DOI:10.1016/j.ecolmodel.2005.03.026 URL [本文引用: 2]
A new method for surface water extraction using multi-temporal Landsat8 images based on maximum entropy model
[J].DOI:10.1080/22797254.2022.2062054 URL [本文引用: 1]
One-class classification of natural vegetation using remote sensing:A review
[J].
DOI:10.3390/rs13101892
URL
[本文引用: 1]
Advances in remote sensing (RS) technology in recent years have increased the interest in including RS data into one-class classifiers (OCCs). However, this integration is complex given the interdisciplinary issues involved. In this context, this review highlights the advances and current challenges in integrating RS data into OCCs to map vegetation classes. A systematic review was performed for the period 2013–2020. A total of 136 articles were analyzed based on 11 topics and 30 attributes that address the ecological issues, properties of RS data, and the tools and parameters used to classify natural vegetation. The results highlight several advances in the use of RS data in OCCs: (i) mapping of potential and actual vegetation areas, (ii) long-term monitoring of vegetation classes, (iii) generation of multiple ecological variables, (iv) availability of open-source data, (v) reduction in plotting effort, and (vi) quantification of over-detection. Recommendations related to interdisciplinary issues were also suggested: (i) increasing the visibility and use of available RS variables, (ii) following good classification practices, (iii) bridging the gap between spatial resolution and site extent, and (iv) classifying plant communities.
Urban flood hazard mapping using machine learning modelings:GARP,RF,MaxEnt and NB
[J].DOI:10.1007/s11069-020-04453-3 [本文引用: 1]
时空大数据背景下并行数据处理分析挖掘的进展及趋势
[J].
DOI:10.18306/dlkxjz.2018.10.002
[本文引用: 1]
随着互联网、物联网和云计算的高速发展,与时间、空间相关的数据呈现出“爆炸式”增长的趋势,时空大数据时代已经来临。时空大数据除具备大数据典型的“4V”特性外,还具备丰富的语义特征和时空动态关联特性,已经成为地理学者分析自然地理环境、感知人类社会活动规律的重要资源。然而在具体研究应用中,传统数据处理和分析方法已无法满足时空大数据高效存取、实时处理、智能挖掘的性能需求。因此,时空大数据与高性能计算/云计算融合是必然的发展趋势。在此背景下,本文首先从大数据的起源出发,回顾了大数据概念的发展历程,以及时空大数据的特有特征;然后分析了时空大数据研究应用产生的性能需求,总结了底层平台软硬件的发展现状;进而重点从时空大数据的存储管理、时空分析和领域挖掘3个角度对并行化现状进行了总结,阐述了其中存在的问题;最后指出了时空大数据研究发展趋势。
Research progress and trends of parallel processing,analysis,and mining of big spatiotemporal data
[J].
