

0 引言
流域生态风险评价为评估由一种或多种外界因素导致可能发生或正在发生的不利生态影响的过程[4-5],反映了一种或多种因素对生态系统的负面影响,可表征气候变化和人类活动对流域生态系统的威胁程度,从而揭示生态过程的机理和发展趋势[6]。早期生态风险评价更多的只是在理论方面探讨或针对某一单一受体和风险源[7]。近年来更加关注生态风险的空间分布和对生态系统服务的影响,评价规模从单个有机体扩展到流域、区域[8-9]。随着对土地利用和生态风险研究的深入,从土地利用视角评估流域生态风险逐渐成为研究的主流,主要评价方法有景观指数法和相对风险模型[10]。景观指数法是选择与生态风险相关的景观格局指数构建评价模型,通常对研究区进行风险小区划分,目前以基于等间距采样的格网最为常见[11]。Paukert等[12]利用景观指数法构建的生态风险指数对科罗拉多河流域进行生态健康度评价; Tian等[13]采用景观指数法结合空间统计分析法对甬江流域生态风险时空变化特征进行了分析; 张玉娟等[14]以景观指数法结合层次分析法对松花江流域哈尔滨段流域生态风险进行监测评价。相对风险模型是一种区域复合压力风险评价模型,目前也广泛应用于流域生态风险的研究中[15]。Obery等[16]应用相对风险模型对美国 Codorus Creek 流域进行了区域生态风险评估和模型的适用性研究; 乔蕻强等[17]通过构建了土地利用生态风险定量评价体系,借助相对风险模型对石羊河流域的生态风险进行了评价。景观指数法在不依赖大量实测数据的条件下实现对多源风险的综合表征和时空分异表达,较相对风险模型更有利于风险空间异质性的表达,更适用于流域尺度的景观生态风险评价[18]。尽管当下对流域生态风险评价方法已经比较成熟,也有了大量的实际应用案例,但评价过程中缺乏对多生态风险状态进行分析,对生态风险的时空演化特征也缺乏研究[19]。目前针对景观生态风险驱动力分析多从定性方面入手,缺乏定量研究[20]。综合以上原因,本文选用景观指数法对内蒙古段黄河流域进行生态风险时空演化格局分析,并探讨其驱动因素。
由于内蒙古黄河流域自然气候条件和地表植被条件相对较差,且区域开发和不合理的治理,导致该流域的生态屏障功能出现严重的退化现象。但目前针对该流域的生态风险评估较少,因此对土地利用格局演变带来的生态风险评估十分重要的意义。本研究基于不同时期的土地利用数据,利用景观指数法对流域的生态风险进行监测评价,为流域的生态环境保护和土地资源合理开发提供有力依据。
1 研究区及其数据源
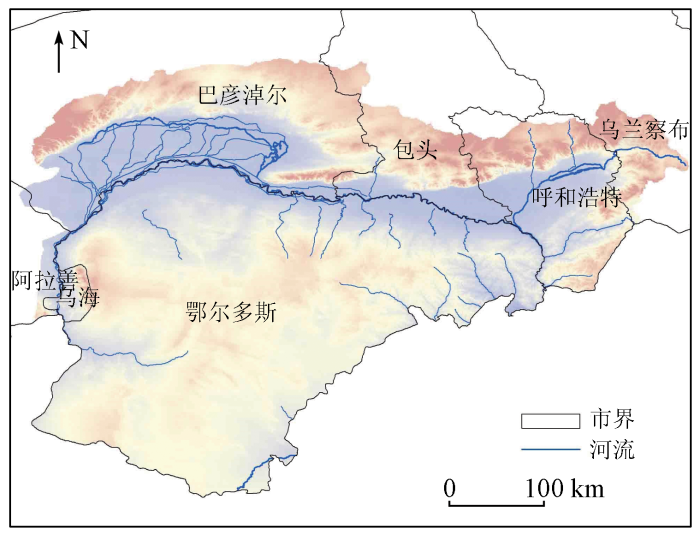
1.1 研究区概况
图1
1.2 数据获取及预处理
1)土地利用数据。土地利用数据为空间分辨率1 km的Landsat TM/OLI目视解译数据,是由中科院资源环境科学数据云平台(
2)ERA5气象数据。本文选用的气象再分析资料为ECMWF公开的ERA5数据(
2 研究方法
1)土地利用动态度。土地利用动态度可表达规定时间段区域内某种土地利用类型数量的变化情况[23],表达式为:
式中:
综合土地利用动态度可描述区域整体土地利用变化的速度,表达式为:
式中:
2)土地类型转化。为获取不同土地利用类型之间的相互转化过程,将不同时期土地利用类型图及主体功能区边界图进行空间叠置计算,由此得到各时期土地利用转化的空间分布和土地利用类型转移矩阵,计算公式为:
式中: p为面积; n和m为转移前后的土地利用类型数; i和j(i=1,2, …,n; j=1,2,…,m)分别为转移前与转移后的土地利用类型;
3)生态风险区的划分。本研究采用等间距网格采样分析法,根据所使土地类型数据内各用地类型斑块的实际大小和分散程度,将研究区划分为若干15 km×15 km网格作为小区。计算各区的生态风险值并作为该区中心处生态风险值[24]。
4)景观生态风险指数的计算。本研究采用景观生态风险指数来表示研究区受外界影响产生生态损失的相对值。计算公式[25]为:
式中:
景观损失度指数Ri表示在外界影响下,生态系统内各类景观类型所承受的生态损坏程度大小,通过景观干扰度指数Ei及景观脆弱度指数Fi计算得出,具体公式[26]为:
景观干扰度指数是在自然生态系统内,外界干扰对各景观类型影响的相对大小,由景观破碎度指数Ci、景观分离度指数Si及景观优势度指数Di权重指数通过归一化处理得到,具体计算公式[27]为:
5)风险区划分。基于自然断点法[30]统一间隔为0.012,将风险值ERI划分为低生态风险区(ERI≤0.012)、较低生态风险区(0.012<ERI≤0.024)、中生态风险区(0.024<ERI≤0.036)、较高生态风险区(0.036<ERI≤0.048)及高生态风险区(ERI>0.048)5个等级。
3 结果与分析
3.1 土地利用变化
3.1.1 土地利用面积变化
内蒙古黄河流域1980年、2000年和2020年的各类土地分布如图2所示,结合其面积统计图3可知,1980年研究区各土地利用类型面积由高到低依次为草地、未利用地、耕地、林地、水域、建设用地。2000年各类土地面积排序稍有变化,建设用地比水域多出214 km2。2020年各类土地面积排序与2000年保持一致。在各年份中,草地为主要用地类型,面积占比一直高达50%以上。从研究期间土地利用类型变化角度来看,耕地面积一直呈现下降趋势,减少了578 km2。林地面积则一直呈上升趋势,增加1 055 km2,2000—2020年面积增长最为显著,达968 km2。草地面积在一直呈下降趋势,减少了1 911 km2,其中2000—2020年减少面积的占比高达89.53%。研究期间水域面积减少了383 km2,主要发生变化的年段为2000—2020年。建设用地面积一直呈上升趋势,增加了2 072 km2,2000—2020年就增加了1 822 km2。未利用地面积是先增加后减少,2020年的面积比1980年减少了225 km2。
图2
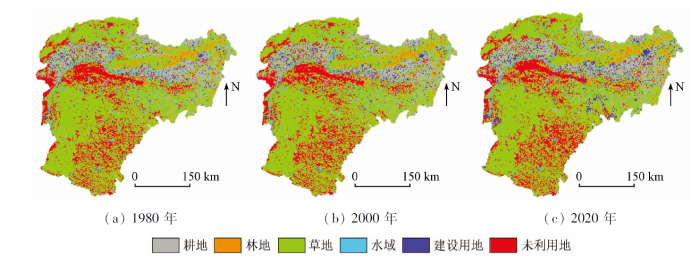
图3

图3
历年研究区各种土地类型面积统计
Fig.3
Area statistics of various land types in the study area over the years
3.1.2 土地利用动态度分析
表1为1980—2020年,单一土地和综合土地在不同时间段的土地利用动态度。分析其各年段的数据可知,综合土地利用动态度由1980—2000年的0.09%上升到了2000—2020年的0.94%,说明土地整体利用度在不断地上升。从单一土地类型的角度分析,耕地、林地、水域、建设用地的土地利用类型动态度都有不同程度的提升,其中以建设用地的提升最为突出,为1.96百分点。草地和未利用地的土地利用类型动态度都有不同程度的下降,其中以未利用地下降了0.22百分点最为明显。
表1 研究区1980—2000年、2000—2020年各类土地利用动态度变化
Tab.1
| 土地利用类型 | 1980—2000年 | 2000—2020年 |
|---|---|---|
| 耕地 | -0.07 | -0.06 |
| 林地 | 0.07 | 0.75 |
| 草地 | -0.01 | -0.10 |
| 水域 | -0.47 | 0.00 |
| 建设用地 | 0.34 | 2.30 |
| 未利用地 | 0.09 | -0.13 |
| 综合土地利用 | 0.09 | 0.94 |
3.1.3 土地利用转移分析
表2 研究区1980—2000年土地利用类型转移面积及比例
Tab.2
| 用地类型 | 耕地 | 林地 | 草地 | 水域 | 建设用地 | 未利用地 | ||||||
|---|---|---|---|---|---|---|---|---|---|---|---|---|
| 面积/km2 | 比例/% | 面积/km2 | 比例/% | 面积/km2 | 比例/% | 面积/km2 | 比例/% | 面积/km2 | 比例/% | 面积/km2 | 比例/% | |
| 耕地 | 20 077 | 93.7 | 31 | 0.1 | 871 | 4.1 | 66 | 0.3 | 95 | 0.4 | 276 | 1.3 |
| 林地 | 19 | 0.3 | 6 250 | 97.7 | 113 | 1.8 | 3 | 0 | 6 | 0.1 | 6 | 0.1 |
| 草地 | 558 | 0.7 | 125 | 0.2 | 80 498 | 97.4 | 118 | 0.1 | 118 | 0.1 | 1 251 | 1.5 |
| 水域 | 225 | 5.4 | 24 | 0.6 | 192 | 4.6 | 3 473 | 84.0 | 13 | 0.3 | 206 | 5.0 |
| 建设用地 | 0 | 0 | 0 | 0 | 0 | 0 | 0 | 0 | 3 713 | 100 | 0 | 0 |
| 未利用地 | 222 | 0.7 | 54 | 0.2 | 794 | 2.5 | 89 | 0.3 | 18 | 0.1 | 30 250 | 96.3 |
表3 研究区2000—2020年土地利用类型转移面积及比例
Tab.3
| 用地类型 | 耕地 | 林地 | 草地 | 水域 | 建设用地 | 未利用地 | ||||||
|---|---|---|---|---|---|---|---|---|---|---|---|---|
| 面积/km2 | 比例/% | 面积/km2 | 比例/% | 面积/km2 | 比例/% | 面积/km2 | 比例/% | 面积/km2 | 比例/% | 面积/km2 | 比例/% | |
| 耕地 | 10 471 | 49.6 | 925 | 4.4 | 6 066 | 28.7 | 601 | 2.8 | 1 886 | 8.9 | 1 152 | 5.5 |
| 林地 | 673 | 10.4 | 2 697 | 41.6 | 2 487 | 38.4 | 105 | 1.6 | 233 | 3.6 | 289 | 4.5 |
| 草地 | 6 298 | 7.6 | 3 007 | 3.6 | 59 820 | 72.5 | 1 306 | 1.6 | 2 169 | 2.6 | 9 868 | 12.0 |
| 水域 | 546 | 14.6 | 104 | 2.8 | 1 274 | 34.0 | 999 | 26.6 | 149 | 4.0 | 677 | 18.1 |
| 建设用地 | 1 547 | 39.0 | 177 | 4.5 | 1 145 | 28.9 | 117 | 3.0 | 763 | 19.3 | 214 | 5.4 |
| 未利用地 | 1 303 | 4.1 | 542 | 1.7 | 9 965 | 31.2 | 622 | 1.9 | 585 | 1.8 | 18 972 | 59.3 |
于建设用地,高达73.4%,转化为耕地、草地和未利用地的比例分别为14.6%,34.0%和18.1%。耕地和未利用地的转移面积分别从1980—2000年转移的1 339 km2和1 177 km2上升到了2000—2020年的10 630 km2和13 017 km2,两者主要转换为草地,转移比例分别占其面积的28.7%和31.2%。林地的转移面积由1980—2000年的147 km2上升到了2000—2020年的3 787 km2,主要转化为草地和耕地,比例为38.4%和10.4%。
3.2 土地利用生态风险评价
3.2.1 景观格局指数变化
由表4可知,林地的斑块数量在1980—2000年增加了19个,2000—2020年增幅大幅度上升,增加了425个; 其景观破碎度、优势度、干扰度明显上升,景观分离度明显的下降,脆弱度和损失度未变,说明越来越多的林地斑块趋于分散,但大面积比例斑块在不断增加,尽管干扰有所增加,但生态脆弱度没有发生变化。建设用地斑块数量在1980—2000年增加了47个,2000—2020年增加了343个,其景观破碎度、分离度和损失度都在下降,景观优势度和干扰度在不断上升,脆弱度未变,说明尽管2000—2020年建设用地在快速扩张,但大面积斑块在不断聚集,生态损失度却在下降。1980—2000年水域斑块数量下降了73个,2000—2020年下降了10个,景观破碎度、脆弱度和损失度变化不大,干扰度和分离度在不断上升,优势度在不断下降,说明越来越少的水域斑块在外界干扰下分布越来越分散,大面积水域在不断地萎缩。耕地的斑块数量在1980—2000年增减少了7个,2000—2020年增加了21个,景观优势度有所下降,分离度在不断上升,其他景观数据几乎无变化,说明大面积耕地斑块在不断减少,而空间分布越来越分散,但生态脆弱性变化不大。草地斑块的数量在1980—2000年下降了38个,2000—2020年又上升了77个,景观干扰度有所下降,其余景观指数没有明显变化,说明草地保护在不断加强,促使草地的恢复。未利用地斑块的数量在1980—2000年下降了47个,2000—2020年又上升了6个,各类景观指数除景观优势度略下降0.0054外,其余景观指数整体上比较稳定。
表4 内蒙古黄河流域景观格局指数
Tab.4
| 土地利用类型 | 年份 | 面积 | 斑块数 | 景观 | 景观 | 景观 | 景观 | 景观 | 景观 |
|---|---|---|---|---|---|---|---|---|---|
| /km2 | /个 | 破碎度 | 分离度 | 优势度 | 干扰度 | 脆弱度 | 损失度 | ||
| 耕地 | 1980年 | 21 416 | 2 086 | 0.001 0 | 0.041 3 | 0.152 4 | 0.028 2 | 0.190 5 | 0.005 4 |
| 2000年 | 21 101 | 2 093 | 0.001 0 | 0.042 0 | 0.151 3 | 0.028 3 | 0.190 5 | 0.005 4 | |
| 2020年 | 20 838 | 2 114 | 0.001 0 | 0.042 7 | 0.147 2 | 0.028 1 | 0.190 5 | 0.005 4 | |
| 林地 | 1980年 | 6 397 | 1 478 | 0.002 3 | 0.116 3 | 0.064 0 | 0.042 7 | 0.095 2 | 0.004 1 |
| 2000年 | 6 484 | 1 497 | 0.002 3 | 0.115 5 | 0.065 1 | 0.042 5 | 0.095 2 | 0.004 0 | |
| 2020年 | 7 452 | 1 922 | 0.002 6 | 0.113 8 | 0.076 3 | 0.043 3 | 0.095 2 | 0.004 1 | |
| 草地 | 1980年 | 82 668 | 1 873 | 0.000 2 | 0.010 1 | 0.454 5 | 0.048 6 | 0.142 9 | 0.006 9 |
| 2000年 | 82 468 | 1 835 | 0.000 2 | 0.010 1 | 0.453 0 | 0.048 4 | 0.142 9 | 0.006 9 | |
| 2020年 | 80 757 | 1 912 | 0.000 2 | 0.010 5 | 0.443 2 | 0.047 6 | 0.142 9 | 0.006 8 | |
| 水域 | 1980年 | 4 133 | 1 450 | 0.003 5 | 0.178 3 | 0.052 1 | 0.060 8 | 0.238 1 | 0.014 5 |
| 2000年 | 3 749 | 1 377 | 0.003 7 | 0.191 5 | 0.048 8 | 0.064 5 | 0.238 1 | 0.015 4 | |
| 2020年 | 3 750 | 1 367 | 0.003 6 | 0.190 8 | 0.046 5 | 0.064 1 | 0.238 1 | 0.015 3 | |
| 建设用地 | 1980年 | 3 713 | 2 287 | 0.006 2 | 0.249 2 | 0.068 1 | 0.063 0 | 0.047 6 | 0.004 1 |
| 2000年 | 3 963 | 2 334 | 0.005 9 | 0.235 9 | 0.070 7 | 0.081 4 | 0.047 6 | 0.003 9 | |
| 2020年 | 5 785 | 2 677 | 0.004 6 | 0.173 1 | 0.083 2 | 0.085 3 | 0.047 6 | 0.003 0 | |
| 未利用地 | 1980年 | 31 427 | 2 384 | 0.000 8 | 0.030 1 | 0.209 0 | 0.030 4 | 0.285 7 | 0.008 7 |
| 2000年 | 31 989 | 2 337 | 0.000 7 | 0.029 2 | 0.211 1 | 0.030 3 | 0.285 7 | 0.008 7 | |
| 2020年 | 31 172 | 2 343 | 0.000 8 | 0.030 0 | 0.203 6 | 0.029 8 | 0.285 7 | 0.008 5 |
3.2.2 土地利用生态风险时空变化
由表5结合图4可知1980年低生态风险区所占比例为46.71%,大部分低生态风险区主要集中于呼和浩特市、包头市、巴彦淖尔市、乌兰察布市及鄂尔多斯市东北部地区,这些区域的耕地和林地面积明显高于其他地区。较低生态风险区所占比例为34.90%,主要集中在鄂尔多斯市东北部以外区域。中风险区主要集中在研究区的中部和西南部地区,占比为13.56%。较高和高风险区的占比分别为1.34%和3.49%,分散分布在阿拉善盟和流域北部边沿地区,主要土地利用类型为未利用地和耕地。2000年与1980年相比,低风险区面积增加了450 km2,主要位于呼和浩特市和鄂尔多斯市。较低和较高风险区面积没有发生变化。中风险区和高风险区面积都减少了225 km2。2020年与2000年相比,生态风险等级有明显下降的趋势。低风险区面积增加了5 400 km2,主要集中在呼和浩特市、包头市和鄂尔多斯市北部地区。较低风险区的面积增加了3 150 km2,主要在鄂尔多斯市南部地区。中风险区、较高和高风险区分别下降了7 425 km2,450 km2和675 km2。
表5 研究区各生态风险等级的面积及比例
Tab.5
| 风险等级 | 1980年 | 2000年 | 2020年 | |||
|---|---|---|---|---|---|---|
| 面积/ km2 | 比例/ % | 面积/ km2 | 比例/ % | 面积/ km2 | 比例/ % | |
| 低风险区 | 78 300 | 46.71 | 78 750 | 46.98 | 84 150 | 50.20 |
| 较低风险区 | 58 500 | 34.90 | 58 500 | 34.90 | 61 650 | 36.78 |
| 中风险区 | 22 725 | 13.56 | 22 500 | 13.42 | 15 075 | 8.99 |
| 较高风险区 | 2 250 | 1.34 | 2 250 | 1.34 | 1 800 | 1.07 |
| 高风险区 | 5 850 | 3.49 | 5 625 | 3.36 | 4 950 | 2.95 |
图4
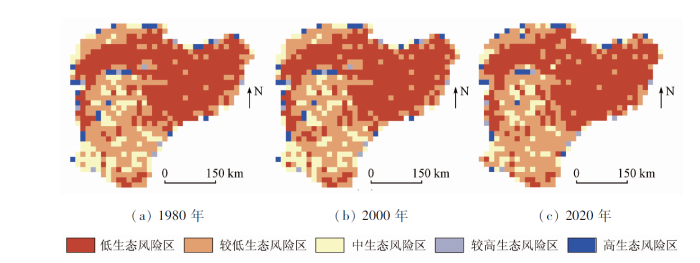
图4
研究区1980—2020年生态风险等级分布
Fig.4
Ecological risk grade distribution of the study area from 1980 to 2020
3.2.3 生态风险等级转移分析
由表6可知,1980—2020年的各风险区等级间转移面积和比例都很小。其中,转移比较明显的是较低风险区,转出率达5.0%,4.2%转移到了低风险区,剩余的转移到中风险区。低风险区和中风险区分别向较低风险区转入了2.6%和2.0%。高风险区向中风险区转移了3.8%。2000—2020年各风险等级间转移面积和比例呈现大幅增加趋势,如表7所示,较高风险区转出率高达70%,向较低、较高和高风险区分别转移了30%,20%和20%。其他等级风险区转移到低风险区和较低风险区的面积分别为11 025 km2和16 200 km2,转移到较高和高风险区的面积为1 125 km2和1 350 km2。虽然转移的方向主要是由高等级风险区转移到低等级风险区,但仍存在不少低等级向高等级转移的情况。结合图2和图4可知,高等级风险区向低等级风险区的转移主要发生在包头市、呼和浩特市、乌兰察布市和鄂尔多斯市的南部,土地利用类型转移主要为耕地和草地向建设用地和林地转移,低等级风险区向高等级风险区转移的地区主要在巴彦淖尔市、阿拉善盟和鄂尔多斯市东部边沿地区,土地转移类型主要为草地、水域向未利用地转移。
表6 1980—2000年各生态风险等级转移面积及比例
Tab.6
| 风险等级 | 低风险区 | 较低风险区 | 中风险区 | 较高风险区 | 高风险区 | |||||
|---|---|---|---|---|---|---|---|---|---|---|
| 面积/km2 | 比例/% | 面积/km2 | 比例/% | 面积/km2 | 比例/% | 面积/km2 | 比例/% | 面积/km2 | 比例/% | |
| 低风险区 | 76 275 | 97.4 | 2 025 | 2.6 | 0 | 0 | 0 | 0 | 0 | 0 |
| 较低风险区 | 2 475 | 4.2 | 55 575 | 95.0 | 450 | 0.8 | 0 | 0 | 0 | 0 |
| 中风险区 | 0 | 0 | 450 | 2.0 | 21 825 | 98.0 | 0 | 0 | 0 | 0 |
| 较高风险区 | 0 | 0 | 0 | 0 | 0 | 0 | 2 250 | 100 | 0 | 0 |
| 高风险区 | 0 | 0 | 0 | 0 | 225 | 3.8 | 0 | 0 | 5 625 | 96.2 |
表7 2000—2020年各生态风险等级转移面积及比例
Tab.7
| 风险等级 | 低风险区 | 较低风险区 | 中风险区 | 较高风险区 | 高风险区 | |||||
|---|---|---|---|---|---|---|---|---|---|---|
| 面积/km2 | 比例/% | 面积/km2 | 比例/% | 面积/km2 | 比例/% | 面积/km2 | 比例/% | 面积/km2 | 比例/% | |
| 低风险区 | 73 125 | 92.9 | 5 625 | 7.1 | 0 | 0 | 0 | 0 | 0 | 0 |
| 较低风险区 | 10 575 | 18.1 | 45 450 | 77.7 | 2 475 | 4.2 | 0 | 0 | 0 | 0 |
| 中风险区 | 450 | 2 | 9 225 | 41 | 11 700 | 52 | 225 | 1 | 900 | 4 |
| 较高风险区 | 0 | 0 | 675 | 30 | 450 | 20 | 675 | 30 | 450 | 20 |
| 高风险区 | 0 | 0 | 675 | 12 | 450 | 8 | 900 | 16 | 3 600 | 64 |
4 讨论
1)气候是生态环境形成与演变的重要推动力之一,研究气候变化对了解区域生态环境变化具有十分重要的意义[30]。研究区处于干旱半干旱地带,干旱少雨,年平均降水量不足400 mm,生态环境较为脆弱。Xu等[31]在2020年利用中国区域7个IGS站实测气象数据评估ERA5数据的精度,发现ERA5数据精度优于早先的ERA-Interim数据,ERA5数据能够更好地满足中国区域内气候建模的需求。因此,本文利用ERA5气象数据统计研究区年降水量和年均气温。为了了解降水对各生态风险等级作用情况,利用图4计算出1980—2020年生态风险等级未变区域、退化区域、改善区域,并进一步统计各区的降水变化趋势。由图5可知,各区降水都有略微的下降趋势,其中下降最明显的是退化区,其次是未变区域,改善区域降水下降幅度最小。而本研究结论是研究区生态风险等级整体向改善方向发展,改善区域降水下降幅度较小,可以对生态风险的恶化起到一定的缓解作用,但无法解释生态环境整体向好的趋势发展。由图6可知,40 a间各生态风险等级转化区年均温度都呈现上升趋势,其中上升最明显的是退化区,其次是未变化区域,最后是改善区。随着气温上升,土壤水分的蒸发和植被的蒸腾作用加强,给本就干旱的研究区植被生长带来不利的因素。综上可见,气候因子影响着区域生态环境的改变,但不是区域生态环境不断改善的主因。
图5
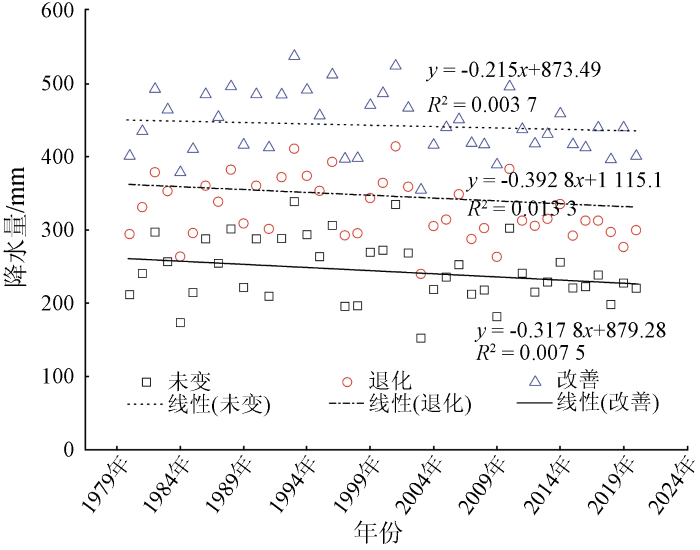
图5
研究区1980—2020年各生态风险等级变化区年降水量(退化区+100 mm,改善区+200 mm)
Fig.5
Annual precipitation of each ecological risk grade change area in the study area from 1980 to 2020 (degraded area +100 mm, improved area +200 mm)
图6
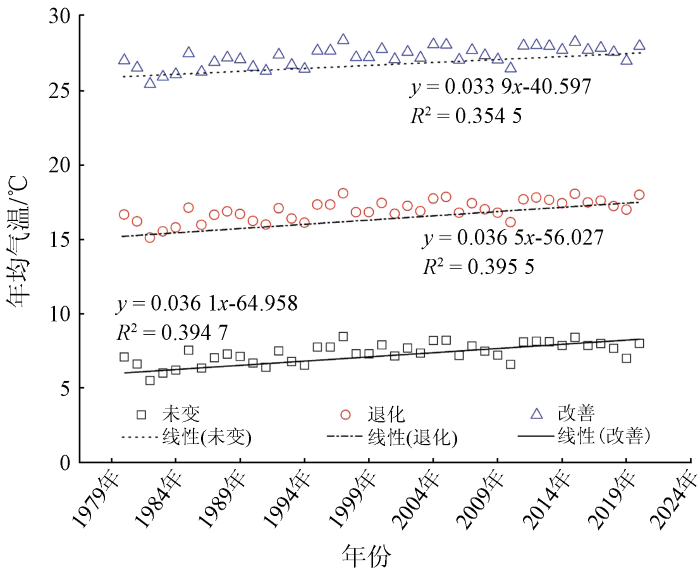
图6
研究区1980—2020年各生态风险等级变化区年降水量(退化区+10℃,改善区+20℃)
Fig.6
Annual precipitation of each ecological risk grade change area in the study area from 1980 to 2020 (degraded area + 10 ℃, improved area + 20 ℃)
土地利用/土地覆盖变化是陆地表层环境对人类活动和气候变化的具体反映,是气候变化和环境变化研究关注的主要内容[32]。张文慧等[30]2020年对黄河流域土地利用变化进行研究。结果发现1980—2018年期间内蒙古段黄河流域耕地、林地和建设用地面积在增加,草地、水域和未利用地的面积在减少。这个结果除了耕地2018年增加外,其余结果与本文研究结论一致。导致耕地面积变化差异的原因是研究年份的不同(图7)。由2.2节可知,土地利用变化和生态风险等级变化有着密切的关系。1980—2020年间研究区整体低风险等级区面积在增加、高风险区在减少,主要原因在于研究期间耕地、草地和未利用地向建设用地和林地大面积的转移,景观优势度明显上升,景观破碎度、景观分离度明显下降,风险等级在不断地向低等级转化。导致各类型土地利用面积的变化主要得益于研究区1999年开始实施的退耕还林还草工程、天然林保护工程、水土保持综合治理工程、重点小流域以及沙棘造林等一系列工程,越来越多的未利用地被开发利用变为建设用地,土地利用率在不断提高,各种人类工程的实施是导致研究区生态环境改善的主因[33]。
图7
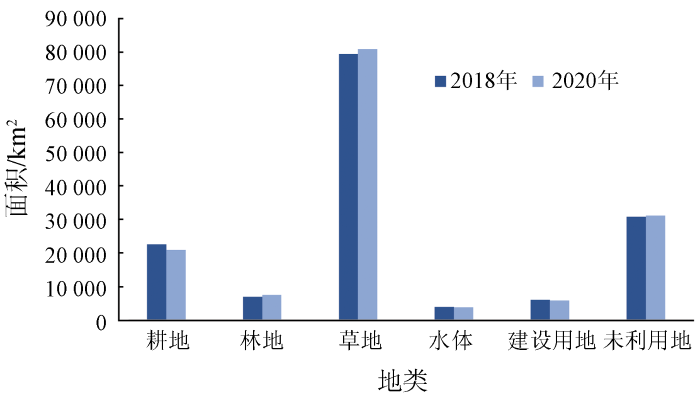
图7
2018年和2020年研究区各类型土地面积统计
Fig.7
Statistics of various types of land use area in the study area in 2018 and 2020
本文与2021年刘希朝等[33]针对内蒙古段黄河流域生态风险区分布进行对比,结果发现低等级的风险区主要分布在东北部地区,高等级生态风险区分布在西南方向和东部,和本研究分布基本一致; 但部分中等级风险区出现在了东北部这与本次研究中风险区主要集中在中部和西南部地区,研究结果有一定的差异。导致结果部分差异可能与风险小区的划分的大小与研究时段的不同,其划分的小区为30 km×30 km,而本研究划分的小区为15 km×15 km,小区大小的不同影响到景观指数计算进而影响到风险指数的计算结果; 其研究时长为2000—2018年,本研究时长为1980—2020年。但总体来看两者都是低生态风险等级面积在逐渐的增加,高风险等级区域面积在不断减少,研究区生态环境得到了极大的改善。
2)本研究所用的土地利用数据空间分辨率为1 km,还存在栅格数据向矢量数据转变等操作,导致土地利用面积在统计时有一定误差,但这种误差针对本研究大的研究范围来看,基本可以表征出研究区生态环境的变化趋势。本文利用15 km×15 km网格尺度诊断黄河流域生态风险的时空分异特征,但合理小区划分尺度与区域整体景观指数过渡的准确性还有待进一步探讨。
5 结论
本文基于1980年、2000年和2020年3期土地利用数据,在分析土地利用和景观格局指数变化的基础上研究内蒙古黄河流域土地利用及风险区等级的变化,得出结论如下:
1)1980—2020年间研究区土地利用变化主要表现为建设用地和林地的增加及草地和耕地的减少。土地转移的方向主要为草地、耕地和水域转变为建设用地和林地。综合土地利用动态度由1980—2000年的0.09%上升到了2000—2020年的0.94%,土地综合利用度在不断地上升。
2)从景观格局指数变化角度来看,斑块数量除水域和未利用地减少外其余用地均增加,景观破碎化程度除建设用地外其余用地均增加,景观干扰度除林地上升外其余用地均减少,景观损失度除建设用地有明显下降外其余用地无明显变化。
3)从生态风险等级空间分布角度来看,低生态风险区主要集中在内蒙古黄河流域的东北部,低和较低生态风险区都出现了一定扩张的现象,低风险区有从东北向西南蔓延的趋势,但不同风险等级区分布的主要位置没有大的变化。
4)研究区风险等级在相互转移过程中,转移方向大多是由高等级风险区向低等级风险区转移,转移量达27 225 km2,低等级风险区向高等级风险区共转移了2 475 km2,低和较低等级风险区面积增加9 000 km2,较高和高等级风险区面积减少1 350 km2,其转移方向和量主要取决于土地利用类型的变化。
参考文献
黄河流域的综合治理与可持续发展
[J].
DOI:10.11821/dlxb201912001
[本文引用: 1]

黄河流域与黄河所经地区在国家发展中具有极为重要的战略地位。2019年9月习近平总书记在郑州主持召开黄河流域生态保护和高质量发展座谈会上发表了重要讲话,具有重大战略意义。本文对黄河流域的综合治理与可持续发展形成了初步认识,指出新时代黄河流域全面深刻转型发展的任务仍然艰巨,需转变理念,持续推进能源清洁高效利用,因地制宜重点推进产业发展,不搞粗放式大开发,搞好资源耕地保护等方面应是推进黄河流域综合治理及保障可持续发展的重要举措,认为“黄河经济带”在全国经济层面上不存在,目前不适宜将“黄河三角洲”确定为国家战略。
Development and management tasks of the Yellow River basin:A preliminary understanding and suggestion
[J].
Watershed management in an urban setting:Process,scale and administration
[J].DOI:10.1016/j.landusepol.2011.05.003 URL [本文引用: 1]
Landscape ecological safety assessment and landscape pattern optimization in arid inland river basin:Take Ganzhou District as an example
[J].DOI:10.1080/10807039.2018.1536521 URL [本文引用: 1]
土地利用生态风险评价研究进展
[J].
DOI:10.31497/zrzyxb.20200306
[本文引用: 1]
土地利用生态风险评价是对生态系统在土地利用直接或间接作用下可能产生的不利影响的评价。在梳理已有研究工作的基础上,从评价模型、生态风险空间表达和不确定性分析三个方面,总结土地利用生态风险评价研究方法的进展,阐述土地利用生态风险管理在土地利用生态风险评价中的地位和作用。目前该领域存在的主要问题是:(1)评价指标和评价标准不统一;(2)评价过程和评价结果的不确定性较大;(3)生态风险管理环节研究薄弱。未来的发展趋势包括:(1)关注全球变化条件下的土地利用生态风险;(2)重视土地利用生态风险评价在国土空间规划与生态修复中的作用;(3)加强土地利用生态风险管理研究;(4)建立并完善土地利用生态风险评价的数据管理平台。
A review on ecological risk assessment of land use
[J].
DOI:10.31497/zrzyxb.20200306
[本文引用: 1]
Ecological risk assessment is the foundation of prevention and control of ecological risks. Its development has experienced a process from environmental impact assessment to environmental risk assessment and then to ecological risk assessment gradually. With the further research on global change and ecological risk, more and more attention has been paid to the ecosystem risk caused by the change of land use. Therefore, ecological risk assessment of land use is also an important part of ecological risk research, which is the assessment of the possible adverse effects of the ecosystem under the direct or indirect impacts of land use. Through reviewing the existing researches, in this paper we summarize the progresses in methodology of ecological risk assessment of land use from three aspects: assessment model, spatial expression of ecological risk and uncertainty analysis. And we also expound the status and function of land use ecological risk management in land use ecological risk assessment. There exist three main problems in this field: (1) The evaluation index and standard of ecological risk assessment of land use are not unified; (2) There is great uncertainty with evaluation process and relevant result; (3) The research on ecological risk management is rather limited. The future trends of the study in this field include: (1) More attention should be paid to the ecological risk of land use under the background of global change, which needs to be more integrated with other fields of research and deal with the effect of ecological environment on global change; (2) The role of land use ecological risk assessment in land space planning and ecological restoration should be emphasized, which will give us a deep understanding of the current condition of the ecosystem and in an effort to maintain the sustainable development of the ecological environment; (3) The study of ecological risk management of land use is supposed to be strengthened, especially the link between risk management and assessment; (4) Ecological risk assessment and data management platform ought to be established and improved. It will standardize the risk index system, evaluation method and data acquisition, and reduce the uncertainty in the evaluation process effectively. What's more, our essay will enrich the theoretical system and provide related reference materials in this field.
Mechanistic effect models for ecological risk assessment of chemicals(MEMRisk):A new SETAC-Europe Advisory Group
[J].DOI:10.1007/s11356-009-0124-6 URL [本文引用: 1]
Hazard assessment of landslide disaster using information value method and analytical hierarchy process in highly tectonic Chamba region in bosom of Himalaya
[J].DOI:10.1007/s11629-017-4634-2 [本文引用: 1]
A Bayesian approach to landscape ecological risk assessment applied to the upper Grande Ronde watershed,Oregon
[J].DOI:10.1080/10807039.2012.707925 URL [本文引用: 1]
Landscape ecological risk assessment in Qinling Mountain
[J].DOI:10.1002/gj.v53.S1 URL [本文引用: 1]
近20年来巢湖流域景观生态风险评估与时空演化机制
[J].
Landscape ecological risk assessment and its mechanism in Chaohu basin during the past almost 20 years
[J].DOI:10.18307/2016.0411 URL [本文引用: 1]
Urban-rural ecological networks for landscape planning
[J].DOI:10.1016/j.landusepol.2015.10.004 URL [本文引用: 1]
Ecological risk assessment of land use change in the Poyang Lake Ecoeconomic Zone,China
[J].DOI:10.3390/ijerph10010328 URL [本文引用: 1]
Development and assessment of a landscape-scale ecological threat index for the Lower Colorado River basin
[J].DOI:10.1016/j.ecolind.2010.05.008 URL [本文引用: 1]
Research on land use changes and ecological risk assessment in Yongjiang River basin in Zhejiang Province,China
[J].
DOI:10.3390/su11010001
URL
[本文引用: 1]
Urban agglomeration, an established urban spatial pattern, contributes to the spatial association and dependence of city-level CO2 emission distribution while boosting regional economic growth. Exploring this spatial association and dependence is conducive to the implementation of effective and coordinated policies for regional level CO2 reduction. This study calculated CO2 emissions from 2005–2016 in the Chengdu-Chongqing urban agglomeration with the IPAT model, and empirically explored the spatial structure pattern and association effect of CO2 across the area leveraged by the social network analysis. The findings revealed the following: (1) The spatial structure of CO2 emission in the area is a complex network pattern, and in the sample period, the CO2 emission association relations increased steadily and the network stabilization remains strengthened; (2) the centrality of the cities in this area can be categorized into three classes: Chengdu and Chongqing are defined as the first class, the second class covers Deyang, Mianyang, Yibin, and Nanchong, and the third class includes Zigong, Suining, Meishan, and Guangan—the number of cities in this class is on the rise; (3) the network is divided into four subgroups: the area around Chengdu, south Sichuan, northeast Sichuan, and west Chongqing where the spillover effect of CO2 is greatest; and (4) the higher density of the global network of CO2 emission considerably reduces regional emission intensity and narrows the differences among regions. Individual networks with higher centrality are also found to have lower emission intensity.
松花江流域哈尔滨段景观生态风险评价
[J].
Landscape ecological risk assessment of Harbin section of Songhua River basin
[J].
Land use transitions and the associated impacts on ecosystem services in the middle reaches of the Yangtze River Economic Belt in China based on the geo-informatic Tupu method
[J].DOI:10.1016/j.scitotenv.2019.134690 URL [本文引用: 1]
A regional multiple stressor risk assessment of the Codorus Creek watershed the relative risk model
[J].DOI:10.1080/20028091056980 URL [本文引用: 1]
基于相对风险模型的土地利用变化生态风险定量评价——以石羊河流域为例
[J].
DOI:10.7522/j.issn.1000-694X.2015.00163
[本文引用: 1]
土地利用是否合理是推进国民经济发展的关键,也是生态环境变化的风向标。通过理论研究和实地调研,构建了土地利用生态风险定量评价体系,借助相对风险模型(RRM)对石羊河流域的生态风险及其影响因素进行研究。结果表明:(1)在划分的3个评价单元中,中部绿洲生态保护区在土地利用中面临的生态风险最大,北部盆地防沙治沙区次之,南部山地水源涵养区生态风险最小;(2)在3大风险单元的6类不同风险源中,工程建设对石羊河流域的生态风险影响最大,其次是作物种植和畜牧养殖,且在自然环境相对较好的区域表现得尤为明显。
Evaluation of ecological risk of land use change based on the RRM model:A case in the Shiyanghe River basin
[J].
DOI:10.7522/j.issn.1000-694X.2015.00163
[本文引用: 1]
The rationality of land use is a key to promote the development of the national economy,and is also the signpost of ecological environmental change. Through theoretical study and field research, this paper constructs a quantitative evaluation system for ecological risk of land use, using the RRM to study the ecological risk and its influencing factors in Shiyanghe River Basin. The results showed that, (1) Among three dividing evaluation units, the middle oasis ecological protection faces the largest risk in the land use, followed by the northern basin desertification region and the southern mountain water conservation district is minimum. (2) Among six different risk sources in three risk units, the engineering construction has the greatest impact on the ecological risk in the Shiyanghe River Basin, followed by the crop cultivation and animal husbandry, and it is particularly obvious in relatively good natural environment area.
Assessment and management of urbanization-induced ecological risks
[J].DOI:10.1080/13504509.2018.1446193 URL [本文引用: 1]
基于土地利用变化的巢湖流域生态风险分析
[J].
Ecological risk of Chaohu Lake basin based on land use change
[J].
基于地理探测器模型的疏勒河流域景观生态风险评价及驱动因素分析
[J].
Landscape ecological risk assessment and driving factors of the Shule River basin based on the geographic detector model
[J].
Ecological risk assessment of Guangxi Xijiang River basin based on landscape pattern
[J].
近三十年长江下游升金湖不同季节湿地景观生态风险时空分析
[J].
Spatial-temporal analysis of landscape ecological risk in different seasons during the past 30 years in Lake Shengjin wetland,lower reaches of the Yangtze River
[J].
Assessment of ecological risks induced by land use and land cover changes in Xiamen City,China
[J].DOI:10.1080/13504509.2017.1415235 URL [本文引用: 1]
基于土地利用变化的河北省坝上地区景观生态风险评价
[J].
Landscape ecological risk assessment in Bashang area of Hebei Province based on land use change
[J].
基于景观格局的阿哈湖国家湿地公园景观生态风险评价
[J].
Assessment on ecological risk of Aha Lake National Wetland Park beased on landscape pattern
[J].
Spatiotemporal variations of land use and landscape ecological risk in a resource-based city,from rapid development to recession
[J].DOI:10.15244/pjoes/102778 URL [本文引用: 1]
Evolution of landscape ecological risk at the optimal scale:A case study of the Open Coastal Wetlands in Jiangsu,China
[J].
DOI:10.3390/ijerph15081691
URL
[本文引用: 1]
Detailed analysis of the evolution characteristics of landscape ecological risk is crucial for coastal sustainable management and for understanding the potential environmental impacts of a man-made landform landscapes (MMLL). As a typical open coastal wetland, large-scale human activities (e.g., tidal reclamation, fishery activities, wind farm construction, and port construction) have substantially affected the evolution of the coastal ecological environment. Previous landscape ecological risk assessment studies have documented the effectiveness of assessing the quality of ecological environment processes. However, these studies have either focused on the noncoastal zone, or they have not considered the evolution of the spatial characteristics and ecological risk evolution of the landscape at an optimal scale. Here, we present a landscape ecological risk pattern (LERP) evolution model, based on two successive steps: first, we constructed an optimal scale method with an appropriate extent and grain using multi–temporal Landsat TM/OLI images acquired in the years 2000, 2004, 2008, 2013 and 2017, and then we calculated landscape ecological risk indices. Based on this model, the entire process of the spatiotemporal evolution of ecological risk patterns of the open coastal wetlands in Jiangsu, China, was determined. The principal findings are as follows: (1) The main landscape types in the study area are tidal flats and farmland, and the main features of the landscape evolution are a significant increase in aquafarming and a substantial decrease in the tidal flat area, while the landscape heterogeneity increased; (2) In the past 20 years, the areas of low and relatively low ecological risk in the study region were greatly reduced, while the areas of medium, relatively high, and high ecological risk greatly increased; the areas of high-grade ecological risk areas are mainly around Dongtai and Dafeng; (3) The area of ecological risk from low-grade to high-grade occupied 71.75% of the study area during 2000–2017. During the previous periods (2000–2004 and 2004–2008), the areas of low-grade ecological risk were transformed to areas of middle-grade ecological risk area, while during the later periods (2008–2013 and 2013–2017) there was a substantial increase in the proportion of areas of high-grade ecological risk. Our results complement the official database of coastal landscape planning, and provide important information for assessing the potential effects of MMLL processes on coastal environments.
Contamination and ecological risk assessment of trace elements in sediments of the rivers of Sundarban mangrove forest,Bangladesh
[J].DOI:10.1016/0025-326X(76)90274-5 URL [本文引用: 1]
Zonin of Hangzhou Bay ecological red line using GIS-based multi-criteria decision analysis
[J].DOI:10.1016/j.ocecoaman.2017.01.013 URL [本文引用: 1]
黄河流域土地利用转型图谱特征
[J].
Graphic characteristics of land use transition in the Yellow River basin
[J].
Accuracy assessment of zenith tropospheric delay calculated from ERA5 data over China
[J].
气候变化和人类活动对黄河上游十大孔兑水沙过程的影响
[J].
Impacts of climate change and human activities on water discharge and sediment load of ten tributaries (the ten kongduis) of the upper Yellow River
[J].
基于土地利用变化的黄河流域景观格局及生态风险评估
[J].
Landscape pattern identification and ecological risk assessment using land-use change in the Yellow River basin
[J].
