Analysis of landscape ecology risk of the Yellow River basin in Inner Mongolia
HUA Yongchun1(), CHEN Jiahao1, SUN Xiaotian2, PEI Zhiyong2()
1. College of Forestry, Inner Mongolia Agricultural University, Hohhot 010019, China 2. College of Energy and Transportation Engineering, Inner Mongolia Agricultural University, Hohhot 010018, China
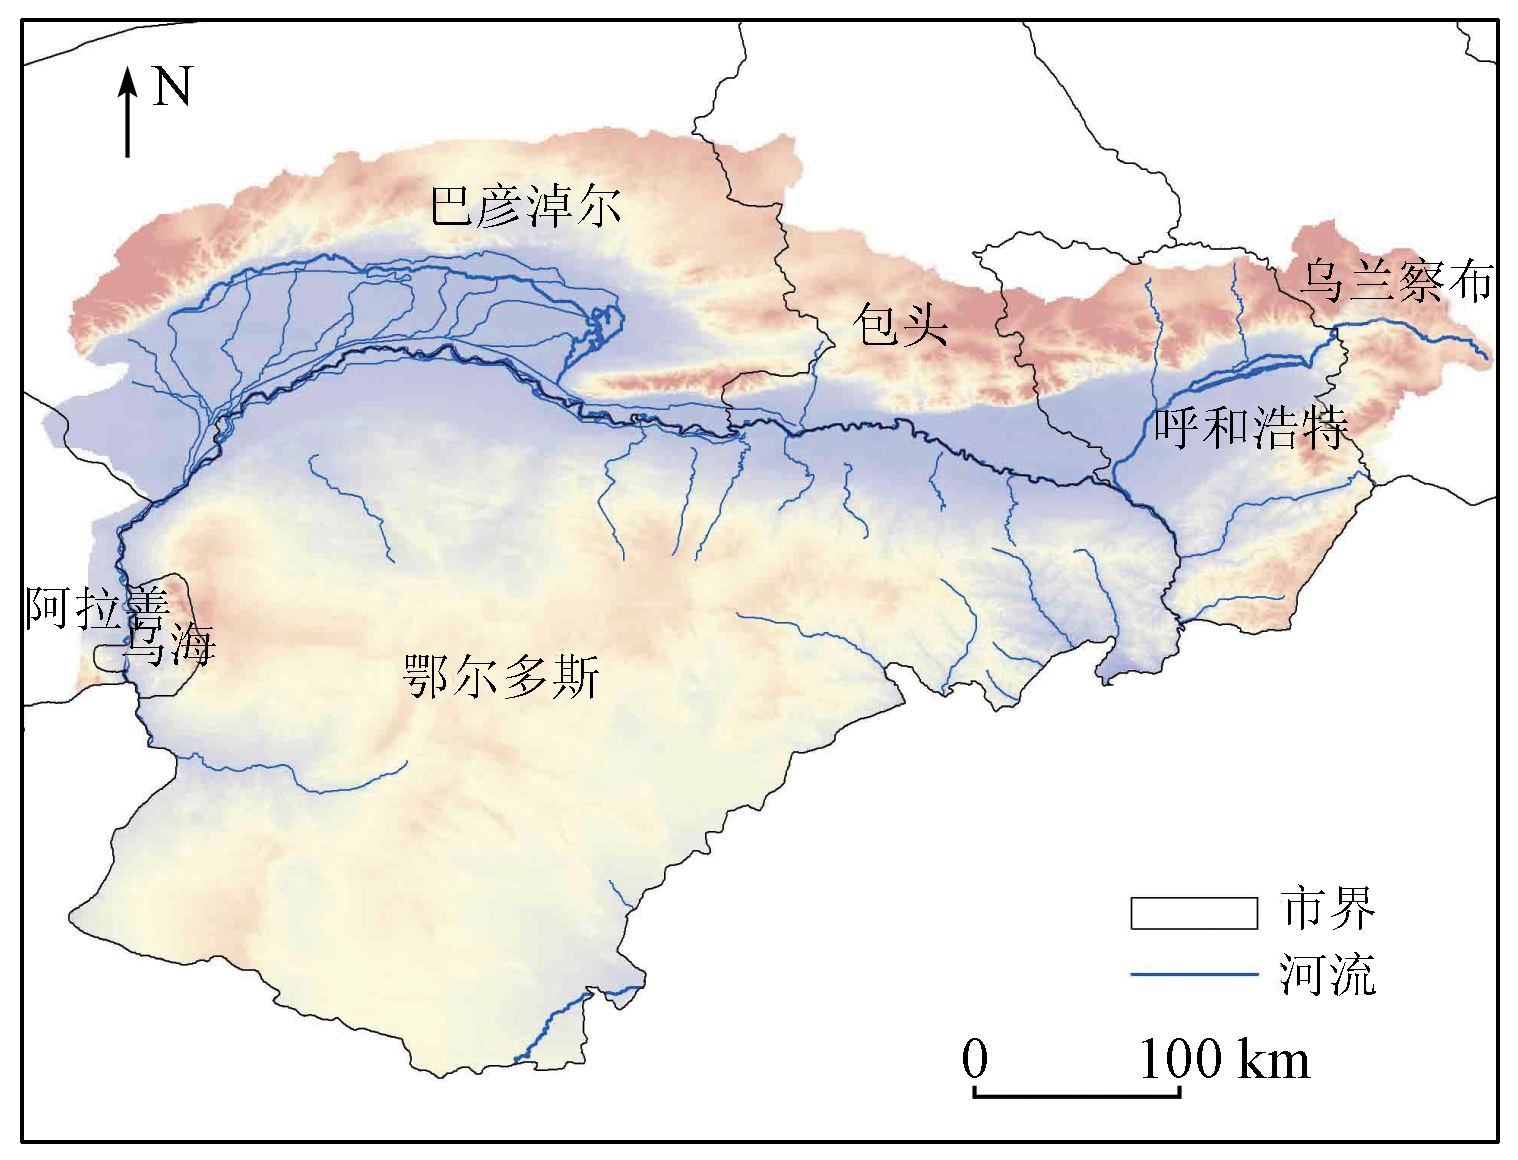
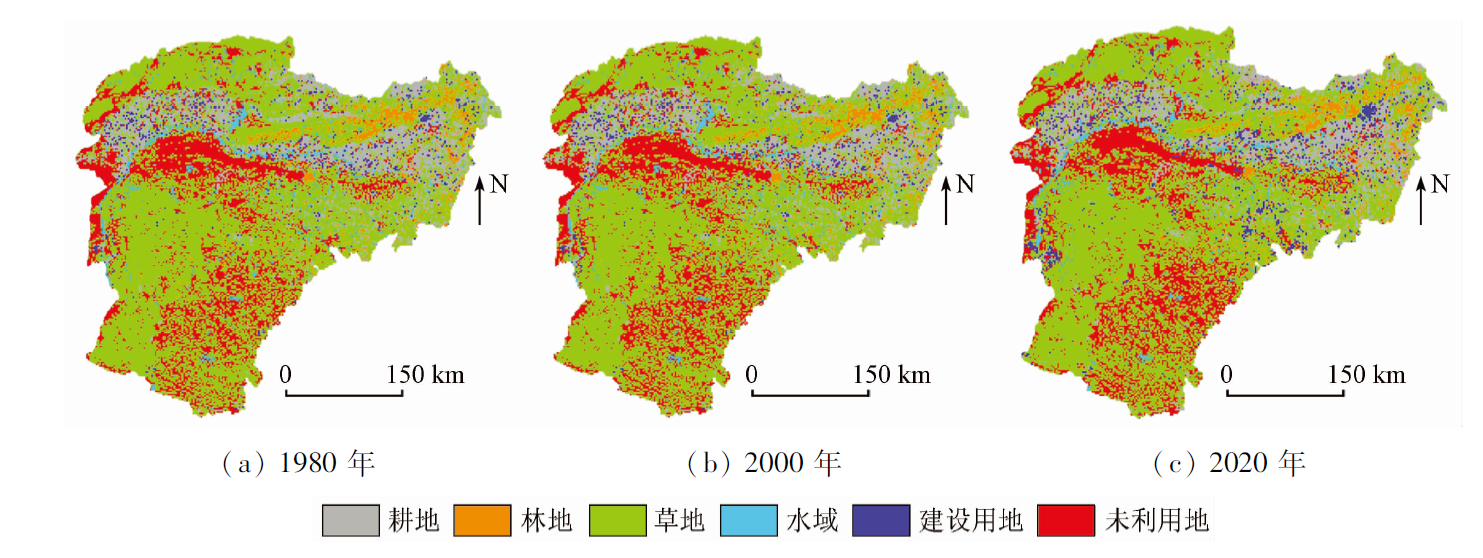
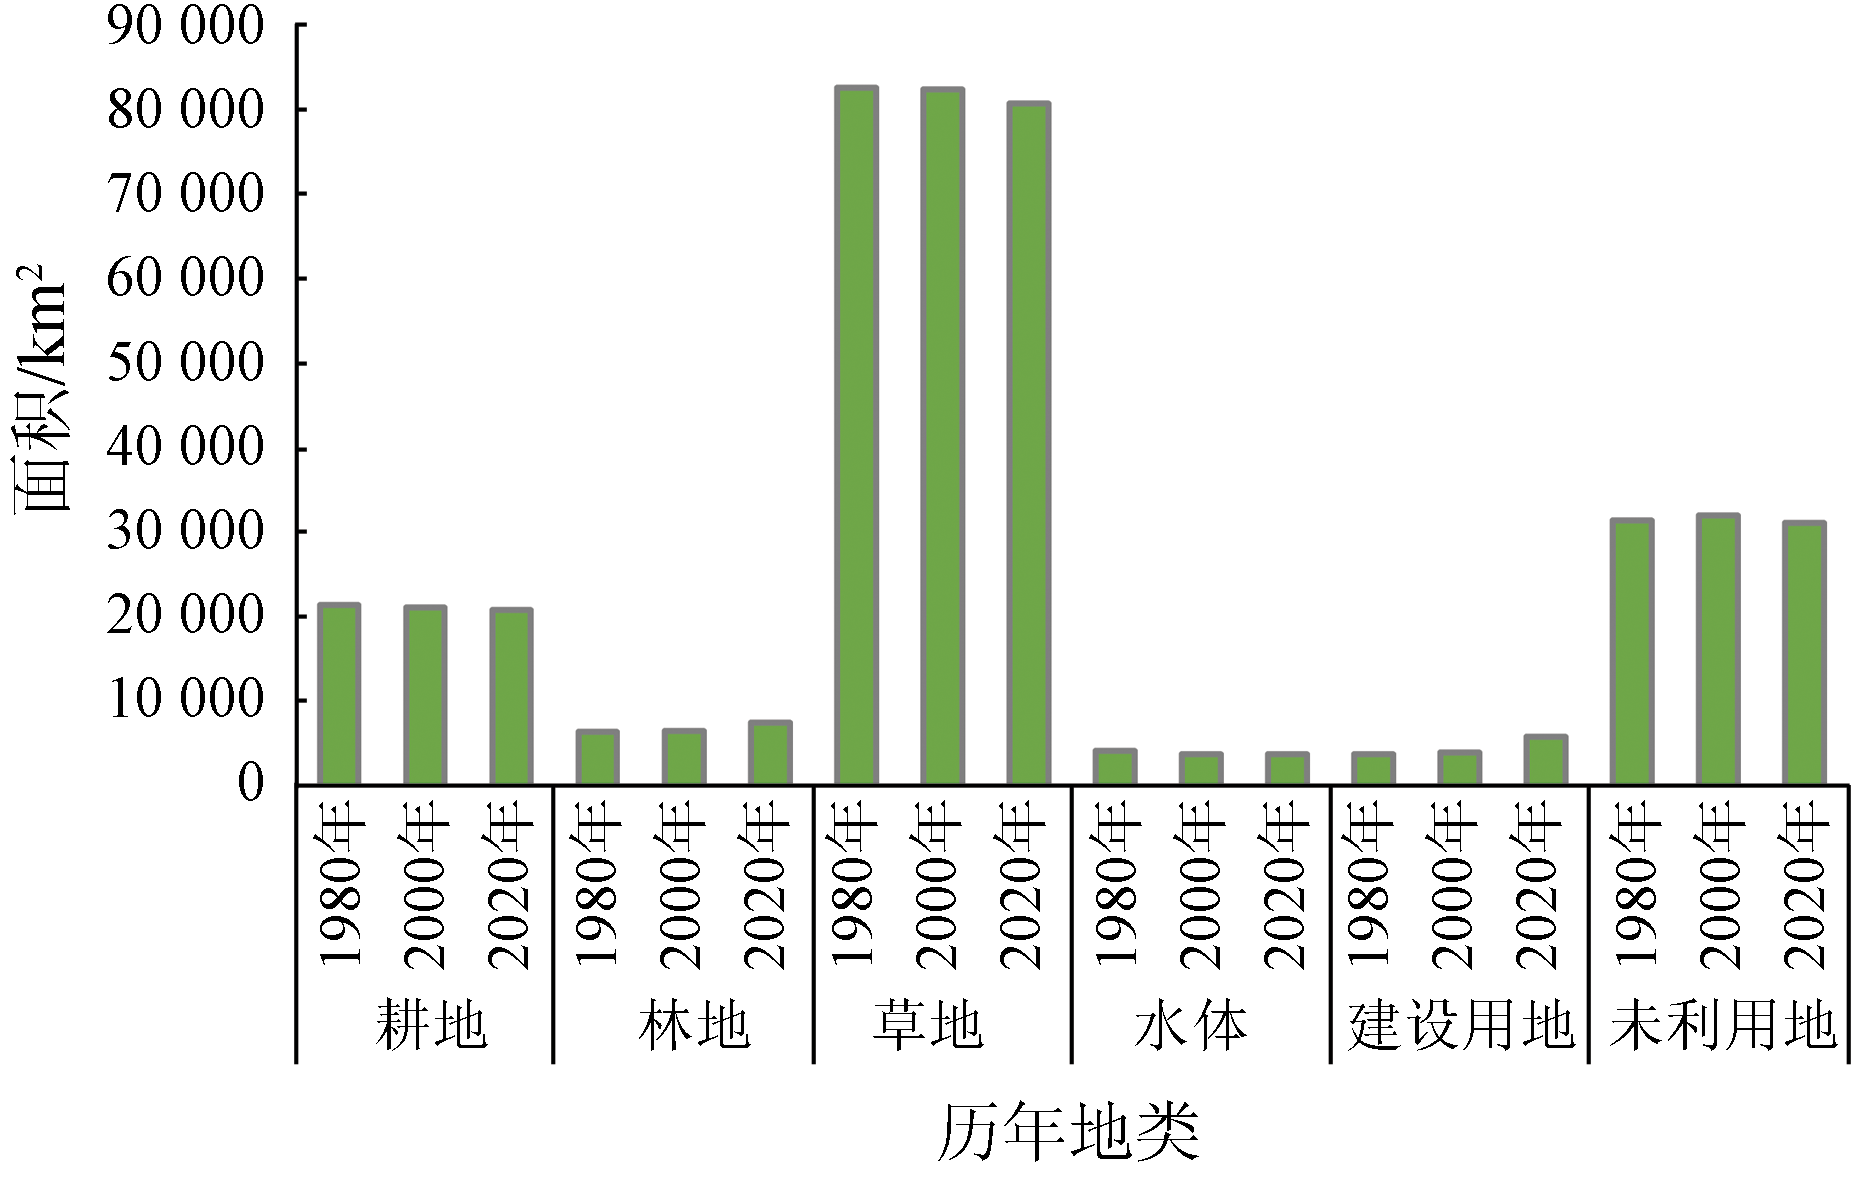
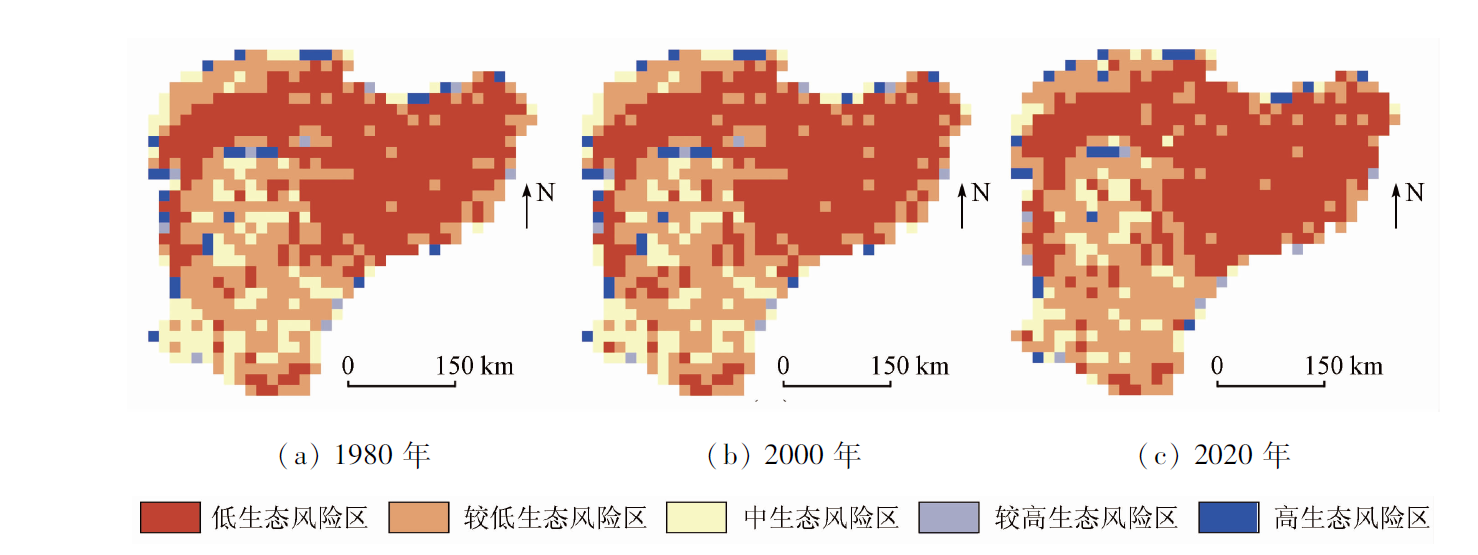
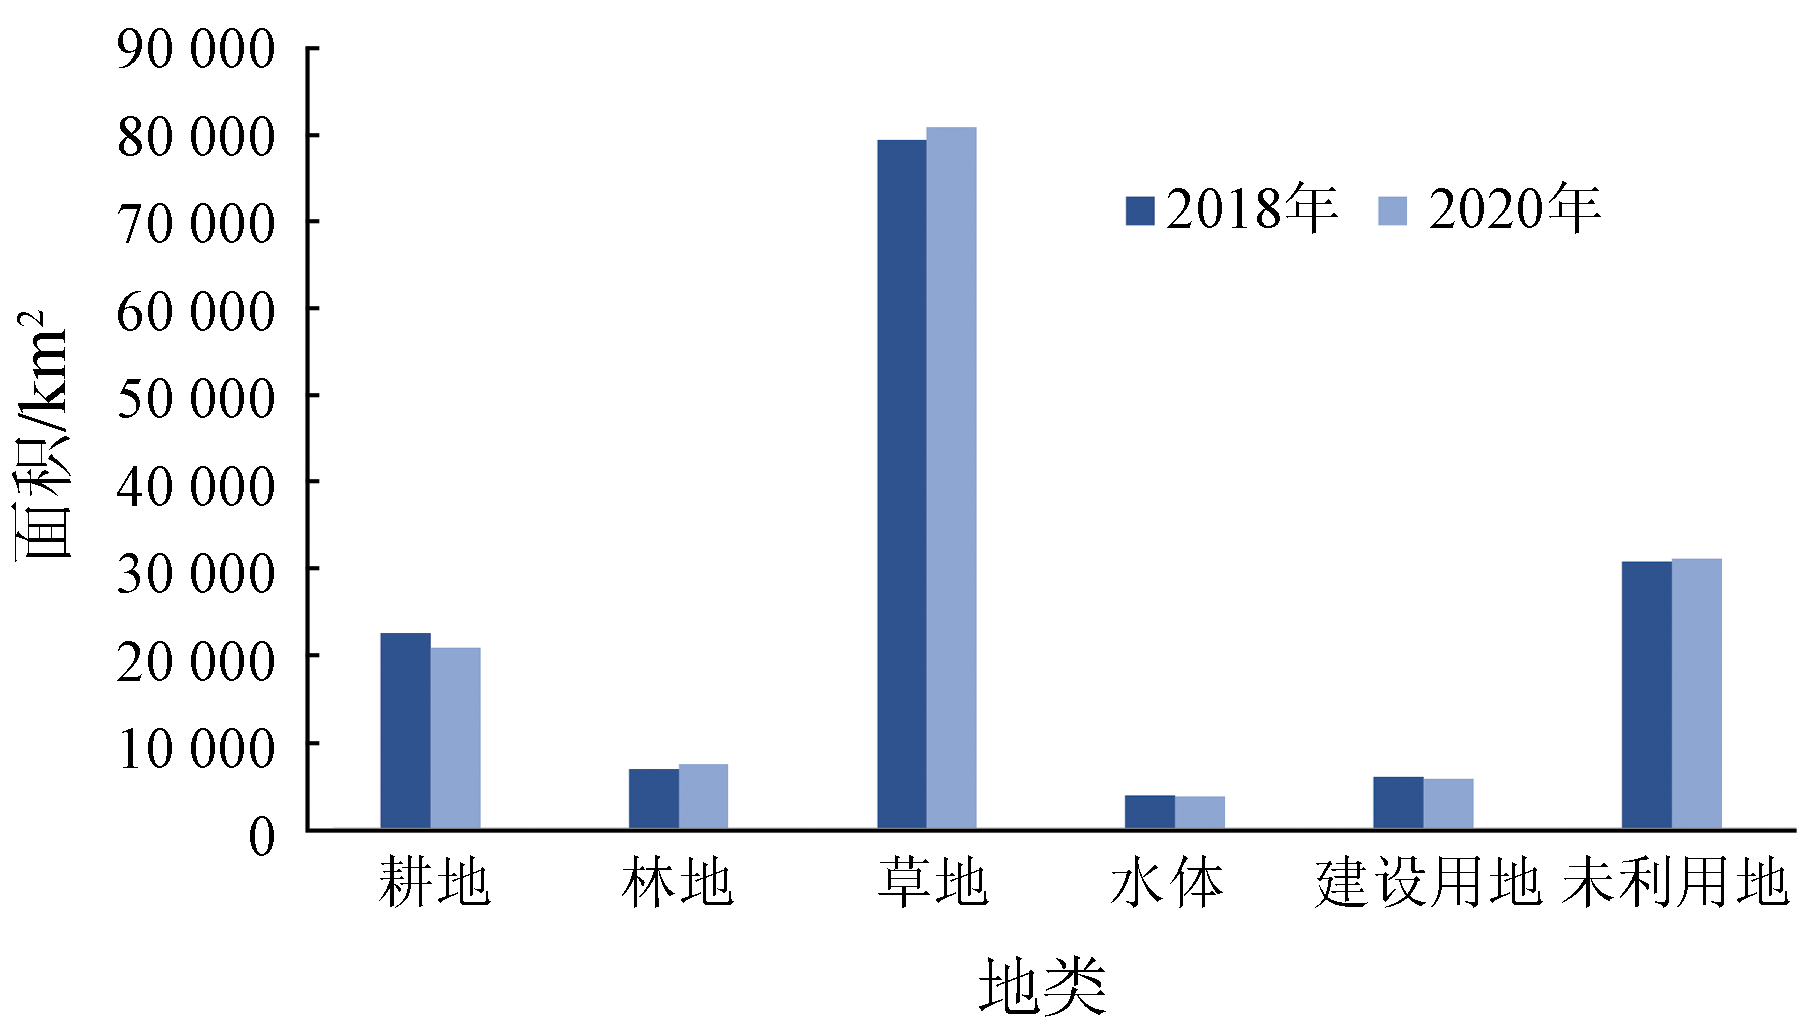
The Inner Mongolia reach of the Yellow River basin is suffering severe degradation as an ecological barrier at present. Analyzing its landscape pattern and ecological risk is of great significance for promoting the high-quality development of this reach. Based on the land use data of 1980, 2000, and 2020 of the study area, this study analyzed the spatial distribution and spatio-temporal evolution of the ecological risks by calculating the regional landscape pattern index and the ecological risk index. The results show that: ① During 1980—2020, the land in the study area was dominated by grassland, which accounted for more than 50%. In this period, the areas of cultivated land, grassland, water areas, and unused land decreased by 578 km2, 1 911 km2, 383 km2, and 255 km2, respectively. By contrast, the areas of forest land and construction land increased by 1 055 km2 and 2 072 km2, respectively. In terms of land use types, the land in the study area mainly shifted from grassland, cultivated land, and water areas to construction land and forest land. The comprehensive land use intensity during 2000—2020 was 0.85 percentage points higher than that during 1980—2000; ② During 1980—2020, the patch number of all types of land decreased except for water areas and unused land; the degree of landscape fragmentation of all types of land increased except for construction land; the degree of landscape disturbance of all types of land decreased except for forest land; the degree of landscape loss of all types of land did not change significantly except for construction land, for which the degree of landscape loss decreased significantly; ③ The ecological risk value of the Inner Mongolia reach of the Yellow River basin showed a downward trend during 1980—2020. Areas with fairly low and low ecological risks increased by 9 000 km2 in total and were primarily concentrated in the northern and central areas in this period. In contrast, areas with high and fairly high ecological risks decreased by 1 350 km2 in total and were scattered on the eastern and northern edges.
Lu D D, Sun D Q. Development and management tasks of the Yellow River basin:A preliminary understanding and suggestion[J]. Acta Geographica Sinica, 2019, 74(12):2431-2436.
[2]
Schmidt P, Morrison T H. Watershed management in an urban setting:Process,scale and administration[J]. Land Use Policy, 2011, 29(1):45-52.
doi: 10.1016/j.landusepol.2011.05.003
[3]
Wei S M, Pan J H, Liu X. Landscape ecological safety assessment and landscape pattern optimization in arid inland river basin:Take Ganzhou District as an example[J]. Human and Ecological Risk Assessment, 2020, 26(3):782-806.
doi: 10.1080/10807039.2018.1536521
Wang J, Bai W Q, Tian G H. A review on ecological risk assessment of land use[J]. Journal of Natural Resources, 2020, 35(3):576-585.
doi: 10.31497/zrzyxb.20200306
[5]
Preuss T G, Hommen U, Alix A, et al. Mechanistic effect models for ecological risk assessment of chemicals(MEMRisk):A new SETAC-Europe Advisory Group[J]. Environmental Science and Pollution Research, 2009, 16(3):250-252.
doi: 10.1007/s11356-009-0124-6
[6]
Kanwarpreet S, Virender K. Hazard assessment of landslide disaster using information value method and analytical hierarchy process in highly tectonic Chamba region in bosom of Himalaya[J]. Journal of Mountain Science, 2018, 15(4):808-824.
doi: 10.1007/s11629-017-4634-2
[7]
Ayre K K, Landis W G. A Bayesian approach to landscape ecological risk assessment applied to the upper Grande Ronde watershed,Oregon[J]. Human and Ecological Risk Assessment, 2012, 18(5):946-970.
doi: 10.1080/10807039.2012.707925
[8]
Cui L, Zhao Y, Liu J. Landscape ecological risk assessment in Qinling Mountain[J]. Geological Journal, 2018, 53:342-351.
doi: 10.1002/gj.v53.S1
Huang M Y, He X. Landscape ecological risk assessment and its mechanism in Chaohu basin during the past almost 20 years[J]. Journal of Lake Sciences, 2016, 28(4):785-793.
doi: 10.18307/2016.0411
[10]
Andrea D M, Simone C, Maurizio M, et al. Urban-rural ecological networks for landscape planning[J]. Land Use Policy, 2016, 50:312-327.
doi: 10.1016/j.landusepol.2015.10.004
[11]
Xie H, Wang P, Huang H. Ecological risk assessment of land use change in the Poyang Lake Ecoeconomic Zone,China[J]. International Journal of Environmental Research and Public Health, 2013, 10(1):328-346.
doi: 10.3390/ijerph10010328
[12]
Paukert C P, Pitts K L, Whittier J B, et al. Development and assessment of a landscape-scale ecological threat index for the Lower Colorado River basin[J]. Ecological Indicators, 2011, 11(2):304-310.
doi: 10.1016/j.ecolind.2010.05.008
[13]
Tian P, Li J L, Gong H B, et al. Research on land use changes and ecological risk assessment in Yongjiang River basin in Zhejiang Province,China[J]. Sustainability, 2019, 11(10):1-20.
doi: 10.3390/su11010001
Zhang Y J, Qu J G, Ye M M. Landscape ecological risk assessment of Harbin section of Songhua River basin[J]. Journal of Fuzhou University(Natural Science Edition), 2020, 48(3):361-367.
[15]
Chen W X, Zhao H B, Li J F, et al. Land use transitions and the associated impacts on ecosystem services in the middle reaches of the Yangtze River Economic Belt in China based on the geo-informatic Tupu method[J]. Science of the Total Environment, 2020, 701:134690.
doi: 10.1016/j.scitotenv.2019.134690
[16]
Obery A M, Landis W G. A regional multiple stressor risk assessment of the Codorus Creek watershed the relative risk model[J]. Human and Ecological Risk Assessment, 2002, 8(2):405-428.
doi: 10.1080/20028091056980
Qiao H Q, Cheng W S, Qiao W D, et al. Evaluation of ecological risk of land use change based on the RRM model:A case in the Shiyanghe River basin[J]. Journal of Desert Research, 2017, 37(1):198-204.
doi: 10.7522/j.issn.1000-694X.2015.00163
[18]
Tang L, Ma W. Assessment and management of urbanization-induced ecological risks[J]. International Journal of Sustainable Development and World Ecology, 2018, 25(5):383-386.
doi: 10.1080/13504509.2018.1446193
Peng J, Ling M, Gong C K, et al. Ecological risk of Chaohu Lake basin based on land use change[J]. Journal of Luoyang Institute of Science and Technology (Natural Science Edition), 2022, 32(1):4-12.
Sun L R, Zhou D M, Cen G Z, et al. Landscape ecological risk assessment and driving factors of the Shule River basin based on the geographic detector model[J]. Arid Land Geography, 2021, 44(5):1384-1395.
[21]
Yan Y, Shi S N, Hu B Q, et al. Ecological risk assessment of Guangxi Xijiang River basin based on landscape pattern[J]. Ekoloji, 2018, 27(105):5-16.
Zhu X F, Lu Y T, Wu P H, et al. Spatial-temporal analysis of landscape ecological risk in different seasons during the past 30 years in Lake Shengjin wetland,lower reaches of the Yangtze River[J]. Journal of Lake Science, 2020, 32(3):813-825.
[23]
Hua L Z, Liao J F, Chen H X, et al. Assessment of ecological risks induced by land use and land cover changes in Xiamen City,China[J]. International Journal of Sustainable Development and World Ecology, 2018, 25(5):439-447.
doi: 10.1080/13504509.2017.1415235
Liu M Z, Wang Y F, Pei H W. Landscape ecological risk assessment in Bashang area of Hebei Province based on land use change[J]. Bulletin of Soil and Water Conservation, 2020, 40(4):303-311,345.
Lou N, Wang Z J, He S T. Assessment on ecological risk of Aha Lake National Wetland Park beased on landscape pattern[J]. Research of Soil and Water Conservation, 2020, 27(1):233-239.
[26]
Zhou S Y, Chang J, Hu T H, et al. Spatiotemporal variations of land use and landscape ecological risk in a resource-based city,from rapid development to recession[J]. Polish Journal of Environmental Studies, 2020, 29(1):475-490.
doi: 10.15244/pjoes/102778
[27]
Liu Y C, Liu Y X, Li J L, et al. Evolution of landscape ecological risk at the optimal scale:A case study of the Open Coastal Wetlands in Jiangsu,China[J]. International Journal of Environmental Research and Public Health, 2018, 15(8):1691.
doi: 10.3390/ijerph15081691
[28]
Islam M A. Contamination and ecological risk assessment of trace elements in sediments of the rivers of Sundarban mangrove forest,Bangladesh[J]. Marine Pollution Bulletin, 2017, 7(59):1-11.
doi: 10.1016/0025-326X(76)90274-5
[29]
Wang C, Delu P. Zonin of Hangzhou Bay ecological red line using GIS-based multi-criteria decision analysis[J]. Ocean and Coastal Management, 2017, 139:42-50.
doi: 10.1016/j.ocecoaman.2017.01.013
Zhang W H, Lyu X, Shi Y Y, et al. Graphic characteristics of land use transition in the Yellow River basin[J]. China Land Science, 2020, 34(8):80-88.
[31]
Xu K, Deng X S, Xing C B. Accuracy assessment of zenith tropospheric delay calculated from ERA5 data over China[J]. Engineering of Surveying and Mapping, 2020, 9(6):27-33.
Yao H F, Shi C X, Gu Z K. Impacts of climate change and human activities on water discharge and sediment load of ten tributaries (the ten kongduis) of the upper Yellow River[J]. Arid Land Geo-graphy, 2018(3):472-479.
Liu X Z, Li X S, Jiang D M. Landscape pattern identification and ecological risk assessment using land-use change in the Yellow River basin[J]. Transactions of the Chinese Society of Agricultural Engineering, 2021, 37(4):265-274.
 2023, Vol. 35
  ), 陈家豪1, 孙小添2, 裴志永2(