

0 引言
借鉴国内生产总值(gross domestic product,GDP)概念,欧阳志云等[5]提出了可评价与分析生态系统对人类经济社会发展支撑作用,以及对人类福祉贡献的评估核算指标——生态系统生产总值(gross ecosystem product,GEP),即生态系统为人类提供的产品与服务价值的总和。自此,我国学者从全国[6]、省域[7]、市域[8]、县域[9]等不同尺度围绕GEP核算开展了系列研究。伴随着3S技术的发展,近年来基于行政区划面板数据的地级市间[10]、区县间[11]、乡镇甚至行政村间[9]GEP差异分析已成为常态,但此类研究仍存在难以揭示面板单元内部GEP空间差异的缺陷。对此,有学者通过单位面积价值空间化方法探讨分析了GEP空间变化特征[12-13],亦有少数学者尝试以参与计算的栅格数据分辨率为基准,在500 m×500 m格网尺度评估了青海省域长时序单一调节服务价值量的空间分布[14]、在90 m×90 m格网尺度评估了2017年与2020年长三角地区GEP及各单项生态系统功能价值量的空间分布[15]、在30 m×30 m格网尺度分别评估了单一年份浙江省域[16]和长株潭城市群[17]的调节服务及各单项生态系统功能价值量的空间分布、在2 m×2 m格网尺度评估了单一年份北京市延庆区GEP、物质产品、调节服务与文化服务功能价值量的空间分布[18],初步揭示了GEP的空间异质性。然而,受限于数据可获取性等原因,对于同时进行省域、长时序、高空间分辨率GEP及各单项生态系统功能价值量时空演化特征的综合研究鲜见报道。
针对上述问题,本研究以湖南省为例,在综合考虑湖南省生态环境特点及先验研究基础上,优化提出了一套湖南省本土化GEP核算指标体系,集成构建了顾及数据可获取性的高空间分辨率GEP格网化评估模型,在30 m×30 m格网尺度分析了湖南省2000—2020年GEP长时序空间变化规律及单项生态系统功能价值量贡献,以期为湖南省生态环境保护提供科学决策依据。
1 研究区概况
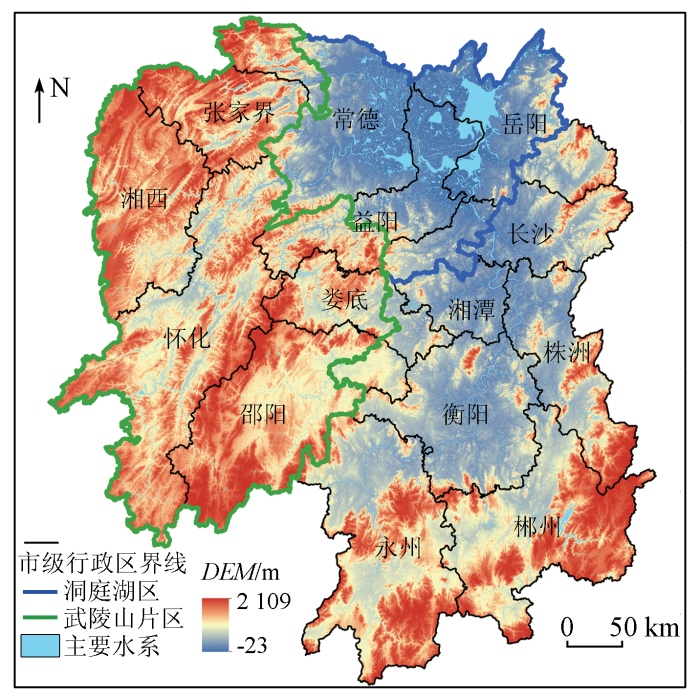
湖南省地理位置为: E108°47'~114°13',N24°39'~30°08',位于我国中部、长江中下游南部(图1),总面积约为21.18万km2。全省东、西、南三面环山,总体地势西高东低、南高北低,呈向东偏北开口的不对称“马蹄”形。省内西部武陵山片区是全国区域发展与扶贫攻坚示范区,北部洞庭湖生态修复工程入围国家第三批山水林田湖草生态保护修复工程试点,二者形成长江流域重要生态安全保护屏障。伴随着新型城镇化建设中对自然资源的开发利用,湖南省土地利用格局发生显著变化[19],引发了植被净初级生产量减少[20]和生态系统服务供需空间分布不均衡[21]等问题,严重制约了经济高质量可持续发展。因此,开展湖南省自然资源GEP核算评估与分析,对省内生态环境保护、可持续发展以及长江流域生态环境协调发展具有重大现实意义。
图1
2 GEP核算
2.1 GEP核算指标选取
综合考虑现有生态系统服务价值[2,4]及GEP[5]核算指标,参考生态环境部2020年发布的《陆地生态系统生产总值(GEP)核算技术指南》框架[22],本研究在湖南省GEP核算中,一方面沿用了食物及原材料生产、有机物质生产、水资源供给、土壤保持、维持生物多样性等大部分通用评估指标。另一方面,因生态系统文化服务功能源于生态系统组分和过程的文学艺术灵感、知识、教育和景观美学等[5],而现有文化服务价值核算指标多以景观旅游价值为主、对知识教育价值核算较少,未完全体现生态系统文化服务价值量,且湖南省洞庭湖、湘西地区等生态环境问题近年来已再次引发学术界广泛关注,本研究对此在文化服务功能价值量核算中,在沿用原休闲旅游指标基础上引入了体现知识教育价值的文教科研指标。同时,考虑到湖南省PM2.5污染不容忽视的历史实际[23],且研究表明PM2.5对人体健康和大气环境具有严重负面影响、甚至致人过早死亡[24],而森林植被可以有效降低空气中的PM2.5浓度[25],因此本研究亦将“降低PM2.5暴露水平”这一指标补充纳入了气体调节功能二级指标。
2.2 GEP格网化评估建模
为反映GEP评估结果空间异质性,本研究以30 m×30 m格网为基本单元构建了GEP格网化评估模型,即
式中:
表1 湖南省自然资源资产GEP核算方法
Tab.1
| 生态产品与 服务类型 | 二级指标 | 指标描述及计算方法 |
|---|---|---|
| 物质产品 | 食物及原材料生产 | 生产农副产品、提供工业原料,计算方法参考文献[5] |
| 有机物质生产 | 将无机物转化为有机物,计算方法参考文献[26] | |
| 水资源供给 | 地表产流、土壤含水量、冠层截留量等,计算方法参考文献[27] | |
| 调节服务 | 气体调节 | 由固碳释氧价值[5]、净化空气价值[28]、森林生态系统降低PM2.5暴露水平价值和温室气体排放的负效应价值[29-30]叠加获得,计算方法详见表后文说明 |
| 气候调节 | 增加湿度、降低大气温度,计算方法参考文献[29,31] | |
| 水文调节 | 涵养水源、调洪蓄水,计算方法参考文献[32] | |
| 土壤保持 | 保持土壤肥力、减少土地废弃、减轻泥沙淤积,计算方法参考文献[5,33] | |
| 维持生物多样性 | 提供栖息地,计算方法参考文献[4] | |
| 文化服务 | 休闲旅游 | 旅游消费支出、旅游时间成本,计算方法参考文献[34] |
| 文教科研 | 生态主题科研论文产出,计算方法参考文献[35] |
注: 各年份的GEP采用湖南省居民消费价格指数(consumer price index,CPI)修正到2019年可比价格[
气体调节价值的计算公式为:
式中:
式中:
式中:
式中:
2.3 GEP评估数据收集与处理
2.3.1 土地利用数据
图2

图2
2000—2020年湖南省生态系统类型
Fig.2
Ecosystem types from 2000 to 2020 in Hunan Province
2.3.2 植被数据
植被数据包含归一化植被指数(normalized difference vegetation index,NDVI)、植被净初级生产力(net primary productivity,NPP)和蒸散发(evapotranspiration,ET)数据。NDVI数据来源于NASA提供的Terra卫星影像MOD13A3产品,空间分辨率为1 km。2000年和2010年NPP数据选自MODIS/ MOD17A3数据集,空间分辨率为500 m,2020年NPP数据选自MODIS/MOD17A2数据集,时间分辨率为8 d。2000年和2010年ET数据选自MODIS/MOD16A3数据集,空间分辨率为1 km,2020年ET数据选自MODIS/MOD16A2数据集,空间分辨率为500 m,时间分辨率为8 d。
2.3.3 其他专题数据
其他专题数据主要包括研究区降水数据、地表PM2.5浓度数据、土壤数据、地形数据、人口数据和社会经济数据。降水数据下载自中国气象数据网(http://data.cma.cn/),空间分辨率为0.5°。地表PM2.5浓度数据来源于(http://fizz.phys.dal.ca/~atmos/ martin/),空间分辨率为1 km。土壤氮、磷、钾、有机质含量数据来源于中国土壤有机质数据集(http://poles.tpdc.ac.cn/zh-hans/),空间分辨率为1 km。土壤砂粒、黏粒、粉粒数据来源于世界土壤(hanmonized world soil database,HWSD)数据集,空间分辨率为1 km。数字高程模型(digital elevation model,DEM)来源于美国宇航局(http://srtm.csi.cgiar.org/srtmdata/) SRTM3 DEM数据,空间分辨率为90 m。人口数据来源于WorldPop官方网站(https://www.worldpop.org/),空间分辨率为1 km。农林牧渔产量及产值、旅游人数和旅游收入等数据来自《湖南省统计年鉴》; 大中小型水库蓄水量来自《湖南省水资源公报》。
本研究所有栅格数据均采用Krasovsky_1940_Albers投影坐标系,地理坐标系为GCSKrasovsky _1940_Albers,基准面为D_Krasovsky_1940。鉴于土地利用数据为GEP核算的关键,因此本研究以土地利用数据的空间分辨率为准,其他栅格数据利用双线性插值法重采样至30 m×30 m参与计算。
3 结果与分析
3.1 湖南省GEP时间维度分析
2000—2020年湖南省GEP变化情况如表2所示,从表2中可以看出,湖南省2000—2020年GEP整体增长3.34×10⁵亿元,增幅约40.28%,3期GEP呈现先减后增的变化趋势。其中,2000—2010年湖南省GEP减少1.82×10⁴亿元,降幅约2.20%; 2010—2020年湖南省GEP增长3.52×10⁵亿元,增幅约43.44%。与湖南省已有GEP核算研究报道对比,本研究发现的2000—2010年湖南省GEP小幅下降的时间变化趋势与刘永强等[38]、熊鹰等[39]的研究结果一致(尚未有2020年湖南省GEP相关研究报道),与此同时,因对核算指标体系和计算方法的优化,本研究2000年和2010年核算的湖南省GEP结果分别为8.28×10⁵亿元和8.09×10⁵亿元,整体高于刘永强等[38]核算的8.83×10³亿元和8.77×10³亿元和熊鹰等[39]核算的1.758×10⁴亿元和1.755×10⁴亿元。
表2 2000—2020年湖南省GEP变化
Tab.2
| 年份 | 指标 | 农田 | 森林 | 草地 | 湿地 | 城市 | 合计 |
|---|---|---|---|---|---|---|---|
| 2000年 | GEP/亿元 | 2.05×10⁵ | 5.52×10⁵ | 6.19×10⁴ | 9.41×10³ | 2.93 | 8.28×10⁵ |
| 贡献度/% | 24.75 | 66.64 | 7.47 | 1.14 | 0.00 | 100.00 | |
| 2010年 | GEP/亿元 | 2.09×10⁵ | 5.34×10⁵ | 5.78×10⁴ | 8.61×10³ | 23 | 8.09×10⁵ |
| 贡献度/% | 25.82 | 65.97 | 7.14 | 1.06 | 0.00 | 100.00 | |
| 2020年 | GEP/亿元 | 2.53×10⁵ | 8.09×10⁵ | 9.06×10⁴ | 7.75×10³ | 276 | 11.62×10⁵ |
| 贡献度/% | 21.80 | 69.70 | 7.81 | 0.67 | 0.02 | 100.00 | |
| 2000—2010年 | 变化量/亿元 | 0.04×10⁵ | -0.18×10⁵ | -0.41×10⁴ | -800 | 20.07 | -1.82×10⁴ |
| 变化率/% | 1.95 | -3.26 | -6.62 | -8.50 | 684.98 | -2.20 | |
| 2010—2020年 | 变化量/亿元 | 0.44×10⁵ | 2.75×10⁵ | 3.28×10⁴ | -860 | 253 | 3.52×10⁵ |
| 变化率/% | 21.05 | 51.50 | 56.75 | -9.99 | 1 100 | 43.44 | |
| 2000—2020年 | 变化量/亿元 | 0.48×10⁵ | 2.57×10⁵ | 2.87×10⁴ | -1.66×10³ | 273.07 | 3.34×10⁵ |
| 变化率/% | 23.41 | 46.56 | 46.37 | -17.64 | 9 319.80 | 40.28 |
分析各类型生态系统对湖南省GEP贡献可知,2000年、2010年和2020年3期皆是森林生态系统贡献最大,其余依次是农田、草地、湿地、城市生态系统,这与湖南省各生态系统类型面积占比排序一致,可以看出各类型生态系统的面积对GEP的贡献度具有决定性影响。从各生态系统类型GEP的变化可以看出: 20 a来湖南省城市生态系统GEP变化幅度最大,增幅达9 319.80%,远高于其他生态系统类型GEP,与旅游业收入显著提升有关。
3.2 湖南省GEP空间维度分析
整体而言,湖南省2000年、2010年和2020年3期GEP(图3)均呈现出西高、中低的空间分布格局。森林生态系统因其植被覆盖率高,有利于提高土壤保持、气候调节等服务价值,同时高坡度地区人为活动较少、生态系统优越,因此,GEP高值区域集中分布于湖南省西部及东南角,即森林生态系统与DEM高值分布区域; 低值区主要分布在湖南省北部和中部,即农田、草地、湿地、城市生态系统所在区域。这一空间分布特征与熊鹰等[39]基于10 km×10 km格网尺度的研究结果大体一致,但相比于后者,本研究30 m×30 m格网尺度的GEP结果可明显呈现更多空间分布细节信息,如图3所示区域Ⅰ(洞庭湖)湿地生态系统GEP均较低,而后者在该区域的生态系统服务价值相对较高[39]; 区域Ⅱ(长株潭城市群)GEP低值区与城市生态系统范围较为吻合,而这一结果在后者研究中没有呈现。此外,结合图4可以看出,湖南省有机物质生产、气体调节、气候调节、土壤保持和维持生物多样性功能价值量的空间分布格局与GEP较相似,皆呈现出“西部和东南部高”、“中部和北部低”的空间分布格局。说明森林生态系统对GEP及单项功能价值量的空间分布格局具有重要作用。
图3
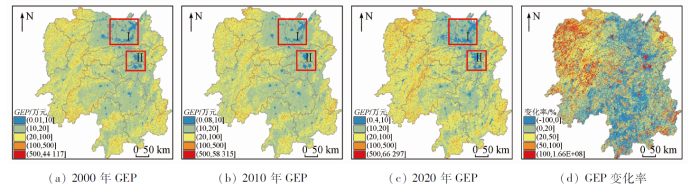
图3
2000—2020年湖南省GEP空间分布
Fig.3
Spatial distribution of GEP from 2000 to 2020 in Hunan Province
图4
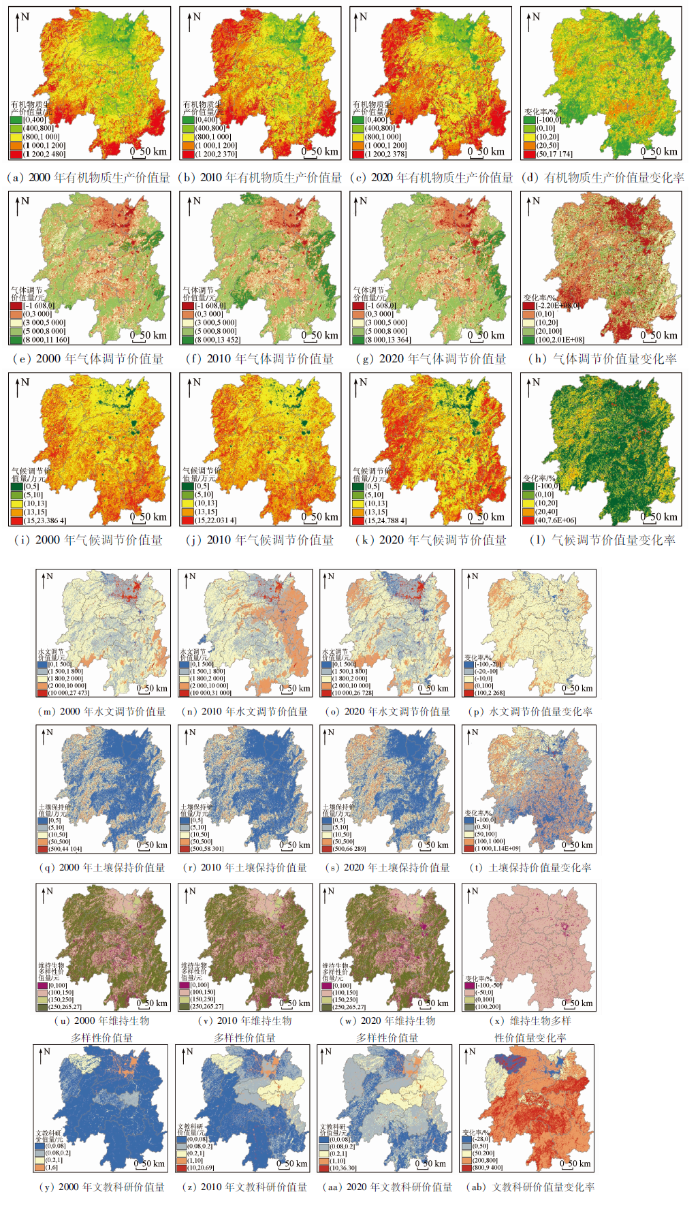
图4
2000—2020年湖南省各单项生态系统功能价值量空间分布
Fig.4
Spatial distribution of each ecosystem function value from 2000 to 2020 in Hunan Province
分析湖南省GEP时空演化特征(图3)可得,2020年湖南省西部武陵山片区GEP高值区范围明显扩大,且变化率显著较高。其中有机物质生产、气候调节、水文调节和土壤保持功能价值量(图4)的时空演化特征与GEP相似。其主要原因是,2000—2020年间湖南省西部生态系统类型变化以草地向森林转移为主,森林生态系统面积的增加,导致该区域GEP增长,说明湖南省2012年出台的《中共湖南省委湖南省人民政府关于抓住西部大开发机遇加快湘西自治州发展的若干意见》中“加强生态建设和环境保护,构筑生态安全屏障”目标建设取得了重大成效,湘西武陵山片区生态环境得到了有效改善。此外,湖南省北部地区因水域面积增加、中部地区因草地面积的增加导致GEP也略有提高,反映出湖南省退田还湖、退耕还林还草成效显著,整体生态环境有极大的改善。与此同时,湘西乃至湖南省全域生态环境问题愈发得到科研领域的重点关注。对比图4可以看出,2020年文教科研功能价值量在湘西、张家界略有上升,同时在其他区域呈明显增长趋势。
与武陵山片区GEP逐年显著增高相反,洞庭湖区的GEP及各单项生态系统功能价值量均呈现低增长态势。主要原因是: 前期洞庭湖区围垦规模较大造成水域面积下降,后期通过管控使得水域面积逐渐恢复、区域生态环境逐步得到改善[38]。然而洞庭湖区生态环境问题仍须进一步加强改善,需要政府及相关部门持续重点关注。
3.3 单项生态系统功能价值量贡献分析
从时间上看,湖南省各单项生态系统功能价值量对GEP的贡献度(单项生态系统功能价值量与湖南省GEP之比)(表3)随时间呈现出规律性变化。森林生态系统在土壤保持、气候调节和气体调节等服务类型中发挥较大作用,且湖南省森林生态系统面积占比在50%以上,因此该3项功能价值量对湖南省GEP的贡献度在2000—2020年间一直位居前三。文教科研功能价值量贡献度则一直居于末位。水文调节、水资源供给、有机物质生产以及维持生物多样性功能价值量的贡献度逐渐靠后。值得注意的是,随着人民物质生活水平的不断提高,休闲旅游人数剧增,湖南省因独特的张家界国家森林公园等自然景观、岳阳楼等文化遗产及声名大噪的茶饮、餐厅而成为最受欢迎的旅游胜地之一,因此休闲旅游功能价值量贡献度由2000年的倒数第二上升至2020年的第四位。同时,食物及原材料生产功能价值量的贡献度排序也逐渐靠前,这与近几年湖南省在不断深化农业结构性调整、优化种植结构与渔业养殖结构有关。
表3 2000—2020年湖南省各单项生态系统功能价值量分析
Tab.3
| 生态系统功能 | 2000年 | 2010年 | 2020年 | ||||||
|---|---|---|---|---|---|---|---|---|---|
| 价值量/亿元 | 贡献度/% | 排序 | 价值量/亿元 | 贡献度/% | 排序 | 价值量/亿元 | 贡献度/% | 排序 | |
| 食物及原材料生产 | 1 301.27 | 0.16 | 7 | 2 908.66 | 0.36 | 6 | 4 077.17 | 0.35 | 6 |
| 有机物质生产 | 2 168.73 | 0.26 | 6 | 2 304.76 | 0.28 | 7 | 2 326.59 | 0.20 | 8 |
| 水资源供给 | 3 406.31 | 0.41 | 5 | 4 079.14 | 0.50 | 5 | 4 013.57 | 0.35 | 7 |
| 气体调节 | 9 659.66 | 1.17 | 3 | 10 948.36 | 1.35 | 3 | 10 494.53 | 0.90 | 3 |
| 气候调节 | 309 937.93 | 37.41 | 2 | 309 081.20 | 38.15 | 2 | 302 826.77 | 26.06 | 2 |
| 水文调节 | 6 082.96 | 0.73 | 4 | 6 239.15 | 0.77 | 4 | 6 120.74 | 0.53 | 5 |
| 土壤保持 | 495 191.72 | 59.77 | 1 | 472 297.52 | 58.29 | 1 | 821 967.65 | 70.72 | 1 |
| 维持生物多样性 | 489.52 | 0.06 | 8 | 488.87 | 0.06 | 9 | 481.50 | 0.04 | 9 |
| 休闲旅游 | 260.08 | 0.03 | 9 | 1 909.03 | 0.24 | 8 | 9 903.22 | 0.85 | 4 |
| 文教科研 | 0.39 | 0.00 | 10 | 0.72 | 0.00 | 10 | 0.89 | 0.00 | 10 |
| 总计 | 828 498.57 | 100.00 | — | 810 257.42 | 100.00 | — | 1 162 212.63 | 100.00 | — |
就地域而言,武陵山片区GEP(表4)总体上除2000—2010年呈负增长外,在2010—2020年和2000—2020年均为正增长,变化率分别为62.83%和61.81%。土壤保持功能价值量对片区GEP变化量的贡献度最高,分别达227.17%,97.25%和95.94%,而维持生物多样性功能价值量最低。2000—2020年,武陵山片区GEP整体增长273 530.91亿元,占全省同期增长总量的81.97%; 其中,仅维持生物多样性功能价值量为负增长,其余单项皆为正增长。分时间段来看,2000—2010年,武陵山片区GEP减少2 756.77亿元,占全省同期减少总量的15.11%; 其中,仅土壤保持功能价值量呈现负增长,其余单项皆呈正增长趋势。2010—2020年,武陵山片区GEP整体增长276 287.68亿元,占全省同期增长总量的78.50%; 其中,气体调节与维持生物多样性功能价值量呈负增长趋势,其余单项为正增长。
表4 2000—2020年武陵山片区各单项生态系统功能价值量分析
Tab.4
| 生态系统功能 | 2000年/亿元 | 2010年/亿元 | 2020年/亿元 | 2000—2010年 | 2010—2020年 | 2000—2000年 | |||
|---|---|---|---|---|---|---|---|---|---|
| 变化量/ 亿元 | 贡献 度/% | 变化量/ 亿元 | 贡献 度/% | 变化量/ 亿元 | 贡献 度/% | ||||
| 食物及原材料生产 | 429.90 | 988.54 | 1 383.53 | 558.64 | -20.26 | 394.99 | 0.14 | 953.63 | 0.35 |
| 有机物质生产 | 945.45 | 1 022.32 | 1 036.08 | 76.88 | -2.79 | 13.76 | 0.00 | 90.64 | 0.03 |
| 水资源供给 | 1 251.65 | 1 394.24 | 1 661.71 | 142.59 | -5.17 | 267.47 | 0.10 | 410.06 | 0.15 |
| 气体调节 | 4 228.93 | 4 772.56 | 4 613.73 | 543.63 | -19.72 | -158.83 | -0.06 | 384.80 | 0.14 |
| 气候调节 | 129 111.18 | 129 932.62 | 130 481.39 | 821.44 | -29.80 | 548.77 | 0.20 | 1 370.21 | 0.50 |
| 水文调节 | 2 006.45 | 2 037.57 | 2 112.59 | 31.12 | -1.13 | 75.03 | 0.03 | 106.14 | 0.04 |
| 土壤保持 | 304 131.04 | 297 868.39 | 566 560.74 | -6 262.65 | 227.17 | 268 692.35 | 97.25 | 262 429.70 | 95.94 |
| 维持生物多样性 | 205.81 | 205.84 | 204.73 | 0.03 | 0.00 | -1.11 | 0.00 | -1.09 | 0.00 |
| 休闲旅游 | 104.99 | 770.75 | 3 998.37 | 665.76 | -24.15 | 3 227.62 | 1.17 | 3 893.38 | 1.42 |
| 文教科研 | 105.05 | 770.85 | 3 998.49 | 665.80 | -24.15 | 3 227.64 | 1.17 | 3 893.44 | 1.42 |
| 总计 | 442 520.46 | 439 763.69 | 716 051.37 | -2 756.77 | 100.00 | 276 287.68 | 100.00 | 273 530.91 | 100.00 |
与武陵山片区GEP增长率高相反,洞庭湖区的GEP变化率较低(表5),2000—2010年、2010—2020年和2000—2020年分别为2.58%,13.58%和16.50%。洞庭湖区GEP变化量贡献度最高与最低单项均与武陵山片区相同。2000—2020年,洞庭湖区GEP增长总量为18 258.90亿元,仅占全省同期增长总量的5.47%; 其中,气候调节、水文调节和维持生物多样性功能价值量为负增长,其余单项皆呈正增长趋势。分时间段来看,2000—2010年洞庭湖区GEP增长量为2 849.70亿元,仅占全省同期减少总量的-15.62%; 除水文调节和维持生物多样性功能价值量减少外,其余单项皆增加。2010—2020年,洞庭湖区GEP增长量为15 409.20亿元,仅占全省同期增长总量的4.38%; 其中食物及原材料生产、土壤保持、休闲旅游和文教科研功能价值量呈正增长趋势,而其余单项均有不同程度的下降。
表5 2000—2020年洞庭湖区各单项生态系统功能价值量分析
Tab.5
| 生态系统功能 | 2000年/亿元 | 2010年/亿元 | 2020年/亿元 | 2000—2010年 | 2010—2020年 | 2000—2000年 | |||
|---|---|---|---|---|---|---|---|---|---|
| 变化量/ 亿元 | 贡献 度/% | 变化量/ 亿元 | 贡献 度/% | 变化量/ 亿元 | 贡献 度/% | ||||
| 食物及原材料生产 | 493.84 | 1 072.18 | 1 496.74 | 578.34 | 20.29 | 424.56 | 2.76 | 1 002.90 | 5.49 |
| 有机物质生产 | 439.90 | 474.42 | 469.10 | 34.52 | 1.21 | -5.32 | -0.03 | 29.19 | 0.16 |
| 水资源供给 | 896.15 | 1 154.44 | 1 023.68 | 258.29 | 9.06 | -130.77 | -0.85 | 127.53 | 0.70 |
| 气体调节 | 1 713.09 | 1 996.10 | 1 864.92 | 283.01 | 9.93 | -131.18 | -0.85 | 151.83 | 0.83 |
| 气候调节 | 71 012.42 | 71 128.58 | 66 018.06 | 116.16 | 4.08 | -5 110.52 | -33.17 | -4 994.35 | -27.35 |
| 水文调节 | 2 352.26 | 2 320.66 | 2 233.64 | -31.60 | -1.11 | -87.02 | -0.56 | -118.62 | -0.65 |
| 土壤保持 | 33 507.33 | 34 283.73 | 50 688.85 | 776.40 | 27.24 | 16 405.12 | 106.46 | 17 181.52 | 94.10 |
| 维持生物多样性 | 114.76 | 114.42 | 111.59 | -0.34 | -0.01 | -2.83 | -0.02 | -3.17 | -0.02 |
| 休闲旅游 | 65.83 | 483.23 | 2 506.83 | 417.40 | 14.65 | 2 023.60 | 13.13 | 2 441.00 | 13.37 |
| 文教科研 | 66.12 | 483.62 | 2 507.19 | 417.50 | 14.65 | 2 023.56 | 13.13 | 2 441.06 | 13.37 |
| 总计 | 110 661.69 | 113 511.39 | 128 920.59 | 2 849.70 | 100.00 | 15 409.20 | 100.00 | 18 258.90 | 100.00 |
4 结论与讨论
本研究基于GEP领域已有研究成果并结合现阶段热点实际问题,对湖南省GEP核算评估指标体系进行了优化,并通过格网化评估模型的构建分析了湖南省GEP及各单项生态系统功能价值量的时空变化特征,为湖南省生态文明建设过程中的自然资源GEP核算评估与相关决策制定提供了参考。主要结论如下:
1)2000—2020年湖南省GEP上升3.34×10⁵亿元,增幅约40.28%。各生态系统类型对GEP贡献的排序为: 森林>农田>草地>湿地>城市生态系统。
2)湖南省GEP总体呈现出西部和东南部高、中部和北部低的空间分布格局,西部武陵山片区GEP增长率较高,北部洞庭湖区GEP及各单项生态系统功能价值量呈低增长态势,森林生态系统对GEP空间分布格局起决定性作用。基于30 m×30 m格网尺度的高空间分辨率GEP结果在湿地及城市生态系统明显呈现更多的空间分布细节信息。
3)各单项生态系统功能价值量对湖南省GEP的贡献度排序随时间呈现出规律性变化: 土壤保持、气候调节、气体调节功能价值量贡献度一直位居前三,文教科研功能价值量贡献度一直居于末位,水文调节、水资源供给、有机物质生产以及维持生物多样性功能价值量贡献度排序逐渐靠后; 休闲旅游、食物及原材料生产功能价值量的贡献度排序逐渐靠前。此外,土壤保持功能价值量的贡献对武陵山片区和洞庭湖区GEP变化占据主导作用。
本研究对湖南省GEP核算指标体系进行了优化,并获取了高空间分辨率的GEP及各单项生态系统服务功能价值量的空间分布结果,但仍需要从以下几个方面进行深入研究: 一方面因生态系统蕴含的价值十分广泛,本研究采用的货币化评估结果仍难以全面反映GEP,因此需要对指标体系进行进一步合理化调整,以增加研究结果的实用性。另一方面,本研究在进行GEP格网化评估时,采用与土地利用数据尺度相同的30 m×30 m格网为基本单元,但受其他数据可获取性限制,只能通过重采样和统计数据空间化的方式将不同数据统一到相同的格网单元,对GEP核算结果有一定程度的影响,因此接下来可通过研究格网单元尺度与GEP的空间效应来确定最佳格网尺度,从而对GEP实现空间分布精准核算。
参考文献
Ecosystems and human well-being:Synthesis
[J].
The value of the world’s ecosystem services and natural capital
[J].DOI:10.1038/387253a0 [本文引用: 2]
Improvements in ecosystem services from investments in natural capital
[J].
DOI:10.1126/science.aaf2295
PMID:27313045
[本文引用: 1]

In response to ecosystem degradation from rapid economic development, China began investing heavily in protecting and restoring natural capital starting in 2000. We report on China's first national ecosystem assessment (2000-2010), designed to quantify and help manage change in ecosystem services, including food production, carbon sequestration, soil retention, sandstorm prevention, water retention, flood mitigation, and provision of habitat for biodiversity. Overall, ecosystem services improved from 2000 to 2010, apart from habitat provision. China's national conservation policies contributed significantly to the increases in those ecosystem services. Copyright © 2016, American Association for the Advancement of Science.
中国生态系统服务的价值
[J].生态系统服务有着极高甚至无法计量的价值,与人类福祉关系及其密切。充分评价生态系统服务价值现已成为生态系统资产化管理、生态补偿、生态服务有偿使用等政策执行的迫切需求。本文基于扩展的劳动价值论原理,主要采用单位面积生态系统价值当量因子的方法,对中国生态系统提供的11种生态服务类型价值进行核算,研究表明:①中国各种生态系统年提供总服务价值量为38.10万亿元。就生态系统而言,森林提供的总服务价值最高,占总价值的46.00%;其次是水域和草地,分别占总价值的21.16%和19.68%;②就生态系统服务类别而言,调节功能服务价值最高,占71.31%,支持服务占19.01%,供给服务占5.87%;文化服务占3.81%;③生态系统服务价值在年内随生长季节变化,中国生态系统在5-9月期间提供的生态服务价值较高,而在11-2月期间提供的生态服务价值较低;④生态系统服务单位面积价值最高的地区主要分布在南方和东北地区,在总体趋势上从东南向西北逐渐降低;⑤对中国不同地区人均生态服务价值和人均GDP进行对比发现,2010年中国人均生态价值量为2.84万元,人均GDP为2.99万元,总体而言中国人均GDP和人均生态服务价值接近1∶1,这表明中国生态系统服务价值相对社会经济价值的高度稀缺性,尤其在经济和人口密集的区域,这种相对稀缺性更为突出。
The value of ecosystem services in China
[J].Ecosystem services with an extremely high economic value impact human well-being significantly. The practices of ecological system asset management,ecological compensation,and paid use of ecological system assets are urging to fully evaluate ecosystem service value. In this paper,the economic values of 11 types of ecosystem services are accounted based on the expansion of labor value theory and using the method of equivalent value factor per unit ecosystem area. We found that the total value of ecosystem services in China is 38.10×10¹² CNY,of which,forest ecosystem services value account for 46.00%,followed by aquatorium and grass ecosystem service value accounting for 21.16% and 19.68%,respectively. In terms of the economic value derived from different types of ecosystem services,support services accounted for 71.31%,regulation services accounted for 19.01%,provision services accounted for 5.87% and cultural services for 3.81%. The value of ecosystem services vary seasonally during a year,the value of ecosystem services during May to September is higher; from October to April the value of ecosystem services is relatively low. The ecosystems per unit area in southern and northeastern China supply higher ecosystem services values; the overall trend of the spatial distribution of ecosystem services value per unit of ecosystem area is gradual reduction from southeast to northwest. With comparison between per capita ecosystem service value and per capita GDP in different regions of China in 2010,the per capita ecosystem service value in China is 2.84×10⁴ CNY,close to per capita GDP,which fully demonstrates the relative scarcity of China's ecosystem service,especially in economically developed and densely populated areas.
生态系统生产总值核算:概念、核算方法与案例研究
[J].
Gross ecosystem product:Concept,accounting framework and case study
[J].DOI:10.5846/stxb URL [本文引用: 8]
Framework construction and application of China’s gross economic-ecological product accounting
[J].DOI:10.1016/j.jenvman.2019.109852 URL [本文引用: 2]
云南省生态资产与生态系统生产总值核算体系研究
[J].
Evaluating natural resource assets and gross ecosystem products using ecological accounting system:A case study in Yunnan Province
[J].
DOI:10.11849/zrzyxb.20160755
[本文引用: 2]
As one of the important ecological assets, ecosystems provide human with ecological products and services, which is the foundation of human survival and social-economic sustainable development. Gross ecosystem product (GEP) is the value of products and services provided by ecosystems, which is an important part of ecological asset. Taking Yunnan Province as a case study, we used an accounting system to analyze the connotation and relevance of ecological assets and GEP in 2010. The evaluation results showed that the condition of ecological asset was overall good in 2010. Forest, shrub and grassland were mainly of good quality level; farmland was mainly of poor quality, while biodiversity had excellent quality level. Total worth of GEP was 2 986.95 billion yuan in 2010, in which, direct products contributed 413.27 billion yuan, and indirect services value amounted to 2 573.68 billion yuan. The results showed that the ecological asset accounting system works well in reflecting the contribution of ecological asset to local social and economic development, and can be used to assess the ecological asset conditions. Thus, the ecological asset accounting system can be used in ecosystem management and governmental performance appraisal.
生态系统生产总值(GEP)核算研究——以浙江省丽水市为例
[J].
Research on gross ecosystem product (GEP):Case study of Lishui City,Zhejiang Province
[J].
生态承载力与生态系统生产总值耦合的生态系统服务评估——以福建省长汀县为例
[J].
Evaluation of regional ecosystem services grade coupling ecological carrying capacity and gross ecosystem product:A case study of Changting County,Fujian Province
[J].
国家公园生态系统生产总值核算——以海南热带雨林国家公园为例
[J].
DOI:10.13287/j.1001-9332.202111.010
[本文引用: 1]
海南热带雨林国家公园拥有我国最具代表性、连片面积最大的热带雨林,生态产品丰富,在开展国家公园生态产品价值实现机制探索上具有得天独厚的优势。本研究基于《陆地生态系统生产总值(GEP)核算技术指南》框架,构建符合热带雨林国家公园特色的GEP核算体系,对2019年海南热带雨林国家公园GEP进行核算。结果表明: 2019年,海南热带雨林国家公园GEP为2045.13亿元,单位面积GEP为0.46亿元·km<sup>-2</sup>。其中,物质产品价值为48.50亿元,占国家公园GEP总量的2.4%;生态系统调节服务价值为1688.91亿元,占82.6%;文化服务价值为307.72亿元,占15.0%。从不同生态系统类型来看,以山地雨林、低地雨林、落叶季雨林、热带云雾林等为代表的热带雨林生态系统的单位面积价值量远高于人工林及其他生态系统,表明热带雨林生态系统在提供生态系统服务功能方面具有显著作用。此外,本研究还基于国家公园GEP核算结果,提出进一步探索生态产品价值实现路径和实现机制的相关建议。
Gross ecosystem product accounting of national park:Taking Hainan tropical rainforest national park as an example
[J].
生态系统生产总值与区域经济耦合协调机制及协同发展——以大连市为例
[J].
Coupling coordination mechanism and spatial-temporal relationship between gross ecosystem product and regional economy:A case study of Dalian
[J].DOI:10.2307/142170 URL [本文引用: 2]
长三角地区生态系统生产总值时空变化及重要生态保护空间识别
[J].
DOI:10.18402/resci.2022.04.16
[本文引用: 1]
合理的生态保护空间管控可以有效权衡社会经济发展与生态保护之间的矛盾。重要生态保护空间是区域中最具有保护价值的优质生态产品区,对维持区域生态安全与可持续发展具有重要意义。本文以快速城市化的长三角地区为研究区,利用CASA、RUSLE等生态模型、市场价值法、影子工程法等价值估算方法,估算分析长三角2000—2017年生态系统生产总值(GEP)时空变化格局,采用STARS突变检验,结合自然保护区,尝试提出基于GEP的区域重要生态保护空间识别方法,结果表明:①长三角地区GEP总体呈现上升趋势,从2000年4.61万亿元增长到2017年7.12万亿元,分别为同年GDP的2.06、0.36倍。②三大生态系统服务中,调节服务占比最大,分别占2000年和2017年GEP总值的89.1%、64.9%;供给服务和文化服务2000年占GEP总值比例分别为9.60%、1.33%,2017年分别提升至20.83%、14.31%。③GEP空间分布呈南高北低,平原和沿海区域的单位面积GEP偏低,而山地丘陵地区较高。④长三角地区重要生态保护空间占国土空间面积的12%,其中,江苏、安徽、浙江和上海分别占国土空间面积的11%、12%、13%、13%,与生态保护红线具有较好的空间耦合。
Spatiotemporal variations of gross ecosystem product and identification of important ecological protection spaces in the Yangtze River Delta
[J].
DOI:10.18402/resci.2022.04.16
[本文引用: 1]
Reasonable ecological protection space can optimize the ecological environment in a certain region, improve ecological function, maintain ecological security, and achieve sustainable development goals. The important ecological protection space is the area with the highest protection value of high-quality ecological products in the region. Taking the rapidly urbanizing Yangtze River Delta region as the research area, this study used CASA and RUSLE ecological models, market value method, and shadow engineering method to estimate and analyze the spatial and temporal changes of gross ecosystem product (GEP) in the Yangtze River Delta region from 2000 to 2017. The sequential t-test analysis of regime shift (STARS) mutation test, combined with nature reserves, identifies important ecological protection spaces in the region. The results show that: (1) The GEP in the Yangtze River Delta region shows an upward trend, from 4.61 trillion yuan in 2000 to 7.12 trillion yuan in 2017, which are 2.06 and 0.36 times of the GDP in the same year. (2) Among the three main ecosystem services, the regulation services are the largest, accounting for 89.1% and 64.9% of the total GEP in 2000 and 2017, respectively. The proportion of supply services and cultural services in the total GEP has increased. (3) The spatial distribution of GEP is high in the south and low in the north, and the unit GEP in the plain and coastal areas is low while that in the mountainous and hilly areas is high. (4) Important ecological protection space in the Yangtze River Delta region accounts for 12% of the territorial space area, of which Jiangsu, Anhui, Zhejiang, and Shanghai account for 11%, 12%, 13% and 13% of the territorial space area, respectively, and have healthy spatial coupling with the ecological protection red line.
Valuing natural capital amidst rapid urbanization:Assessing the gross ecosystem product (GEP) of China’s ‘Chang-Zhu-Tan’ megacity
[J].DOI:10.1088/1748-9326/abc2f8 URL [本文引用: 1]
北京市延庆区生态系统生产总值核算及空间化
[J].
Accounting and mapping of gross ecosystem product in Yanqing District,Beijing
[J].
2000—2017年湖南省土地耕作适宜性、气候生产潜力与LUCC过程动态特征
[J].
The dynamic features of land cultivation suitability,climatic potential productivity and LUCC process from 2000 to 2017 in Hunan Province,China
[J].
亚热带山地丘陵区植被NPP时空变化及其与气候因子的关系——以湖南省为例
[J].
DOI:10.11821/dlxb201601003
[本文引用: 1]
以湖南省为研究区,采用250 m×250 m空间分辨率的MODIS-NDVI数据,结合相应时间段的气象数据,使用改进的CASA模型,模拟并分析该区域2000-2013年间的植被NPP的时空变化特征,并借助统计分析方法对不同土地覆盖类型中植被NPP的变化趋势及其显著性,NPP与气候因子的相关性进行量化分析.结果表明:① 该区域的净初级生产量年际变化特征明显,年净初级生产量分布在41.62~125.40 Tg C/yr之间,平均值为86.34 Tg C/yr,总体来看,14年间湖南省植被净初级生产量呈波动减少趋势,年际减少趋势为2.70 Tg C/yr;② NPP空间分布差异较大,基本特点是西高东低,南高北低,从西南向东北呈逐渐递减趋势,其中,各植被分区的NPP有明显差异;③ 2000-2013年,湖南省植被NPP呈极显著增加(slope >0,p < 0.01),显著增加(slope > 0,0.01 ≤ p < 0.05),无明显变化(p ≥ 0.05),极显著减少(slope < 0,p < 0.01)和显著减少(slope < 0,0.01 ≤ p < 0.05)的区域分别占总面积的比例为5.40%,2.02%,61.64%,16.79%和14.15%.植被NPP变化趋势总体上显示为减少的趋势,而不同土地覆盖类型的植被NPP变化趋势及显著性存在较大差异,其中草地的NPP变化趋势最为显著,接着依次是森林,其他土地,建设用地和农田;④ 分析不同土地覆盖类型的植被NPP对气候因子的响应,发现NPP与降水量之间的相关关系强于其与温度的相关关系.
Spatial and temporal variability of the net primary production (NPP) and its relationship with climate factors in subtropical mountainous and hilly regions of China:A case study in Hunan Province
[J].
湖南省生态系统服务供需格局演变
[J].
Evolution of the supply and demand pattern of ecosystem services in Hunan Province
[J].
陆地生态系统生产总值(GEP)核算技术指南
[Z/OL].
The technical guideline on gross ecosystem product (GEP)
[Z/OL].
中国大陆城市PM2.5污染时空分布规律
[J].
Spatiotemporal pattern of ground-level fine particulate matter (PM2.5) pollution in mainland China
[J].
Air pollution intervention and life-saving effect in China
[J].
DOI:S0160-4120(18)31419-3
PMID:30612707
[本文引用: 2]
As a critical air pollutant, PM is proved to be associated with numerous adverse health impacts and pose serious challenges to human life. This situation is especially important for China as the most populous and one of the heaviest PM polluted country in the world. However, health burden estimations reported for China in previous studies may be biased due to the usage of PM concentrations at a coarsely spatial resolution, as well as the ignorance of the spatial discrepancies of parameters (e.g. respiratory rate) employed in the exposure-response function. This study therefore utilized a hybrid remote sensing-geostatistical approach to refine PM concentrations at 1 km resolution across mainland China from 2013 to 2017. Meanwhile, nationwide exposure parameters were for the first time introduced to weight the integrated exposure response (IER) function to calculate and spatially reallocate the corresponding PM-attributable premature deaths at 1 km resolution. Results showed that annually averaged PM concentrations in mainland China decreased by 39.5%, from 59.1 μg/m in 2013 to 35.8 μg/m in 2017. Subsequently, PM attributable premature deaths reduced 12.6%, from 1.20 million (95% CI: 0.57; 1.71) in 2013 to 1.05 million (95% CI: 0.44; 1.44) in 2017. This declining trend was found in most parts of China except some areas in Xinjiang, Jilin, and Heilongjiang provinces. As a result, 214,821 (95% CI: 96,675; 302,897) life were saved with an estimated monetary value of US$ 210.14 billion (2011 values). However, it has to be acknowledged that, the central and northern China within priority areas of air pollution control were still experiencing high numbers of premature deaths due to the severe PM pollution and high-density population. But more worrying than these priority areas are those Harbin-Changchun Metropolitan Region, City Belt in Central Henan and Yangtze-Huaihe City Belt in non-priority areas, which also have been seriously suffering PM attributable premature deaths over 28, 000 cases per year. In conclusion, despite the huge gain in life-saving effects in China over the past five years with the help of air pollution intervention policy, future work on cleaner air and better human health is still strongly needed, especially in non-priority areas of air pollution control.Copyright © 2018 Elsevier Ltd. All rights reserved.
城市绿地空气颗粒物及其与空气微生物的关系
[J].
Airborne particulates in urban greenland and its relationship with airborne microbes
[J].
稻田生态系统服务价值测算方法与应用——以苏州市域为例
[J].
DOI:10.11820/dlkxjz.2015.01.011
[本文引用: 2]
对稻田资源的生态服务价值重视不足是稻田保护工作的最大缺陷,导致了稻田资源流失严重。本文以苏州市水稻田为例,运用造林成本法、瑞典碳税法、制氧工业成本法、替代成本法、影子工程法、当量因子法等方法对稻田生态系统各项服务价值进行了测算。结果表明,苏州市域稻田生态系统服务净总价值量为60785.18×10<sup>5</sup>元,单位面积净价值量为73111.84 元/hm<sup>2</sup>。其中,正面总价值量为68485.93×10<sup>5</sup>元,环境效应负总价值量为7700.75×10<sup>5</sup>元,前者为后者的8.89 倍。从稻田生态系统服务价值各部分的比例看,其实物生产价值远远低于其生态经济价值,表明了作为人工湿地生态系统,稻田生态服务价值对社会经济的可持续发展具有十分重要的作用。研究结果将有助于确定稻田保护经济补偿标准,为各级政府出台相关政策提供思路和依据
Calculation methods of paddy ecosystem service value and application:A case study of Suzhou City
[J].
乌梁素海湿地生态系统服务功能及价值评估
[J].
Evaluation of wetland ecosystem services in Wuliangsuhai
[J].The wetland ecosystem services in arid and semi-arid regions are very important to local environment and livelihood of people. Located in an arid region of northwestern China, Wuliangsuhai is the largest wetland in the valley of the Yellow River. Based on field investigation and statistic data available, a frame of wetland ecosystem services in Wuliangsuhai and methods to evaluate their values are constructed. According to their features, two kinds of ecosystem services are identified: product supply services of direct values and environmental and life support services of indirect values. The main technique for valuing this ecological function of the wetland is the production function approach, and valuing the non-market environmental services through the use of surrogate market valuation. Results show that the direct values including provision of ecosystem products, and recreation and tourism are 0.45×10⁸ RMB, mainly the values of reed production. The indirect values in terms of water resource regulating, wildlife habitat provision, environmental purification, air ingredients controlling, and culture services are 6.68×10⁸ RMB, which is 14.84 times higher than direct values. From above estimated values, it can be concluded that the wetland ecosystem services have great ecological and economic values.The values of wetland ecosystem services in Wuliangsuhai are ranked as follows: regulating air ingredients > water resources regulating > wildlife habitat provision > products provision > environmental purification > recreation and tourism. The function of regulating air ingredients is of the highest value, which indicates that this function is very important in wetlands dominated by emergent macrophytes. The value of regulating water resources is 26.08 percent of the total ecosystem values, and the percentage was lower compared to results achieved in similar researches in other regions. It is indicated that shortage of water resource and eutrophication caused by non-point pollution from Hetao irrigation district are major problems facing Wuliangsuhai to fulfill wetland ecosystem services.The methods applied in the paper are convenient and widely used, but the criteria and principles of evaluation especially for wildlife habitat provision and culture services need to be improved in further studies.
杭州湾滨海湿地生态系统服务价值变化
[J].
Changes of ecosystem services value of Hangzhou Bay Coastal Wetland
[J].
黄土高原生态功能区土壤保持功能及其价值
[J].
Evaluation of soil conservation function and its values in major eco-function areas of loess plateau in eastern Gansu Province
[J].
博斯腾湖生态系统最终服务价值评估
[J].博斯腾湖是中国最大的内陆淡水湖,为水资源匮乏的干旱地区提供了重要的生态系统服务。开展博斯腾湖生态系统最终服务(final ecosystem services)价值评估能用直观的经济数据揭示博斯腾湖对人类效益的直接贡献,为博斯腾湖生态保护创建生态补偿等经济驱动机制。本文在分析博斯腾湖区域水资源特征及其与社会经济发展相互作用的基础上,建立了博斯腾湖生态系统最终服务评估指标体系,并以2012年为基础年,综合运用市场价值法、替代成本法、个体旅行费用模型法和条件价值法评估了博斯腾湖提供给人类的生态经济价值。结果表明:博斯腾湖生态系统服务总价值为91.89×10<sup>8</sup>元·a<sup>-1</sup>,其中径流调节价值和休闲娱乐价值分别为77.60×10<sup>8</sup>元和8.44×10<sup>8</sup>元,两项服务价值占总价值的93.63%;对所评价的9项生态系统最终服务按价值量排序,依次为径流调节>休闲娱乐>释氧>原材料生产>固碳>淡水产品>非使用价值>水资源供给>水质净化。评估结果用直观的数字揭示了博斯腾湖维持区域社会经济发展的作用,不仅能提高管理者和公众的湿地认知,也为管理部门制定相应的生态补偿制度提供了重要依据。评估方法和评估参数为完善博斯腾湖生态系统服务及生态特征动态监测指标体系,研究不同水资源配置方式对人类福祉的影响,协调水资源开发过程中生态、经济、社会之间的矛盾提供了重要方向。
Final ecosystem services valuation of Bosten Lake
[J].As the biggest inland freshwater lake in China, Bosten Lake provides important ecosystem services to the arid area that is poor in water resources. Ecosystem services valuation of Bosten Lake can reveal the direct contribution of Bosten Lake to human welfare using visible economic data, thus creating economic incentives (<em>e.g</em>. ecological compensation) to protect Bosten Lake. In this paper, we established the final ecosystem services valuation system based on the interactions between regional water resources and socioeconomic conditions. We then evaluated the ecological economic value from nine final ecosystem services provided by Bosten Lake in 2012 using market price method, replacement cost method, individual travel cost method, and contingent valuation method. The total estimated value of the ecosystem services from Bosten Lake was 91.89×10<sup>8</sup> Yuan RMB in 2012, among which the values of runoff regulation, and recreation and tourism were 77.60×10<sup>8</sup> and 8.44×10<sup>8</sup> Yuan, respectively, accounting for 93.63% of the total value evaluated. According to the valuation, the nine final ecosystem services were ranked in a descending order as: runoff regulation, recreation and tourism, oxygen release, raw material products, carbon sequestration, aquatic products, non-use value, water resources provision, and water purification. The evaluation results reflect the multiple contributions of Bosten Lake to the sustainability of regional socioeconomic development, which will help increase awareness on the multiple ecosystem services from Bosten Lake, and inform managers on creating ecological compensation mechanisms. The evaluation methods and evaluation parameters in this study will also provide guidance to establish monitoring programs to study the influence of alternative ways of water resources allocation on human wellbeing, and provide important directions on coordinating multiple contradictories among ecology, economy, and society in the processes of water resources development.
扎龙湿地生态系统服务价值评价
[J].
Evaluation of ecosystem services in the Zhalong Wetland
[J].
中国陆地生态系统服务功能的时空变化分析
[J].
An analysis of the spatial and temporal changes in Chinese terrestrial ecosystem service functions
[J].
Global estimates of mortality associated with long-term exposure to outdoor fine particulate matter
[J].
DOI:10.1073/pnas.1803222115
URL
[本文引用: 1]
\n Exposure to ambient fine particulate matter (PM\n 2.5\n ) is a major global health concern. Quantitative estimates of attributable mortality are based on disease-specific hazard ratio models that incorporate risk information from multiple PM\n 2.5\n sources (outdoor and indoor air pollution from use of solid fuels and secondhand and active smoking), requiring assumptions about equivalent exposure and toxicity. We relax these contentious assumptions by constructing a PM\n 2.5\n -mortality hazard ratio function based only on cohort studies of outdoor air pollution that covers the global exposure range. We modeled the shape of the association between PM\n 2.5\n and nonaccidental mortality using data from 41 cohorts from 16 countries—the Global Exposure Mortality Model (GEMM). We then constructed GEMMs for five specific causes of death examined by the global burden of disease (GBD). The GEMM predicts 8.9 million [95% confidence interval (CI): 7.5–10.3] deaths in 2015, a figure 30% larger than that predicted by the sum of deaths among the five specific causes (6.9; 95% CI: 4.9–8.5) and 120% larger than the risk function used in the GBD (4.0; 95% CI: 3.3–4.8). Differences between the GEMM and GBD risk functions are larger for a 20% reduction in concentrations, with the GEMM predicting 220% higher excess deaths. These results suggest that PM\n 2.5\n exposure may be related to additional causes of death than the five considered by the GBD and that incorporation of risk information from other, nonoutdoor, particle sources leads to underestimation of disease burden, especially at higher concentrations.\n
土地利用转型的生态系统服务价值效应分析——以湖南省为例
[J].
DOI:10.11821/dlyj201504008
[本文引用: 3]
以1995年、2000年、2005年和2010年四期Landsat TM影像解译数据和社会经济数据为基础,借助ArcGIS分析手段,探讨了期间湖南省的土地利用转型情况。借鉴全球生态系统服务价值的最新研究成果,结合中国实际情况对生态系统服务价值系数进行了修订,进而对湖南省土地利用转型导致的生态系统服务价值变化进行了测度和分析。结果表明:1995-2010年,湖南省土地利用发生明显变化,主要表现为城乡建设用地增加及耕地和草地面积的减少;1995-2000年,湖南省生态系统服务价值略有提升,由8807.8亿元变为8829.5亿元,增加0.25%。但自2000年以后,生态系统服务价值持续下降,由2000年的8829.5亿元降至2010年的8770.9亿元,下降0.66%。最后,提出保障湖南省生态系统服务功能的土地利用优化配置建议。
Effects of land use transitions on ecosystem services value:A case study of Hunan Province
[J].
DOI:10.11821/dlyj201504008
[本文引用: 3]
With the rapid development of Chinese economy, many negative effects of land use transitions under the pressure of rapid urbanization on local ecological system and environment have occurred. This paper examines the dynamic patterns of land use transitions in Hunan province, using high-resolution Landsat TM (Thematic Mapper) data in 1995, 2000, 2005 and 2010, and socio-economic data from both research institutes and government departments, and assesses the changes of ecosystem services value (ESV) by drawing a connection between the observed land use dynamics and the evaluation of ESV, based on the latest research of Costanza et al. and some revisions adapted to the situation of China. The outcomes indicated that, during the period from 1995 to 2010, the land use changed significantly, characterized by the increase of construction land and the decrease of cultivated land and grassland; ESV of the study area decreased by 0.42%, from 880.78 to 877.09 billion RMB, due to the losses of large quantities of ecological land to construction land. Then, some of the major implications for improving the land use of Hunan province were discussed. The authors argue that it is fundamental to meet the demand of construction land for socio-economic development, meanwhile, to protect regional ecosystem services function and maintain its stability; only in this way Hunan province may realize the sustainable use of ecological resources in the process of rapid urbanization, as well as the integration of economic, social and ecological benefits.
