Please wait a minute...
 
自然资源遥感  2023, Vol. 35 Issue (3): 179-189    DOI: 10.6046/zrzyyg.2022224
  技术应用 本期目录 | 过刊浏览 | 高级检索 |
高空间分辨率生态系统生产总值时空演化分析——以2000—2020年湖南省为例
胡晨霞1,2(), 邹滨1,2(), 梁玉1, 贺晨骋3, 林治家3
1.中南大学地球科学与信息物理学院,长沙 410083
2.自然资源部时空信息与智能服务重点实验室,长沙 410083
3.湖南省地质调查院,长沙 410116
Spatio-temporal evolution of gross ecosystem product with high spatial resolution: A case study of Hunan Province during 2000—2020
HU Chenxia1,2(), ZOU Bin1,2(), LIANG Yu1, HE Chencheng3, LIN Zhijia3
1. School of Geosciences and Info-Physics, Central South University, Changsha 410083, China
2. Key Laboratory of Spatio-Temporal Information and Intelligent Services, Ministry of Natural Resources, Changsha 410083, China
3. Hunan Institute of Geological Survey, Changsha 410116, China
全文: PDF(9505 KB)   HTML  
输出: BibTeX | EndNote (RIS)      
摘要 

基于现有生态系统服务理论与方法,通过引入文教科研指标、优化气体调节指标,提出了湖南省本土自然资源生态系统生产总值(gross ecosystem product,GEP)核算指标体系,集成构建了GEP格网化评估模型,在30 m×30 m格网尺度评估分析了全省2000年、2010年和2020年GEP时空演化特征。研究结果表明: ①时间维度,近20 a间湖南省GEP上升3.34×10⁵亿元,增幅达40.28%; 各生态系统类型对GEP贡献的排序为: 森林>农田>草地>湿地>城市。②空间维度,湖南省GEP总体呈现出西部和东南部高、中部和北部低的空间分布格局; 西部武陵山片区增长率高,北部洞庭湖区增长率低。③与已有10 km×10 km研究结果相比,本研究高空间分辨率GEP结果在水域及城市生态系统呈现的空间分布细节信息更多。④各单项生态系统功能价值量对湖南省GEP的贡献度排序随时间呈现规律性变化,土壤保持功能价值量的贡献对武陵山片区和洞庭湖区GEP变化占据主导作用。研究结果可为湖南省自然资源监管及生态环境保护提供科学决策依据。

服务
把本文推荐给朋友
加入引用管理器
E-mail Alert
RSS
作者相关文章
胡晨霞
邹滨
梁玉
贺晨骋
林治家
关键词 自然资源生态系统生产总值高空间分辨率时空演化湖南省    
Abstract

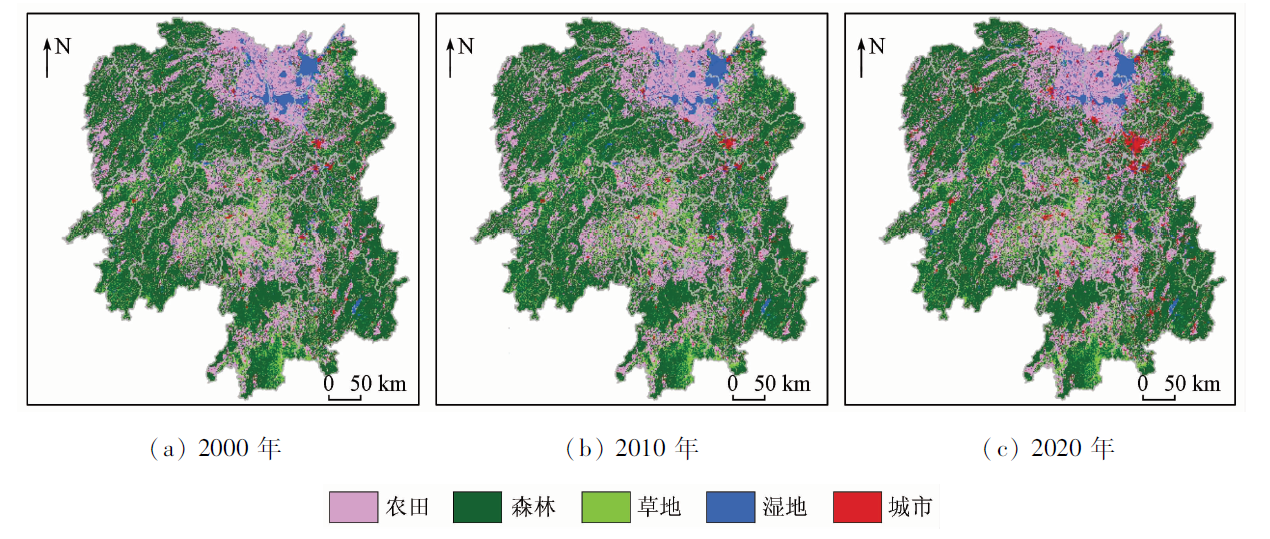
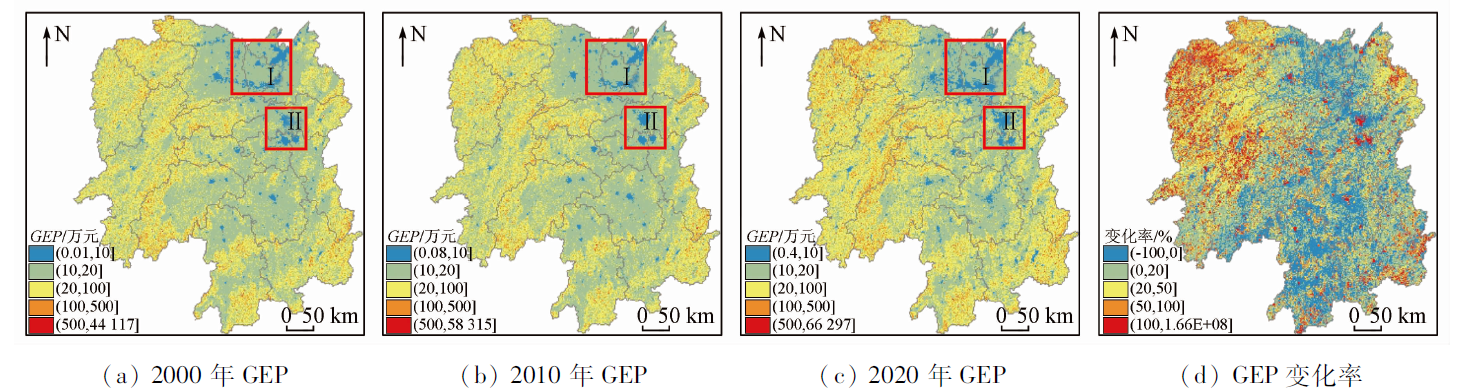
By introducing cultural, educational, and scientific research indices and optimizing gas regulation indices, this study proposed an index system to assess the gross ecosystem product (GEP) of natural resources in Hunan Province based on the existing theories and methods for ecosystem service. This study then built a grid-based GEP model with a grid scale of 30 m × 30 m to analyze the spatio-temporal evolution of the GEP of Hunan in 2000, 2010, and 2020. The results are as follows: ① In the temporal dimension, the GEP of the province increased by 3.34×10⁴ billion yuan over the past 20 years, with increased amplitude of 40.28%. The contribution of all ecosystems to the GEP was in the order of forest > farmland > grassland > wetland > city. ② In the spatial dimension, the GEP exhibited high values in western and southeastern regions and low values in central and northern regions. The GEP growth rate was higher in the Wulingshan area of western Hunan and lower in the Dongtinghu area of northern Hunan. ③ Compared with the existing research results on a grid scale of 10 km×10 km, the GEP results with a high spatial resolution showed more details of the spatial distribution of the aquatic and urban ecosystems. ④ The contribution degrees of ecosystem function values to the GEP of Hunan changed regularly over time. The contribution of the soil conservation function value dominated the changes in the GEP of the Wulingshan and Dongtinghu areas. The results of this study provide a basis for scientific decision-making in supervising natural resources and protecting the ecological environment in Hunan Province.

Key wordsnatural resources    gross ecosystem product    high spatial resolution    spatio-temporal evolution    Hunan Province
收稿日期: 2022-06-01      出版日期: 2023-09-19
ZTFLH:  TP79  
  F301.24  
  P951  
基金资助:国家自然科学基金项目“面向城市微环境场景的PM2.5浓度空间分布精细模拟”(41871317);湖南省自然资源科研项目“矿产资源价值评估模型研究”(2020-11)
通讯作者: 邹 滨(1981-),男,教授,博士生导师,研究方向为大气/土壤遥感监测、自然资源监测与分析。Email: 210010@csu.edu.cn
作者简介: 胡晨霞(1994-),女,博士研究生,研究方向为自然资源与可持续发展。Email: huchenxia0116@126.com
引用本文:   
胡晨霞, 邹滨, 梁玉, 贺晨骋, 林治家. 高空间分辨率生态系统生产总值时空演化分析——以2000—2020年湖南省为例[J]. 自然资源遥感, 2023, 35(3): 179-189.
HU Chenxia, ZOU Bin, LIANG Yu, HE Chencheng, LIN Zhijia. Spatio-temporal evolution of gross ecosystem product with high spatial resolution: A case study of Hunan Province during 2000—2020. Remote Sensing for Natural Resources, 2023, 35(3): 179-189.
链接本文:  
https://www.gtzyyg.com/CN/10.6046/zrzyyg.2022224      或      https://www.gtzyyg.com/CN/Y2023/V35/I3/179
Fig.1  研究区概况
生态产品与
服务类型
二级指标 指标描述及计算方法
物质产品 食物及原材料生产 生产农副产品、提供工业原料,计算方法参考文献[5]
有机物质生产 将无机物转化为有机物,计算方法参考文献[26]
水资源供给 地表产流、土壤含水量、冠层截留量等,计算方法参考文献[27]
调节服务 气体调节 由固碳释氧价值[5]、净化空气价值[28]、森林生态系统降低PM2.5暴露水平价值和温室气体排放的负效应价值[29-30]叠加获得,计算方法详见表后文说明
气候调节 增加湿度、降低大气温度,计算方法参考文献[29,31]
水文调节 涵养水源、调洪蓄水,计算方法参考文献[32]
土壤保持 保持土壤肥力、减少土地废弃、减轻泥沙淤积,计算方法参考文献[5,33]
维持生物多样性 提供栖息地,计算方法参考文献[4]
文化服务 休闲旅游 旅游消费支出、旅游时间成本,计算方法参考文献[34]
文教科研 生态主题科研论文产出,计算方法参考文献[35]
Tab.1  湖南省自然资源资产GEP核算方法
Fig.2  2000—2020年湖南省生态系统类型
年份 指标 农田 森林 草地 湿地 城市 合计
2000年 GEP/亿元 2.05×10⁵ 5.52×10⁵ 6.19×10⁴ 9.41×10³ 2.93 8.28×10⁵
贡献度/% 24.75 66.64 7.47 1.14 0.00 100.00
2010年 GEP/亿元 2.09×10⁵ 5.34×10⁵ 5.78×10⁴ 8.61×10³ 23 8.09×10⁵
贡献度/% 25.82 65.97 7.14 1.06 0.00 100.00
2020年 GEP/亿元 2.53×10⁵ 8.09×10⁵ 9.06×10⁴ 7.75×10³ 276 11.62×10⁵
贡献度/% 21.80 69.70 7.81 0.67 0.02 100.00
2000—2010年 变化量/亿元 0.04×10⁵ -0.18×10⁵ -0.41×10⁴ -800 20.07 -1.82×10⁴
变化率/% 1.95 -3.26 -6.62 -8.50 684.98 -2.20
2010—2020年 变化量/亿元 0.44×10⁵ 2.75×10⁵ 3.28×10⁴ -860 253 3.52×10⁵
变化率/% 21.05 51.50 56.75 -9.99 1 100 43.44
2000—2020年 变化量/亿元 0.48×10⁵ 2.57×10⁵ 2.87×10⁴ -1.66×10³ 273.07 3.34×10⁵
变化率/% 23.41 46.56 46.37 -17.64 9 319.80 40.28
Tab.2  2000—2020年湖南省GEP变化
Fig.3  2000—2020年湖南省GEP空间分布
Fig.4  2000—2020年湖南省各单项生态系统功能价值量空间分布
生态系统功能 2000年 2010年 2020年
价值量/亿元 贡献度/% 排序 价值量/亿元 贡献度/% 排序 价值量/亿元 贡献度/% 排序
食物及原材料生产 1 301.27 0.16 7 2 908.66 0.36 6 4 077.17 0.35 6
有机物质生产 2 168.73 0.26 6 2 304.76 0.28 7 2 326.59 0.20 8
水资源供给 3 406.31 0.41 5 4 079.14 0.50 5 4 013.57 0.35 7
气体调节 9 659.66 1.17 3 10 948.36 1.35 3 10 494.53 0.90 3
气候调节 309 937.93 37.41 2 309 081.20 38.15 2 302 826.77 26.06 2
水文调节 6 082.96 0.73 4 6 239.15 0.77 4 6 120.74 0.53 5
土壤保持 495 191.72 59.77 1 472 297.52 58.29 1 821 967.65 70.72 1
维持生物多样性 489.52 0.06 8 488.87 0.06 9 481.50 0.04 9
休闲旅游 260.08 0.03 9 1 909.03 0.24 8 9 903.22 0.85 4
文教科研 0.39 0.00 10 0.72 0.00 10 0.89 0.00 10
总计 828 498.57 100.00 810 257.42 100.00 1 162 212.63 100.00
Tab.3  2000—2020年湖南省各单项生态系统功能价值量分析
生态系统功能 2000年/亿元 2010年/亿元 2020年/亿元 2000—2010年 2010—2020年 2000—2000年
变化量/
亿元
贡献
度/%
变化量/
亿元
贡献
度/%
变化量/
亿元
贡献
度/%
食物及原材料生产 429.90 988.54 1 383.53 558.64 -20.26 394.99 0.14 953.63 0.35
有机物质生产 945.45 1 022.32 1 036.08 76.88 -2.79 13.76 0.00 90.64 0.03
水资源供给 1 251.65 1 394.24 1 661.71 142.59 -5.17 267.47 0.10 410.06 0.15
气体调节 4 228.93 4 772.56 4 613.73 543.63 -19.72 -158.83 -0.06 384.80 0.14
气候调节 129 111.18 129 932.62 130 481.39 821.44 -29.80 548.77 0.20 1 370.21 0.50
水文调节 2 006.45 2 037.57 2 112.59 31.12 -1.13 75.03 0.03 106.14 0.04
土壤保持 304 131.04 297 868.39 566 560.74 -6 262.65 227.17 268 692.35 97.25 262 429.70 95.94
维持生物多样性 205.81 205.84 204.73 0.03 0.00 -1.11 0.00 -1.09 0.00
休闲旅游 104.99 770.75 3 998.37 665.76 -24.15 3 227.62 1.17 3 893.38 1.42
文教科研 105.05 770.85 3 998.49 665.80 -24.15 3 227.64 1.17 3 893.44 1.42
总计 442 520.46 439 763.69 716 051.37 -2 756.77 100.00 276 287.68 100.00 273 530.91 100.00
Tab.4  2000—2020年武陵山片区各单项生态系统功能价值量分析
生态系统功能 2000年/亿元 2010年/亿元 2020年/亿元 2000—2010年 2010—2020年 2000—2000年
变化量/
亿元
贡献
度/%
变化量/
亿元
贡献
度/%
变化量/
亿元
贡献
度/%
食物及原材料生产 493.84 1 072.18 1 496.74 578.34 20.29 424.56 2.76 1 002.90 5.49
有机物质生产 439.90 474.42 469.10 34.52 1.21 -5.32 -0.03 29.19 0.16
水资源供给 896.15 1 154.44 1 023.68 258.29 9.06 -130.77 -0.85 127.53 0.70
气体调节 1 713.09 1 996.10 1 864.92 283.01 9.93 -131.18 -0.85 151.83 0.83
气候调节 71 012.42 71 128.58 66 018.06 116.16 4.08 -5 110.52 -33.17 -4 994.35 -27.35
水文调节 2 352.26 2 320.66 2 233.64 -31.60 -1.11 -87.02 -0.56 -118.62 -0.65
土壤保持 33 507.33 34 283.73 50 688.85 776.40 27.24 16 405.12 106.46 17 181.52 94.10
维持生物多样性 114.76 114.42 111.59 -0.34 -0.01 -2.83 -0.02 -3.17 -0.02
休闲旅游 65.83 483.23 2 506.83 417.40 14.65 2 023.60 13.13 2 441.00 13.37
文教科研 66.12 483.62 2 507.19 417.50 14.65 2 023.56 13.13 2 441.06 13.37
总计 110 661.69 113 511.39 128 920.59 2 849.70 100.00 15 409.20 100.00 18 258.90 100.00
Tab.5  2000—2020年洞庭湖区各单项生态系统功能价值量分析
[1] Assessment M E. Ecosystems and human well-being:Synthesis[J]. Physics Teacher, 2005, 34(9):534.
[2] Costanza R, d’Arge R, Groot R, et al. The value of the world’s ecosystem services and natural capital[J]. Nature, 1997, 387(15):253-260.
doi: 10.1038/387253a0
[3] Ouyang Z Y, Zheng H, Xiao Y, et al. Improvements in ecosystem services from investments in natural capital[J]. Science, 2016, 352(6292):1455-1459.
doi: 10.1126/science.aaf2295 pmid: 27313045
[4] 谢高地, 张彩霞, 张昌顺, 等. 中国生态系统服务的价值[J]. 资源科学, 2015, 37(9):1740-1746.
Xie G D, Zhang C X, Zhang C S, et al. The value of ecosystem services in China[J]. Resources Science, 2015, 37(9):1740-1746.
[5] 欧阳志云, 朱春全, 杨广斌, 等. 生态系统生产总值核算:概念、核算方法与案例研究[J]. 生态学报, 2013, 33(21):6747-6761.
Ouyang Z Y, Zhu C Q, Yang G B, et al. Gross ecosystem product:Concept,accounting framework and case study[J]. Acta Ecologica Sinica, 2013, 33(21):6747-6761.
doi: 10.5846/stxb
[6] Ma G X, Wang J N, Yu F, et al. Framework construction and application of China’s gross economic-ecological product accounting[J]. Journal of Environmental Management, 2020, 264:109852.
doi: 10.1016/j.jenvman.2019.109852
[7] 白杨, 李晖, 王晓媛, 等. 云南省生态资产与生态系统生产总值核算体系研究[J]. 自然资源学报, 2017, 32(7):1100-1112.
Bai Y, Li H, Wang X Y, et al. Evaluating natural resource assets and gross ecosystem products using ecological accounting system:A case study in Yunnan Province[J]. Journal of Natural Resources, 2017, 32(7):1100-1112.
doi: 10.11849/zrzyxb.20160755
[8] 欧阳志云, 林亦晴, 宋昌素. 生态系统生产总值(GEP)核算研究——以浙江省丽水市为例[J]. 环境与可持续发展, 2020, 45(6):80-85.
Ouyang Z Y, Lin Y Q, Song C S. Research on gross ecosystem product (GEP):Case study of Lishui City,Zhejiang Province[J]. Environment and Sustainable Development, 2020, 45(6):80-85.
[9] 陈华阳, 王远, 黄逸敏, 等. 生态承载力与生态系统生产总值耦合的生态系统服务评估——以福建省长汀县为例[J]. 水土保持学报, 2021, 35(5):150-160.
Chen H Y, Wang Y, Huang Y M, et al. Evaluation of regional ecosystem services grade coupling ecological carrying capacity and gross ecosystem product:A case study of Changting County,Fujian Province[J]. Journal of Soil and Water Conservation, 2021, 35(5):150-160.
[10] 江仕嵘. 陕西省生态系统生产总值核算及时空演变研究[D]. 咸阳: 西北农林科技大学, 2021.
Jiang S R. Gross ecosystem product accounting with its spatio-temporal evolution of Shaanxi Province[D]. Xianyang: Northwest A&F University, 2021.
[11] 谢泽阳. 赣南地区生态系统生产总值时空演变及驱动力研究[D]. 南昌: 南昌大学, 2021.
Xie Z Y. Spatiotemporal evolution and driving forces of gross ecosystem product in southern Jiangxi Province[D]. Nanchang: Nanchang University, 2021.
[12] 陈宗铸, 雷金睿, 吴庭天, 等. 国家公园生态系统生产总值核算——以海南热带雨林国家公园为例[J]. 应用生态学报, 2021, 32(11):3883-3892.
doi: 10.13287/j.1001-9332.202111.010
Chen Z Z, Lei J R, Wu T T, et al. Gross ecosystem product accounting of national park:Taking Hainan tropical rainforest national park as an example[J]. Chinese Journal of Applied Ecology, 2021, 32(11):3883-3892.
[13] 韩增林, 赵玉青, 闫晓露, 等. 生态系统生产总值与区域经济耦合协调机制及协同发展——以大连市为例[J]. 经济地理, 2020, 40(10):1-10.
Han Z L, Zhao Y Q, Yan X L, et al. Coupling coordination mechanism and spatial-temporal relationship between gross ecosystem product and regional economy:A case study of Dalian[J]. Economic Geography, 2020, 40(10):1-10.
doi: 10.2307/142170
[14] 魏巍. 基于能值生态足迹方法与生态系统生产总值的青海省生态补偿量化研究[D]. 兰州: 兰州大学, 2020.
Wei W. The quantitative analysis on ecological compensation of Qinghai Province based on the energy ecological footprint and gross ecosystem production[D]. Lanzhou: Lanzhou University, 2020.
[15] 林瑒焱, 徐昔保. 长三角地区生态系统生产总值时空变化及重要生态保护空间识别[J]. 资源科学, 2022, 44(4):847-859.
doi: 10.18402/resci.2022.04.16
Lin Y Y, Xu X B. Spatiotemporal variations of gross ecosystem product and identification of important ecological protection spaces in the Yangtze River Delta[J]. Resources Science, 2022, 44(4):847-859.
doi: 10.18402/resci.2022.04.16
[16] 董俐. 基于生态系统生产总值的区域生态补偿空间选择研究[D]. 杭州: 浙江大学, 2021.
Dong L. Selection of regional ecological compensation areas based on gross ecosystem product:A case study of Zhejiang Province[D]. Hangzhou: Zhejiang University, 2021.
[17] Zou Z Y, Wu T, Xiao Y, et al. Valuing natural capital amidst rapid urbanization:Assessing the gross ecosystem product (GEP) of China’s ‘Chang-Zhu-Tan’ megacity[J]. Environmental Research Letters, 2020, 15(12):124019.
doi: 10.1088/1748-9326/abc2f8
[18] 牟雪洁, 王夏晖, 张箫, 等. 北京市延庆区生态系统生产总值核算及空间化[J]. 水土保持研究, 2020, 27(1):265-274,282.
Mou X J, Wang X H, Zhang X, et al. Accounting and mapping of gross ecosystem product in Yanqing District,Beijing[J]. Research of Soil and Water Conversation, 2020, 27(1):265-274,282.
[19] 王继人, 钟昌标, 王玲玲, 等. 2000—2017年湖南省土地耕作适宜性、气候生产潜力与LUCC过程动态特征[J]. 山地学报, 2019, 37(2):252-262.
Wang J R, Zhong C B, Wang L L, et al. The dynamic features of land cultivation suitability,climatic potential productivity and LUCC process from 2000 to 2017 in Hunan Province,China[J]. Mountain Research, 2019, 37(2):252-262.
[20] 陈晓玲, 曾永年. 亚热带山地丘陵区植被NPP时空变化及其与气候因子的关系——以湖南省为例[J]. 地理学报, 2016, 71(1):35-48.
doi: 10.11821/dlxb201601003
Chen X L, Zeng Y N. Spatial and temporal variability of the net primary production (NPP) and its relationship with climate factors in subtropical mountainous and hilly regions of China:A case study in Hunan Province[J]. Acta Geographica Sinica, 2016, 71(1):35-48.
[21] 王盈丽, 徐新良, 庄大春, 等. 湖南省生态系统服务供需格局演变[J]. 生态学杂志, 2021, 40(10):3268-3277.
Wang Y L, Xu X L, Zhuang D C, et al. Evolution of the supply and demand pattern of ecosystem services in Hunan Province[J]. Chinese Journal of Ecology, 2021, 40(10):3268-3277.
[22] 中华人民共和国生态环境部. 陆地生态系统生产总值(GEP)核算技术指南[Z/OL]. 北京:中华人民共和国生态环境部,(2020-10-29)[2022-05-01]. http://www.caep.org.cn/zclm/sthjyjjhszx/zxdt_21932/202101/W020210122402035975103.pdf.
Ministry of Ecological Environment of the People’s Republic of China. The technical guideline on gross ecosystem product (GEP)[Z/OL]. Beijing:Ministry of Ecological Environment of the People’s Republic of China,(2020-10-29)[2022-05-01]. http://www.caep.org.cn/zclm/sthjyjjhszx/zxdt_21932/202101/W020210122402035975103.pdf.
[23] 李名升, 任晓霞, 于洋, 等. 中国大陆城市PM2.5污染时空分布规律[J]. 中国环境科学, 2016, 36(3):641-650.
Li M S, Ren X X, Yu Y, et al. Spatiotemporal pattern of ground-level fine particulate matter (PM2.5) pollution in mainland China[J]. China Environmental Science, 2016, 36(3):641-650.
[24] Zou B, You J W, Lin Y, et al. Air pollution intervention and life-saving effect in China[J]. Environment International, 2019, 125:529-541.
doi: S0160-4120(18)31419-3 pmid: 30612707
[25] 任启文, 王成, 郄光发, 等. 城市绿地空气颗粒物及其与空气微生物的关系[J]. 城市环境与城市生态, 2006, 19(5):22-25.
Ren Q W, Wang C, Qie G F, et al. Airborne particulates in urban greenland and its relationship with airborne microbes[J]. Urban Environment and Urban Ecology, 2006, 19(5):22-25.
[26] 郭伟. 北京地区生态系统服务价值遥感估算与景观格局优化预测[D]. 北京: 北京林业大学, 2012.
Guo W. Valuation of ecosystem services based on remote sensing and landscape pattern optimization in Beijing[D]. Beijing: Beijing Forestry University, 2012.
[27] 李敏. 基于InVEST模型的生态系统服务功能评价研究——以北京延庆为例[D]. 北京: 北京林业大学, 2016.
Li M. Ecosystem services evaluation based on InVEST model:A case study of Yanqing,Beijing[D]. Beijing: Beijing Forestry University, 2016.
[28] 徐立. 土地利用变化对长沙市生态系统服务价值的影响研究[D]. 长沙: 湖南大学, 2009.
Xu L. Effects of land use change on ecosystem services value in Changsha City,China[D]. Changsha: Hunan University, 2009.
[29] 刘利花, 尹昌斌, 钱小平. 稻田生态系统服务价值测算方法与应用——以苏州市域为例[J]. 地理科学进展, 2015, 34(1):92-99.
doi: 10.11820/dlkxjz.2015.01.011
Liu L H, Yin C B, Qian X P. Calculation methods of paddy ecosystem service value and application:A case study of Suzhou City[J]. Progress in Geography, 2015, 34(1):92-99.
[30] 段晓男, 王效科, 欧阳志云. 乌梁素海湿地生态系统服务功能及价值评估[J]. 资源科学, 2005, 27(2):110-115.
Duan X N, Wang X K, Ouyang Z Y. Evaluation of wetland ecosystem services in Wuliangsuhai[J]. Resources Science, 2005, 27(2):110-115.
[31] 李楠, 李龙伟, 张银龙, 等. 杭州湾滨海湿地生态系统服务价值变化[J]. 浙江农林大学学报, 2019, 36(1):118-129.
Li N, Li L W, Zhang Y L, et al. Changes of ecosystem services value of Hangzhou Bay Coastal Wetland[J]. Journal of Zhejiang A&F University, 2019, 36(1):118-129.
[32] 贾芳芳. 基于InVEST模型的赣江流域生态系统服务功能评估[D]. 北京: 中国地质大学(北京), 2014.
Jia F F. InVEST model based ecosystem services evaluation with case study on Ganjiang River basin[D]. Beijing: China University of Geosciences(Beijing), 2014.
[33] 韩永伟, 高吉喜, 王宝良, 等. 黄土高原生态功能区土壤保持功能及其价值[J]. 农业工程学报, 2012, 28(17):78-85.
Han Y W, Gao J X, Wang B L, et al. Evaluation of soil conservation function and its values in major eco-function areas of loess plateau in eastern Gansu Province[J]. Transactions of the Chinese Society of Agricultural Engineering, 2012, 28(17):78-85.
[34] 江波, 陈媛媛, 饶恩明, 等. 博斯腾湖生态系统最终服务价值评估[J]. 生态学杂志, 2015, 34(4):1113-1120.
Jiang B, Chen Y Y, Rao E M, et al. Final ecosystem services valuation of Bosten Lake[J]. Chinese Journal of Ecology, 2015, 34(4):1113-1120.
[35] 崔丽娟, 庞丙亮, 李伟, 等. 扎龙湿地生态系统服务价值评价[J]. 生态学报, 2016, 36(3):828-836.
Cui L J, Pang B L, Li W, et al. Evaluation of ecosystem services in the Zhalong Wetland[J]. Acta Ecologica Sinica, 2016, 36(3):828-836.
[36] 石垚, 王如松, 黄锦楼, 等. 中国陆地生态系统服务功能的时空变化分析[J]. 科学通报, 2012, 57(9):720-731.
Shi Y, Wang R S, Huang J L, et al. An analysis of the spatial and temporal changes in Chinese terrestrial ecosystem service functions[J]. Chinese Science Bulletin, 2012, 57(9):720-731.
[37] Burnett R, Chen H, Fann N, et al. Global estimates of mortality associated with long-term exposure to outdoor fine particulate matter[J]. Proceedings of the National Academy of Sciences, 2018, 115(38):9592-9597.
doi: 10.1073/pnas.1803222115
[38] 刘永强, 廖柳文, 龙花楼, 等. 土地利用转型的生态系统服务价值效应分析——以湖南省为例[J]. 地理研究, 2015, 34(4):691-700.
doi: 10.11821/dlyj201504008
Liu Y Q, Liao L W, Long H L, et al. Effects of land use transitions on ecosystem services value:A case study of Hunan Province[J]. Geographical Research, 2015, 34(4):691-700.
doi: 10.11821/dlyj201504008
[39] 熊鹰, 张方明, 龚长安, 等. LUCC影响下湖南省生态系统服务价值时空演变[J]. 长江流域资源与环境, 2018, 27(6):1397-1408.
Xiong Y, Zhang F M, Gong C A, et al. Spatial-temporal evolvement of ecosystem service value in Hunan Province based on LUCC[J]. Resources and Environment in the Yangtze Basin, 2018, 27(6):1397-1408.
[1] 蒋毅, 马克委, 王云凯, 杨红军, 何燕兰. 自然资源综合调查监测“一查多用”分类体系研究[J]. 自然资源遥感, 2023, 35(2): 264-270.
[2] 闫涵, 张毅. 利用GF-6影像结合国土“三调”开展西部地区县域自然资源调查[J]. 自然资源遥感, 2023, 35(2): 277-286.
[3] 黄韬, 刘小平, 吴佳平, 肖燕玲, 张雨辰. 国有土地资源资产核算信息化设计与实现[J]. 自然资源遥感, 2022, 34(3): 249-256.
[4] 吴浩波, 吴梦彤, 杨斯棋, 范闻捷, 任华忠. 基于叶片空间分布的植被遥感适宜尺度方法[J]. 自然资源遥感, 2022, 34(2): 72-79.
[5] 熊育久, 赵少华, 鄢春华, 邱国玉, 孙华, 王艳林, 秦龙君. 城市绿地资源多尺度监测与评价方法探讨[J]. 国土资源遥感, 2021, 33(1): 54-62.
[6] 王跃峰, 武慧智, 何姝珺, 黄頔, 白朝军. 河南省信阳市浉河区自然资源智能化信息提取技术方法研究[J]. 国土资源遥感, 2020, 32(4): 244-250.
[7] 张朝忙, 叶远智, 邓轶, 王建邦. 我国自然资源监测技术装备发展综述[J]. 国土资源遥感, 2020, 32(3): 8-14.
[8] 黄景金, 唐长增, 李毅, 左天惠, 杨郑贝. 广西自然资源调查监测体系构建[J]. 国土资源遥感, 2020, 32(2): 154-161.
[9] 张春森, 吴蓉蓉, 李国君, 崔卫红, 冯晨轶. 面向对象的高空间分辨率遥感影像箱线图变化检测方法[J]. 国土资源遥感, 2020, 32(2): 19-25.
[10] 汪洁, 殷亚秋, 于航, 蒋存浩, 万语. 基于RS和GIS的浙江省矿山地质环境遥感监测[J]. 国土资源遥感, 2020, 32(1): 232-236.
[11] 刘玉锋, 潘英, 李虎. 基于高空间分辨率遥感数据的天山云杉树冠信息提取研究[J]. 国土资源遥感, 2019, 31(4): 112-119.
[12] 郑艺, 林懿琼, 周建, 甘伟修, 林广旋, 许方宏, 林光辉. 基于资源三号的雷州半岛红树林种间分类研究[J]. 国土资源遥感, 2019, 31(3): 201-208.
[13] 姚丙秀, 黄亮, 许艳松. 一种结合超像素和图论的高空间分辨率遥感影像分割方法[J]. 国土资源遥感, 2019, 31(3): 72-79.
[14] 卫宝泉, 索安宁, 李颖, 赵建华. LBV变换在国产ZY-3卫星影像中应用研究探讨[J]. 国土资源遥感, 2019, 31(3): 87-94.
[15] 黄惠, 郑雄伟, 孙根云, 郝艳玲, 张爱竹, 容俊, 马红章. 基于引力自组织神经网络的震害遥感影像分类[J]. 国土资源遥感, 2019, 31(3): 95-103.
Viewed
Full text


Abstract

Cited

  Shared   
  Discussed   
京ICP备05055290号-2
版权所有 © 2015 《自然资源遥感》编辑部
地址:北京学院路31号中国国土资源航空物探遥感中心 邮编:100083
电话:010-62060291/62060292 E-mail:zrzyyg@163.com
本系统由北京玛格泰克科技发展有限公司设计开发