

0 引言
卫星雷达测高技术是一种用于确定海洋大地水准面和估算海面地形变化的空间技术[3]。星载雷达测高技术自2010年以来不断创新,在CryoSat-2发射之前,卫星雷达测量都是低分辨率模式(low resolution mode,LRM),CryoSat-2是首个使用合成孔径雷达(synthetic aperture Radar,SAR)模式的测高卫星[1],广泛应用于陆地水体,尤其是湖泊水位年际变化分析。Sentinel-3是首个在全球范围内使用SAR模式和开环跟踪模式的测高卫星[4],与Cryo-Sat-2相比受地形影响更小,数据质量更高,并具有良好的全球覆盖和较高的时空分辨率,因此在监测内陆水体水位方面具有巨大潜力[1]。
当雷达高度计监测河流水位时,其足迹同时触及水面和陆地。由于水深较浅和河流周围环境的影响,回波波形噪声较大且常被污染,导致高度计至被测水面的距离不准确[5],因此,需要对波形数据进行重跟踪处理以获取距离改正值,从而提高水位提取的精度[6⇓⇓⇓⇓-11]。目前,针对不同的回波波形已经开发了多种重跟踪算法进行重跟踪处理,算法主要有全波形重跟踪算法和基于子波形重跟踪算法2类。全波形重跟踪算法又称为物理重跟踪算法,包括重心偏移法(off-center of gravity method,OCOG)[12]、阈值法[13]、β参数法[14]和Ice-1算法[15]等,适用于几乎所有雷达高度计数据,对冰面波形(单峰波形)表现出较高的精度[16],适用于回波噪声小且地形平坦的水体,如大型湖泊、宽大河流。基于子波形重跟踪算法又称经验重跟踪算法,包括改进阈值法[17]、狭窄主波峰重跟踪[11]、多回波波峰一致重跟踪(the multiple waveform perstistent peak,MWaPP)[18]和50%阈值法结合Ice-1重跟踪算法(50% threshold and Ice-1 combined,TIC)[19]等,同样适用于几乎所有雷达高度计数据,对复杂多波峰波形表现出较高的精度,多用于处理反射面复杂的内陆水体。
在本研究中,以长江中下游流域为研究区,利用Sentinel-3A/SRAL L2级波形数据开展长江中下游干流的水位提取。为了对比全波形重跟踪算法和子波形重跟踪算法在提取河流水位方面的适用性,本研究选取了全波形重跟踪算法中的OCOG法及子波形重跟踪算法中的主波峰峰值重跟踪算法(narrow primary peak retracker,NPPR)(包括阈值主波峰重跟踪算法(narrow primary peak threshold retracking,NPPTR)(阈值取50%和80%)、重心主波形重跟踪算法(narrow primary peak OCOG retracker,NPPOR)、MWaPP算法5种重跟踪算法进行对比,分别对Sentinel-3A/SRAL L2级波形数据进行波形重跟踪处理,并利用水位站点实测数据进行精度验证,选择5种算法中适用于河流水位提取的最优重跟踪算法,提取长江中下游干流2016—2021年的水位变化信息,从而分析水位变化规律。
1 研究区概况与数据源
1.1 研究区概况
本研究选择长江中下游区域作为研究区,其地理范围为E111°~123°,N27°~34°,干流河道自宜昌至河口全长约1 893 km[20],地跨湖北、湖南、江西、安徽、江苏、浙江和上海等7个省级行政区。长江中下游流域地形平坦,面积约80万km2,以长江为中心的水系发达支流众多,如汉江(1 532 km)、湘江(817 km)、沅江(993 km)以及赣江(758 km)等。长江中下游位于中低纬度地区,属亚热带季风气候,全年温暖湿润,年均气温为14~18 ℃,降水量在1 000~1 500 mm左右。 在本研究中,主要以长江干流为主要研究对象,开展河流水位的提取,研究区概况如图1所示(其中红色字体为轨道编号)。
图1
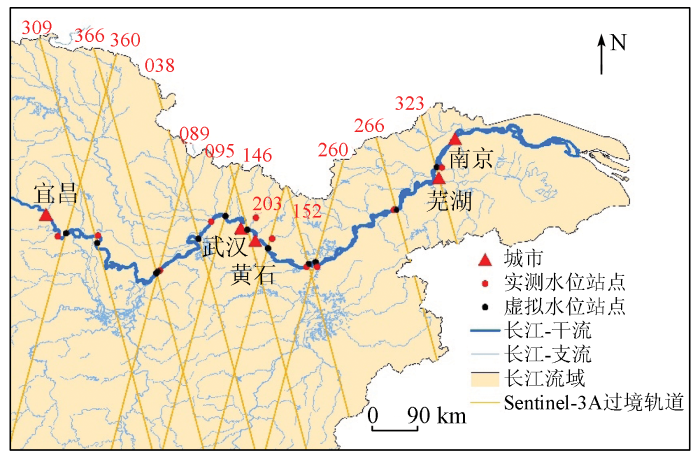
图1
研究区概况及雷达高度计数据覆盖示意图
Fig.1
Overview of the study area and data coverage of Radar altimeter
1.2 数据源
1.2.1 雷达高度计数据
本研究使用的雷达高度计数据为Sentinel-3A/SRAL L2级波形数据(下载地址: https://scihub.copernicus.eu/dhus/#/home)。Sentinel-3A测高卫星由欧洲空间局(European Space Agency,ESA)于2016年2月16日发射升空,搭载SRAL高度计,轨道高度为814.5 km,采用Ku波段和C波段,空间分辨率为300 m,重访周期为27 d,足迹点直径为2(0.25)km。本文选取该高度计2016—2021年038,089,095,146,152,203,260,266,309,323,360,366这12条过境长江中下游地区的轨道,开展长江干流水位提取。长江干流与过境的高度计形成的水位虚拟站如图1所示,共有12个虚拟水文站点,分别对应12条过境轨道。
1.2.2 辅助数据
本研究获取了长江中下游地区水文站点水位实测数据,用于验证高度计提取河流水位的精度。获取的水位实测数据包括大通、当涂、汉口、湖口、九江、螺山、马家潭、沙市、西河驿及枝城水文站点2016—2021年单天实测水位数据,来源为长江实测水文站点及千里眼水雨情查询系统(http://113.57.190.228:8001/#!/web/Report/RiverReport)。
此外,本研究还获取了中国流域片及长江中下游流域掩模数据(下载地址: https://download.csdn.net)用于提取长江中下游地区干流的边界范围。
2 研究方法
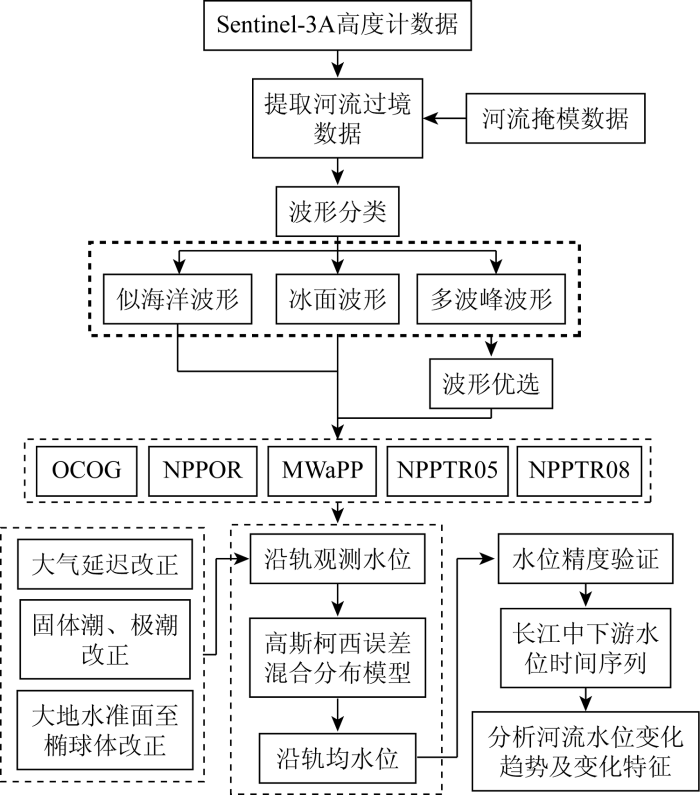
本研究采用的技术流程如图2所示: ①利用中国流域片及长江中下游流域掩模数据提取长江中下游干流边界; ②利用Sentinel-3A轨道数据提取过境轨道落在长江干流上的水位观测点(虚拟水位站); ③针对获取的水位观测点进行目视解译,剔除明显的水位异常波形数据; ④采用OCOG算法、线性判别分析(linear discriminant analysis,LDA)和朴素贝叶斯分类器[21]相结合的方法分别对波形进行分类,去除多波峰波形的噪声; ⑤采用OCOG,NPPOR,NPPTR05,NPPTR08及MWaPP这5种波形重跟踪算法对波形分类后优选的Sentinel-3A波形数据进行重跟踪,辅以大气延迟改正、固体潮改正、极潮改正及大地水准面至椭球体改正以获取沿轨观测水位; ⑥采用高斯柯西混合分布函数对轨道单点噪声进行去噪处理,求解单日沿轨均水位,开展水位提取精度验证,对比分析5种波形重跟踪算法提取水位的精度,优选出最优重跟踪算法; ⑦利用优选出的最优重跟踪算法提取河流水位,构建河流水位变化时间序列,探讨长江中下游河流水位变化趋势,分析水位变化特征。
图2
2.1 波形分类
图3
首先,基于统计关系选择K均值聚类法,利用OCOG算法参数(振幅
式中:
并利用前人提出的LDA与朴素贝叶斯分类器相结合的方法针对多波峰波形进行波形优选,去除噪声轨迹。具体过程如下:
1)选择分类特征,包括OCOG算法的基本参数(振幅
2)计算投影后的样本集
式中:
继而对目标函数
3)波形分类,根据朴素贝叶斯分类原理,对于待分类波形
2.2 波形重跟踪
为了获取更加精确的河流水位,必须对分类后的波形进行重跟踪,重新计算波形前缘中点,根据其与原定中点的差值,获得距离改正值,从而对高度计到被测水面的距离进行改正。本文选取2类共5种重跟踪算法进行波形重跟踪处理,具体如下:
2)MWaPP算法。假设沿轨所有观测点的波形中,高度计至星下点水体的距离值相同,利用线性内插得到1 cm高度间隔的插值波形,取相邻4个内插波形的平均值以削弱陆地噪声信号污染,对每一个平均波形提取主波峰在内的含7个波门的子波形并计算重心偏离振幅,首次超过80%振幅的位置即重跟踪点。
不同的重跟踪算法获得重定点位置对比如图4所示,可以看出5种重跟踪算法(OCOG,MWaPP,NPPOR,NPPTR05和NPPTR08)均能对Sentinel-3A/SRAL 20 Hz波形数据进行重跟踪处理。当波形中水面前缘存在较大噪声时,OCOG和MWaPP算法的性能会受到较大的影响,反之当波形中水面后缘存在较大噪声时,NPPOR,NPPTR05和NPPTR08算法性能会受到较大影响。
图4

图4
5种重跟踪算法获得的重定点位置对比
Fig.4
Comparison of retracked gates obtained by five retracking algorithms
2.3 卫星测高数据获取河流水位
对Sentinel-3A/SRAL 20 Hz的L2级波形数据用2.2节重跟踪算法获得改正后的观测距离[27],获得沿轨观测水位为:
式中:
2.4 水位高程基准转换
Sentinel-3A数据运用了WGS84参考系统,而长江中下游水文站点的实测水位数据采用了不同的基准面,如枝城水文站实测水位基于吴淞(扬委)基准面,西河驿水文站实测水位基于黄海水准面等。为进行2种数据的对比分析,在进行水位精度验证时要进行高程系统的转换。为将高度计数据与实测数据变换到同一水平上,要以实测数据为基准,将高度计数据减去两者之间的垂直偏差。然后,计算高度计提取的长江中下游各轨道水位与对应实测水位的相关系数
3 结果与分析
3.1 提取水位的精度分析
Sentinel-3A/SRAL L2级数据经5种重跟踪算法处理后获得长江中下游地区2016—2021年的干流水位,水位提取结果与实测水位数据的相关性示意图如图5所示(以OCOG算法为例)。
图5
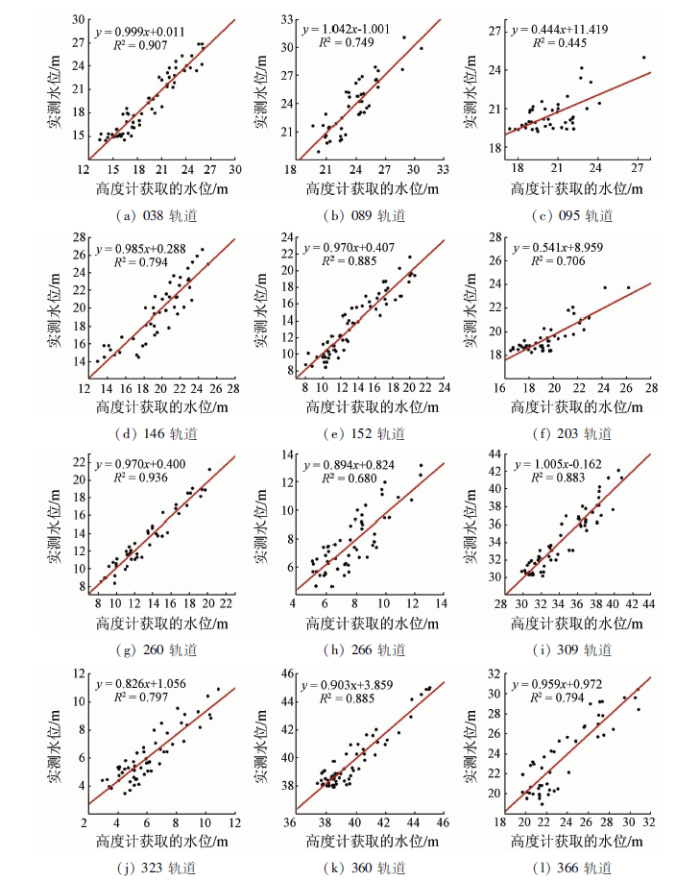
图5
OCOG重跟踪的Sentinel-3A/SRAL 高度计水位与实测水位的相关性
Fig.5
Correlation between Sentinel-3A/SRAL altimeter water level retracked by OCOG and in-situ water level
由于拟合直线斜率及决定系数
表1为不同重跟踪算法在不同轨道的水位提取结果与实测数据的具体对比统计数据,包括均方根误差
表1 不同重跟踪算法得到的Sentinel-3A/SRAL 高度计水位与实测水位比较结果
Tab.1
| 算法 | 指标 | 038 | 089 | 095 | 146 | 152 | 203 | 260 | 266 | 309 | 323 | 360 | 366 |
|---|---|---|---|---|---|---|---|---|---|---|---|---|---|
| MWaPP | 1.545 | 1.524 | 1.708 | 1.695 | 1.256 | 1.338 | 0.872 | 1.601 | 1.246 | 0.553 | 1.074 | 1.681 | |
| 0.897 | 0.915 | 0.631 | 0.818 | 0.937 | 0.627 | 0.965 | 0.686 | 0.930 | 0.953 | 0.901 | 0.864 | ||
| 54 | 51 | 42 | 29 | 70 | 45 | 51 | 52 | 60 | 57 | 58 | 53 | ||
| NPPOR | 1.442 | 1.439 | 1.630 | 1.638 | 1.205 | 1.389 | 0.859 | 1.427 | 1.261 | 0.719 | 1.105 | 1.475 | |
| 0.924 | 0.902 | 0.707 | 0.882 | 0.944 | 0.662 | 0.965 | 0.769 | 0.929 | 0.937 | 0.886 | 0.916 | ||
| 60 | 43 | 35 | 34 | 70 | 45 | 47 | 57 | 58 | 58 | 60 | 51 | ||
| NPPTR05 | 1.462 | 1.459 | 1.730 | 1.616 | 1.223 | 1.605 | 0.867 | 1.407 | 1.284 | 0.610 | 1.028 | 1.630 | |
| 0.921 | 0.892 | 0.642 | 0.892 | 0.944 | 0.561 | 0.963 | 0.771 | 0.930 | 0.950 | 0.892 | 0.873 | ||
| 60 | 46 | 38 | 35 | 73 | 49 | 49 | 57 | 59 | 58 | 59 | 58 | ||
| NPPTR08 | 1.333 | 1.667 | 1.714 | 1.844 | 1.202 | 1.572 | 0.864 | 1.476 | 1.255 | 0.676 | 1.048 | 1.579 | |
| 0.934 | 0.916 | 0.686 | 0.868 | 0.944 | 0.578 | 0.964 | 0.734 | 0.932 | 0.930 | 0.890 | 0.880 | ||
| 58 | 50 | 37 | 38 | 65 | 45 | 48 | 55 | 59 | 57 | 60 | 54 | ||
| OCOG | 1.145 | 1.409 | 1.469 | 1.469 | 1.201 | 1.197 | 0.841 | 1.158 | 1.126 | 0.881 | 0.680 | 1.565 | |
| 0.952 | 0.866 | 0.667 | 0.891 | 0.941 | 0.840 | 0.968 | 0.824 | 0.940 | 0.893 | 0.941 | 0.891 | ||
| 61 | 45 | 43 | 47 | 63 | 45 | 45 | 57 | 58 | 58 | 60 | 47 |
与MWaPP,NPPOR,NPPTR05和NPPTR08只利用主波峰子波形的重跟踪算法相比,传统的基于全波形的OCOG重跟踪算法在保证单天水位个数的前提下,提取的水位数据相关性更好,
3.2 长江中下游干流水位变化分析
各轨道过境长江中下游干流的虚拟水位站点位置及2016—2021年间最高最低水位情况如表2所示。结果显示各轨道最高最低水位与其虚拟水位站点位置密切相关,大致呈现自西向东依次递减的趋势,且最高水位的递减趋势更为明显; 各轨道过境区域的最高水位基本出现在每年的6—8月,最低水位基本出现在每年的11月—次年4月。
表2 各轨道虚拟水位站点位置及2016—2021年最高最低水位情况
Tab.2
| 轨道编号 | 虚拟水位站点位置 | 最高水位/m | 最高水位日期 | 最低水位/m | 最低水位日期 |
|---|---|---|---|---|---|
| 038 | E114°058',N30°253' | 28.360 | 2020-06-28 | 13.530 | 2019-11-25 |
| 089 | E113°333',N29°664' | 33.350 | 2020-06-05 | 18.811 | 2017-11-30 |
| 095 | E114°947',N30°416' | 26.175 | 2020-06-05 | 19.210 | 2019-08-13 |
| 146 | E114°547',N30°666' | 28.190 | 2016-07-09 | 13.600 | 2019-12-03 |
| 152 | E116°063',N29°789' | 21.659 | 2016-07-09 | 8.420 | 2019-12-03 |
| 203 | E115°323',N30°078' | 24.328 | 2020-06-13 | 18.401 | 2016-03-27 |
| 260 | E116°188',N29°827' | 22.495 | 2020-07-14 | 8.358 | 2019-12-11 |
| 266 | E117°654',N30°779' | 16.190 | 2020-07-14 | 4.620 | 2019-12-11 |
| 309 | E112°216',N30°178' | 42.111 | 2020-07-17 | 30.198 | 2019-11-25 |
| 323 | E118°393',N31°556' | 12.140 | 2020-07-18 | 3.460 | 2019-12-15 |
| 360 | E111°652',N30°353' | 48.289 | 2020-08-17 | 37.929 | 2018-12-05 |
| 366 | E113°294',N29°626' | 33.408 | 2020-07-21 | 18.970 | 2019-11-21 |
本文使用OCOG重跟踪算法,对Sentinel-3A/SRAL L2级波形数据进行全波形重跟踪,提取了过境长江中下游干流的12条Sentinel-3A轨道过境区域2016—2021年的河流水位。提取的单天水位结果与实测水位数据进行0均值化处理,相对水位大于0 m的观测点位水位值即1 a中的水位高值,小于0 m的观测点位水位值即1 a中的水位低值。形成的长江中下游干流2016—2021年各区域水位变化时间序列(相对水位)如图6所示。
图6
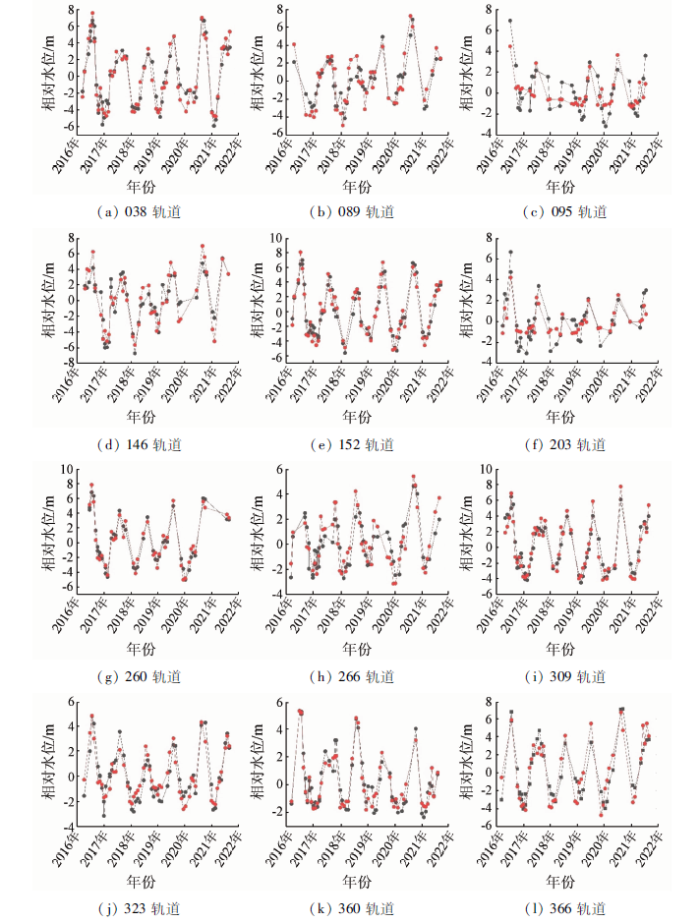
图6
长江中下游干流2016—2021年水位变化时间序列
Fig.6
Time series of water level changes in the middle and lower reaches of the Yangtze River from 2016 to 2021
结合图5—6可以看出: ①095,203和266轨道的过境区域2种水位数据的对比情况不太理想,符合3.1节中针对高度计数据与实测数据的相关性分析。原因可能是266轨道过境区域水位数据受周围房屋建筑物影响较大; 095和203轨道这2个区域虚拟水位点与获取实测数据的水文站点距离较远(如图1所示),实际间隔距离大于20 000 m,实测数据无法准确地反映该区域的实际水位状况。②每年的5—10月长江中下游干流各区域水位相对较高,其中6—9月水位上升幅度更为明显,这期间主要为长江中下游地区的汛期,降水量为年降水量的85%。而每年11月—次年4月长江中下游干流各区域水位相对较低,这期间为长江中下游地区的非汛期,降水量很少。③360和309轨道过境区域2016—2021年间的长江干流水位呈现先下降后上升的逐年规律性波动变化,河流水位总体呈现上升趋势; 038,146,203,152,260,089,366,323和266轨道过境区域的长江干流水位在2016—2018年间呈现逐年下降趋势,2018—2020年间呈现逐年上升趋势,2021年水位相较于2020年同期水位偏低,河流水位同样总体呈现上升趋势。
4 结论
星载雷达测高技术在监测内陆水体水位方面潜力巨大,选取合适的雷达高度计数据及波形重跟踪算法可以有效提高获取水位的精度。本研究基于Sentinel-3A/SRAL 20 Hz的L2级高度计数据进行了波形分类及波形重跟踪处理,对比了多种重跟踪算法所得的水位精度,并获取了长江中下游干流2016—2021年的河流水位变化信息。得出如下主要结论:
1)Sentinel-3A/SRAL L2级卫星测高数据可以用于提取河流水位,且波形数据质量较高,对波形数据进行波形分类和波形重跟踪可以有效提高高度计数据提取河流水位的精度。
2)对比基于全波形的OCOG算法与基于子波形的NPPTR05,NPPTR08,NPPOR及MWaPP这5种重跟踪算法,针对长江中下游12条Sentinel-3A轨道的过境区域进行水位提取。传统的OCOG重跟踪算法为最佳算法,与实测水位相比具有最大相关系数、最小均方根误差。
3)2016—2021年长江中下游干流水位总体呈上升趋势,年内水位变化呈现季节性,每年5—10月水位相对较高,为汛期,峰值一般出现在6—8月; 每年11月—次年4月水位相对较低,为非汛期,峰值一般出现在11—12月左右。
对于河宽不同与周边环境不同的河流,回波波形的质量不同,即便是同一种重跟踪算法表现也有所差别,这需要选取不同类型的河流进行对比分析,探讨适合河流水位提取的最优波形重跟踪算法。另外,本研究未考虑不同卫星轨道提取水位的差异,以及实测水位站点与轨道虚拟水位站点的距离对提取水位精度的影响程度,这也是未来需要进一步开展的研究。
参考文献
Analysis of retrackers’ performances and water level retrieval over the Ebro River basin using Sentinel-3
[J].
DOI:10.3390/rs11060718
URL
[本文引用: 3]

Satellite altimeters have been used to monitor river and reservoir water levels, from which water storage estimates can be derived. Inland water altimetry can, therefore, play an important role in continental water resource management. Traditionally, satellite altimeters were designed to monitor homogeneous surfaces such as oceans or ice sheets, resulting in poor performance over small inland water bodies due to the contribution from land contamination in the returned waveforms. The advent of synthetic aperture radar (SAR) altimetry (with its improved along-track spatial resolution) has enabled the measurement of inland water levels with a better accuracy and an increased spatial resolution. This study aimed to retrieve water levels from Level-1B Sentinel-3 data with focus on the minimization of the land contamination over small- to middle-sized water bodies (130 m to 4.5 km), where continuous clean waveforms rarely exist. Three specialized algorithms or retrackers, together with a new waveform portion selection method, were evaluated to minimize land contamination in the waveforms and to select the nadir return associated with the water body being overflown. The waveform portion selection method, with consideration of the Digital Elevation Model (DEM), was used to fit the multipeak waveforms that arise when overflying the continental water bodies, exploiting a subwaveform-based approach to pick up the one corresponding to the nadir. The performances of the proposed waveform portion selection method with three retrackers, namely, the threshold retracker, Offset Center of Gravity (OCOG) retracker and two-step SAR physical-based retracker, were compared. No significant difference was found in the results of the three retrackers. However, waveform portion selection using DEM information great improved the results. Time series of water levels were retrieved for water bodies in the Ebro River basin (Spain). The results show good agreement with in situ measurements from the Ebro Reservoir (approximately 1.8 km wide) and Ribarroja Reservoir (approximately 400 m wide), with unbiased root-mean-square errors (RMSEs) down to 0.28 m and 0.16 m, respectively, depending on the retracker.
Validation and application of water levels derived from Sentinel-3A for the Brahmaputra River
[J].DOI:10.1007/s11431-019-9535-3 [本文引用: 1]
Sentinel-3 Radar altimetry for river monitoring:A catchment-scale evaluation of satellite water surface elevation from Sentinel-3A and Sentinel-3B
[J].
DOI:10.5194/hess-25-333-2021
URL
[本文引用: 1]
. Sentinel-3 is the first satellite altimetry mission to operate both in synthetic aperture radar (SAR) mode and in open-loop tracking mode nearly globally. Both features are expected to improve the ability of the altimeters to observe inland water bodies. Additionally, the two-satellite constellation offers a unique compromise between spatial and temporal resolution with over 65 000 potential water targets sensed globally. In this study, we evaluate the possibility of extracting river water surface elevation (WSE) at catchment level from Sentinel-3A and Sentinel-3B radar altimetry using Level-1b and Level-2 data from two public platforms: the Copernicus Open Access Hub (SciHub) and Grid Processing on Demand (GPOD). The objectives of the study are to demonstrate that by using publicly available processing platforms, such databases can be created to suit specific study areas for any catchment and with a wide range of applications in hydrology. We select the Zambezi River as a study area. In the Zambezi basin, 156 virtual stations (VSs) contain useful WSE information in both datasets. The root-mean-square deviation (RMSD) is between 2.9 and 31.3 cm at six VSs, where in situ data are available, and all VSs reflect the observed WSE climatology throughout the basin. Some VSs are exclusive to either the SciHub or GPOD datasets, highlighting the value of considering multiple processing options beyond global altimetry-based WSE databases. In particular, we show that the processing options available on GPOD affect the number of useful VSs; specifically, extending the size of the receiving window considerably improved data at 13 Sentinel-3 VSs. This was largely related to the implementation of GPOD parameters. While correct on-board elevation information is crucial, the postprocessing options must be adapted to handle the steep changes in the receiving window position. Finally, we extract Sentinel-3 observations over key wetlands in the Zambezi basin. We show that clear seasonal patterns are captured in the Sentinel-3 WSE, reflecting flooding events in the floodplains. These results highlight the benefit of the high spatiotemporal resolution of the dual-satellite constellation.\n
卫星测高数据监测青海湖水位变化
[J].
Monitoring the water level changes in Qinghai Lake with satellitealtimetry data
[J].
Coastal gravity anomalies from retracked geosat/GM altimetry:Improvement,limitation and the role of airborne gravity data
[J].DOI:10.1007/s00190-006-0052-x URL [本文引用: 1]
Improved retracking algorithm for oceanic altimeter waveforms
[J].DOI:10.1016/j.pnsc.2008.06.017 URL [本文引用: 1]
A coastal altimetry retracking strategy based on waveform classification and sub-waveform extraction
[J].DOI:10.1080/01431161.2012.701350 URL [本文引用: 1]
Retracking Cryo-sat data in the SARIn mode and robust lake level extraction
[J].DOI:10.1016/j.rse.2014.05.014 URL [本文引用: 1]
Monitoring of lake level changes on the Tibetan Plateau and Tian Shan by retracking CryoSat SARIn waveforms
[J].DOI:10.1016/j.jhydrol.2014.11.063 URL [本文引用: 1]
Sea surface height determination in the Arctic using CryoSat-2 SAR data from primary peak empirical retrackers
[J].DOI:10.1016/j.asr.2014.09.006 URL [本文引用: 2]
New techniques in satellite altimeter tracking systems
[C]//
Growth of the Greenland ice sheet:A performance assessment of altimeter retracking algorithms
[J].DOI:10.1109/36.469474 URL [本文引用: 1]
Analysis and retracking of continental ice sheet Radar altimeter waveforms
[J].
An altimeter height extraction technique for dynamically changing rivers of South and South-East Asia
[J].DOI:10.1016/j.rse.2018.10.033 URL [本文引用: 1]
星载高度计水位提取方法研究进展
[J].
Research progress of water level extraction methods based on satellite altimeter
[J].
Laurentia crustal motion observed using TOPEX/POSEIDON Radar altimetry over land
[J].DOI:10.1016/j.jog.2008.05.001 URL [本文引用: 1]
Improved inland water levels from SAR altimetry using novel empirical and physical retrackers
[J].DOI:10.1016/j.jhydrol.2016.03.051 URL [本文引用: 2]
An improved approach to monitoring Brahmaputra River water levels using retracked altimetry data
[J].DOI:10.1016/j.rse.2018.04.018 URL [本文引用: 1]
2020年长江中下游干流河道冲淤变化特点及分析
[J].
Characteristics and analysis of erosion and deposition changes in the middle and lower reaches of the Yangtze River in 2020
[J].
卫星测高数据监测青藏高原湖泊2010年—2018年水位变化
[J].
Monitoring lake level changes on the Tibetan Plateau from 2000 to 2018 using satellite altimetry data
[J].
The inflection-point retracking algorithm:Improved Jason-2 sea surface heights in the Strait of Hormuz
[J].DOI:10.1080/01490419.2018.1448029 URL [本文引用: 1]
ENVISAT测高数据波形重跟踪分析研究
[J].
Research on waveform re-tracking analysis of ENVISAT altimetry data
[J].
CryoSat-2 Radar altimetry for monitoring freshwater resources of China
[J].DOI:10.1016/j.rse.2017.08.015 URL [本文引用: 1]
A modified empirical retracker for lake level estimation using CryoSat-2 SAR in data
[J].
DOI:10.3390/w10111584
URL
[本文引用: 1]
Satellite radar altimetry is an important technology for monitoring water levels, but issues related to waveform contamination restrict its use for rivers, narrow reservoirs, and small lakes. In this study, a novel and improved empirical retracker (ImpMWaPP) is presented that can derive stable inland lake levels from Cryosat-2 synthetic aperture radar interferometer (SARin) waveforms. The retracker can extract a robust reference level for each track to handle multi-peak waveforms. To validate the lake levels derived by ImpMWaPP, the in situ gauge data of seven lakes in the Tibetan Plateau are used. Additionally, five existing retrackers are compared to evaluate the performance of the proposed ImpMWaPP retracker. The results reveal that ImpMWaPP can efficiently process the multi-peak waveforms of the Cryosat-2 SARin mode. The root-mean-squared errors (RMSEs) obtained by ImpMWaPP for Qinghai Lake, Nam Co, Zhari Namco, Ngoring Lake, Longyangxia Reservoir, Bamco, and Dawa Co are 0.085 m, 0.093 m, 0.109 m, 0.159 m, 0.573 m, 0.087 m, and 0.122 m, respectively. ImpMWaPP obtains the lowest mean RMSE (0.175 m) over the seven lakes, indicating that it extracts lake levels well during icing and no-ice periods, and is more suitable for lakes frozen in winter.
