

0 引言
土地利用/土地覆盖(land use/land cover, LULC)作为全球变化最重要基础地理信息之一,是人类活动在地球表面最宏观的表现,也是全球环境变迁研究中的核心议题。准确、高分辨率、高频次获取LULC一直是遥感应用的热点领域,对于城市扩展研究、区域规划和人类社会可持续发展具有重要意义[1]。
近年来,机器学习算法凭借其整合有限训练数据、适应复杂区域的优秀性能,被广泛应用于遥感目标识别及专题信息提取领域 [6]。Wu等[7] 利用全球覆盖产品和兴趣点数据,基于RF算法对城市LULC的核心驱动因素进行了研究; Rodriguez-Galiano等[8]研究了RF分类器在复杂区域土地覆盖分类中的应用性能; 武复宇等[9]研究了改进的多级联RF在高光谱影像分类中的性能; Ge等[10]评估了4种机器学习算法在绿洲-沙漠镶嵌景观LULC分类方面的性能; 肖湘文等[11]对比了机器学习算法在北极冰山识别中的精度; 董娟等[12]基于高分辨率影像对比了机器学习算法在珊瑚礁地貌提取中的精度。然而,传统机器学习算法存在单纯依靠原始图像数据的局限性,如何充分利用遥感图像所蕴含的信息提高图像分类精度和信息提取的准确性是值得思考的问题。
为了充分挖掘、利用遥感图像所蕴含的丰富信息,更为准确地获取区域LULC信息,本研究在传统RF方法的基础上,发展了一种融合指数与主成分分量的RF遥感图像分类方法。本研究选择杭州湾为研究区开展验证实验,对比了本文方法与传统RF,CART和SVM这3种机器学习算法,结合高分辨率LULC产品探究了不同机器学习算法在LULC提取方面的性能差异。本研究为LULC信息准确获取提供了支持,对区域规划以及可持续发展具有重要意义。
1 研究区概况与数据源
1.1 研究区概况
杭州湾位于我国浙江省东北部,是钱塘江河口区外海滨部分,湾口南接宁绍平原,北邻上海,东靠舟山群岛,是重要的生态监测区和世界著名的喇叭形潮汐河口[13-14]。该区地势平坦,江河湖泊多,湿地广阔,泥滩资源丰富,属于亚热带海洋性季风气候[15]。作为中国东部经济发展的核心区域,杭州湾是沿海开放带、长江经济带、长江三角洲城市群与“一带一路”等多重国家战略的交汇点,影响超过6 000万人[16]。由于受自然条件和人类活动的影响,随着城市化进程的加快,杭州湾区域地表覆盖类型变换频繁且破碎度高,迫切需要高精度的土地利用分类算法准确获取LULC信息。本文以环杭州湾城市群为研究对象,研究区包括上海市的3个县级行政区和浙江省的9个县级行政区,区域总面积约11 429.80 km2,具体如图1所示。
图1
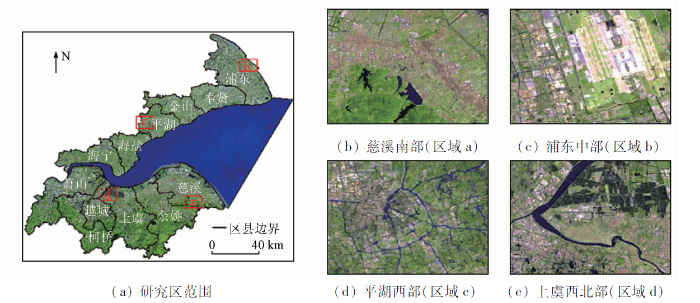
图1
研究区以及局部对比区域
(Landsat8 OLI B7(R),B6(G),B4(B)彩色合成)
Fig.1
Location of study area and local comparison area
1.2 数据获取与处理
2 研究方法
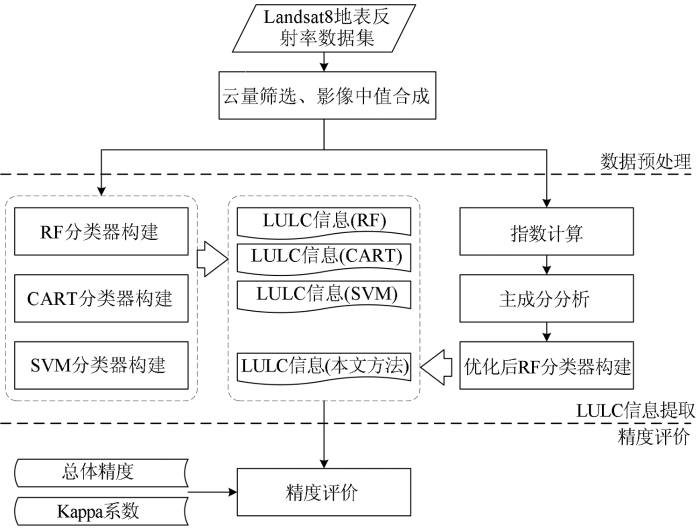
本文发展了融合指数和主成分分量的RF分类算法,基于RF算法开展遥感图像分类研究,提取杭州湾区域LULC信息技术流程如图2所示,主要包括以下步骤: ①选择覆盖研究区的 Landsat 卫星遥感地表反射率数据集(LANDSAT/LC08/C01/T1_SR),进行云量筛选以及影像中值合成,得到年际遥感影像; ②计算归一化植被指数(normalized difference vegetation index, NDVI)、归一化建筑物指数(normalized difference building index, NDBI)和改进归一化差异水体指数(modified normalized difference water index, MNDWI),并通过主成分分析(principal component analysis,PCA)提取主成分分量,将其融入到遥感图像波段堆栈中; ③利用 RF分类器开展土地利用分类研究,识别建设用地、林地、水体、耕地、裸地、滩涂等地物类型,获取研究区的LULC信息; ④基于混淆矩阵,使用总体精度(overall accuracy,OA)和Kappa系数对分类结果进行评估,并与传统RF,CART和SVM结果进行比较。
图2
2.1 数据预处理
2.2 用于分类的机器学习算法
然而,SVM的分类准确性很难用其核函数进行解释,CART学习能力差,易受噪声数据干扰。相比之下,RF凭借其更强的泛化能力和学习能力,在遥感图像的分类领域具有更优的表现性[25]。RF是一种基于决策树集成的机器学习算法。决策树是一种简单、快捷且无参的分类方法,大多数情况下有较高的分类精度,但是当数据过于复杂或存在噪声时,过拟合现象明显[26]。RF分类则是组合多棵决策树对样本的训练结果,最终分类结果由众多决策树投票得到,削弱了过拟合问题,有效提高了分类器的泛化能力[27]。其基本思路如下: 首先,用自助法有放回地随机抽取样本训练集,每次抽取数量约为总量的2/3,剩余1/3用来估计训练内部误差; 然后,为抽取样本集生成各自的分类决策树,合并所有决策树,生成一个分类森林; 最后,综合所有决策树的结果,通过投票策略完成最终分类[27],即
式中: H(x)为组合分类模型; k为建立的决策树模型个数; hi为第i个决策树分类模型; Y为输出变量; I[ ]为示性函数。使用多数投票决策的方式来确定最终的分类结果。
2.3 融合指数与主成分分量的RF分类
RF算法具有高可解释性和可靠性,但由于地物光谱特征同物异谱和异物同谱的复杂性[28],在处理复杂数据时的性能以及分类精度提升方面,RF算法还存在着优化的空间。在传统RF算法的基础上,本研究引入光谱指数与主成分分量,通过组合光谱波段与辅助特征提高分类器的学习能力,这在一定程度上提高了单个决策树的强度,实现LULC信息提取精度的优化。
2.3.1 光谱指数
NDVI,NDBI和MNDWI对植被、建设用地和水体具有良好的表现性。将计算后的指数输入分类影像堆栈中,实现多参数辅助类别决策,提高分类准确性。指数计算公式分别为:
式中 NIR,RED,GREEN和SWIR 分别为近红外波段、红光波段、绿光波段和短波红外波段反射率。
2.3.2 主成分分量
融合多特征的方法可以极大地丰富遥感数据的信息内容[29],原本在一种特征空间很难区分的2种地物可能在另一特征空间上被分开,但过多的图像信息堆叠会造成信息冗余,降低分类效率及精度,不利于遥感数据的有效利用[30]。本文运用PCA对影像信息进行凝练。PCA是一种通用的降维和数据分析工具,主要用于机器学习和数据挖掘等重要研究领域[31]。PCA的本质是通过线性变换将高维空间中的数据样本投影到低维空间中,同时尽可能保留原始数据特征。运用PCA对影像进行处理能够实现特性信息的压缩和图像纹理的增强[31-32]。图像经PCA处理后,前3个主成分分量包括了超过95%的影像信息,本文将前3个主成分分量添加到分类影像堆栈中并应用于RF分类器的学习,并以PCA影像图为底图进行训练样本点的采集,更好地消除特征向量中各特征之间的相关性,增强RF分类器中单个决策树的强度,实现分类精度的提升。
2.3.3 分类方案与样本点
考虑Landsat数据的空间分辨率,参照《全国遥感监测土地利用/覆盖分类体系》并结合湾区地物分布特征,本文将研究区分类体系确定为6类: 建设用地、林地、水体、耕地、裸地、滩涂,具体方案如表1所示。
表1 分类方案、样本点及图像特征
Tab.1
| 类别 | 定义 | 样本 点/个 | 遥感图像特征 (标准假彩色合成) |
|---|---|---|---|
| 建设用地 | 城乡居民点及工矿交通等用地 | 210 |  |
| 林地 | 树木、灌木和其他林地 | 220 |  |
| 水体 | 自然陆地水域、水利设施用地和养殖池塘 | 130 | 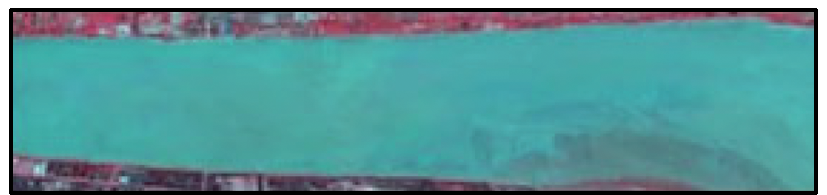 |
| 耕地 | 长年可正常耕作的农田 | 250 | 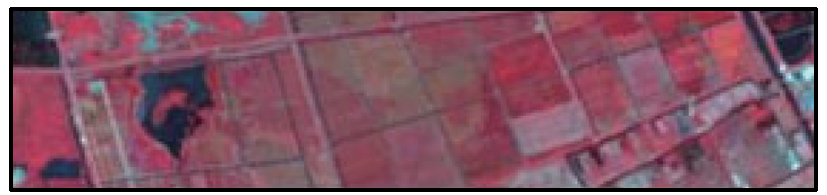 |
| 裸地 | 地表为土壤或岩石,土地基本不被植被覆盖 | 100 | 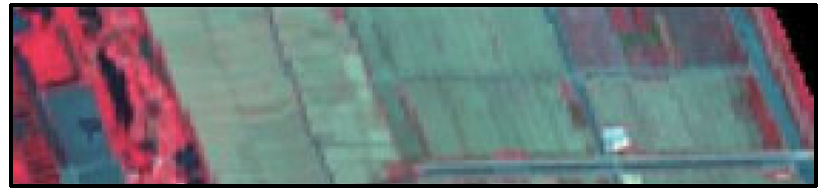 |
| 滩涂 | 海高低潮位之间的潮汐淹没区 | 100 | 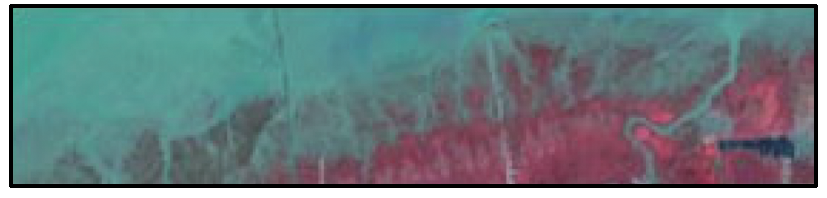 |
2.4 精度评价
式中: Pc为正确分类的像元数; Pn为像元总数; r 为误差矩阵中的行数和列数; xii 为第i行第i列的观测值数; xi+ 为第i 行的边际总和; x+i 为第i 列的边际总和; N 为观察总数。
3 结果与分析
3.1 土地利用分类及精度评价
在GEE云平台的支持下,使用RF,CART,SVM和本文方法4种机器学习算法提取了2020年杭州湾地区LULC信息,分类结果如图3所示。
图3
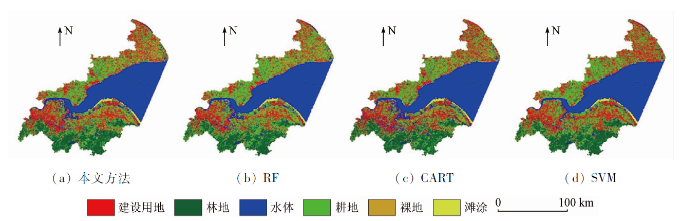
表2 4种机器学习算法分类精度对比
Tab.2
| 类别 | 本文方法 | RF | CART | SVM |
|---|---|---|---|---|
| OA/% | 91.42 | 88.78 | 83.17 | 77.23 |
| Kappa系数 | 0.894 2 | 0.861 5 | 0.792 6 | 0.716 1 |
3.2 分类结果对比
表3 4种分类方法各类别面积统计
Tab.3
| 类别 | 建设用地 | 林地 | 水体 | 耕地 | 裸地 | 滩涂 |
|---|---|---|---|---|---|---|
| ESA | 2 851.35 | 2 884.21 | 605.99 | 3 812.34 | 1 274.23 | 141.40 |
| 本文方法 | 2 984.76 | 1 881.52 | 680.21 | 4 800.59 | 1 078.13 | 161.50 |
| RF | 2 545.11 | 1 776.72 | 675.00 | 5 398.44 | 1 029.98 | 166.13 |
| CART | 2 964.11 | 1 803.62 | 1 216.39 | 4 594.25 | 848.88 | 174.46 |
| SVM | 3 507.76 | 1 939.85 | 438.10 | 5 539.48 | 1.68 | 163.52 |
图4
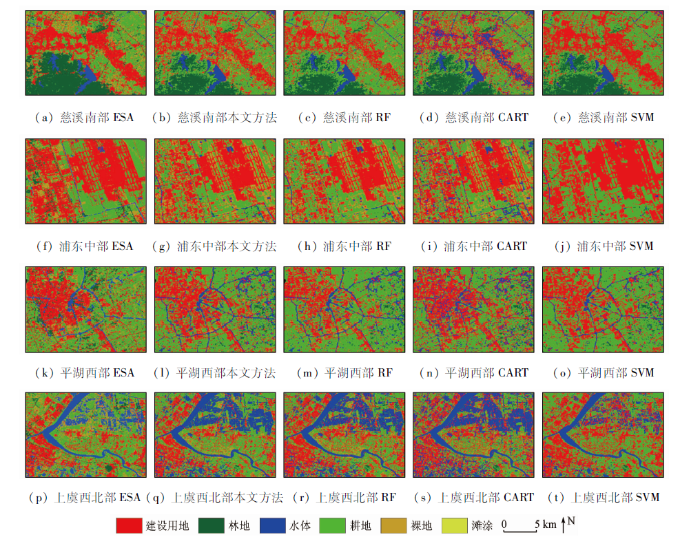
根据表3和图4并结合ESA 10 m分辨率土地覆盖产品分析后发现,在慈溪南部,RF,CART,SVM和本文方法能够较好区分建设用地与耕地、林地与耕地,但在建设用地与水体之间,CART发生了错分,基于CART的杭州湾水体面积为1 216.39 km2,远高于ESA(605.99 km2),本文方法(680.21 km2),RF(675.00 km2)和SVM(438.10 km2),这在一定程度上降低了CART分类的OA以及一致性。 在浦东中部,SVM难以区分建设用地与裸地,基于SVM的杭州湾裸地面积仅有1.68 km2,远低于ESA(1 274.23 km2),本文方法(1 078.13 km2),RF(1 029.98 km2)和CART(848.88 km2)。在这方面,本文方法与RF表现出较好的分离性,精度高于CART,且本文方法对于部分地物边界的分类更为准确,与ESA土地覆盖产品吻合度更高。在平湖西部区分建设用地与水体混合的城区时,CART表现出较差的效果,城区出现破碎水体,河道也大部分错分为建设用地。RF,SVM和本文方法对细小水体分类效果较好。 在上虞西北部,本文方法能够更好区分杭州湾水田与耕地,在建设用地与水体、耕地与水体之间的错分低于RF,CART和SVM。
综上可知,植被指数、水体指数、建筑物指数等指数特征与主成分分量的辅助决策在一定程度上提高了遥感图像分类的准确性,本文方法能够获取较为准确的LULC信息。
4 结论与讨论
为了提高机器学习分类精度,本研究发展了一种融合指数与主成分分量的RF遥感图像分类方法,选取杭州湾为研究区,结合ESA高分辨率LULC产品与RF,CART和SVM 3种机器学习算法进行了对比,探究了不同机器学习算法在海湾地区LULC信息提取方面的性能差异。主要结论如下:
1)发展了融合指数和主成分分量的RF遥感图像分类方法,OA和Kappa系数分别为91.42%和0.894 2,分类精度较高,分类结果较为准确。
2)植被指数、水体指数、建筑物指数等指数特征与主成分分量的辅助决策提高了分类的准确性。4种分类方法在建设用地与耕地、林地与耕地间的信息提取中都有较高的分离度。本文方法在建设用地与裸地、建设用地与水体、耕地与水体间的信息提取中具有更优于RF,CART和SVM的分离度。
遥感指数和主成分分量的添加在一定程度上提高了分类准确度,但由于混合像素、地物光谱特征复杂性的影响,在30 m空间分辨率的Landsat影像中部分建设用地与裸地、林地与耕地的边界依旧较难区分,这在一定程度上影响了训练样本的准确性,从而导致错分现象的发生。验证本文方法在其他空间分辨率遥感图像上的适用性,融合更多遥感特征优化算法将是下一步的研究内容。
参考文献
Monitoring land use/cover change using remote sensing and GIS techniques:A case study of Hawalbagh Block,District Almora,Uttarakhand,India
[J].DOI:10.1016/j.ejrs.2015.02.002 URL [本文引用: 1]
The classification method study of crops remote sensing with deep learning,machine learning,and Google Earth Engine
[J].
DOI:10.3390/rs14122758
URL
[本文引用: 1]

The extraction and classification of crops is the core issue of agricultural remote sensing. The precise classification of crop types is of great significance to the monitoring and evaluation of crops planting area, growth, and yield. Based on the Google Earth Engine and Google Colab cloud platform, this study takes the typical agricultural oasis area of Xiangride Town, Qinghai Province, as an example. It compares traditional machine learning (random forest, RF), object-oriented classification (object-oriented, OO), and deep neural networks (DNN), which proposes a random forest combined with deep neural network (RF+DNN) classification framework. In this study, the spatial characteristics of band information, vegetation index, and polarization of main crops in the study area were constructed using Sentinel-1 and Sentinel-2 data. The temporal characteristics of crops phenology and growth state were analyzed using the curve curvature method, and the data were screened in time and space. By comparing and analyzing the accuracy of the four classification methods, the advantages of RF+DNN model and its application value in crops classification were illustrated. The results showed that for the crops in the study area during the period of good growth and development, a better crop classification result could be obtained using RF+DNN classification method, whose model accuracy, training, and predict time spent were better than that of using DNN alone. The overall accuracy and Kappa coefficient of classification were 0.98 and 0.97, respectively. It is also higher than the classification accuracy of random forest (OA = 0.87, Kappa = 0.82), object oriented (OA = 0.78, Kappa = 0.70) and deep neural network (OA = 0.93, Kappa = 0.90). The scalable and simple classification method proposed in this paper gives full play to the advantages of cloud platform in data and operation, and the traditional machine learning combined with deep learning can effectively improve the classification accuracy. Timely and accurate extraction of crop types at different spatial and temporal scales is of great significance for crops pattern change, crops yield estimation, and crops safety warning.
条件随机场框架下基于随机森林的城市土地利用/覆盖遥感分类
[J].
Urban land use/cover remote sensing classification based on random forest under conditional random field framework
[J].
基于支持向量机的土地利用变化模拟模型
[J].
Simulation model of land use change based on support vector machine
[J].
基于决策树方法的海岛土地利用分类研究
[J].
Research on island land use classification based on decision tree method
[J].
Comparing thresholding with machine learning classifiers for mapping complex water
[J].
DOI:10.3390/rs11111351
URL
[本文引用: 1]
Small reservoirs play an important role in mining, industries, and agriculture, but storage levels or stage changes are very dynamic. Accurate and up-to-date maps of surface water storage and distribution are invaluable for informing decisions relating to water security, flood monitoring, and water resources management. Satellite remote sensing is an effective way of monitoring the dynamics of surface waterbodies over large areas. The European Space Agency (ESA) has recently launched constellations of Sentinel-1 (S1) and Sentinel-2 (S2) satellites carrying C-band synthetic aperture radar (SAR) and a multispectral imaging radiometer, respectively. The constellations improve global coverage of remotely sensed imagery and enable the development of near real-time operational products. This unprecedented data availability leads to an urgent need for the application of fully automatic, feasible, and accurate retrieval methods for mapping and monitoring waterbodies. The mapping of waterbodies can take advantage of the synthesis of SAR and multispectral remote sensing data in order to increase classification accuracy. This study compares automatic thresholding to machine learning, when applied to delineate waterbodies with diverse spectral and spatial characteristics. Automatic thresholding was applied to near-concurrent normalized difference water index (NDWI) (generated from S2 optical imagery) and VH backscatter features (generated from S1 SAR data). Machine learning was applied to a comprehensive set of features derived from S1 and S2 data. During our field surveys, we observed that the waterbodies visited had different sizes and varying levels of turbidity, sedimentation, and eutrophication. Five machine learning algorithms (MLAs), namely decision tree (DT), k-nearest neighbour (k-NN), random forest (RF), and two implementations of the support vector machine (SVM) were considered. Several experiments were carried out to better understand the complexities involved in mapping spectrally and spatially complex waterbodies. It was found that the combination of multispectral indices with SAR data is highly beneficial for classifying complex waterbodies and that the proposed thresholding approach classified waterbodies with an overall classification accuracy of 89.3%. However, the varying concentrations of suspended sediments (turbidity), dissolved particles, and aquatic plants negatively affected the classification accuracies of the proposed method, whereas the MLAs (SVM in particular) were less sensitive to such variations. The main disadvantage of using MLAs for operational waterbody mapping is the requirement for suitable training samples, representing both water and non-water land covers. The dynamic nature of reservoirs (many reservoirs are depleted at least once a year) makes the re-use of training data unfeasible. The study found that aggregating (combining) the thresholding results of two SAR and multispectral features, namely the S1 VH polarisation and the S2 NDWI, respectively, provided better overall accuracies than when thresholding was applied to any of the individual features considered. The accuracies of this dual thresholding technique were comparable to those of machine learning and may thus offer a viable solution for automatic mapping of waterbodies.
Identifying core driving factors of urban land use change from global land cover products and POI data using the random forest method
[J].DOI:10.1016/j.jag.2021.102475 URL [本文引用: 1]
An assessment of the effectiveness of a random forest classifier for land-cover classification
[J].DOI:10.1016/j.isprsjprs.2011.11.002 URL [本文引用: 1]
基于改进的多级联随机森林网络高光谱遥感影像分类
[J].
Hyperspectral remote sensing image classification based on improved multi-cascade random forest network
[J].
Land use/cover classification in an arid desert-oasis mosaic landscape of China using remote sensed imagery:Performance assessment of four machine learning algorithms
[J].DOI:10.1016/j.gecco.2020.e00971 URL [本文引用: 1]
基于Sentinel-1A数据的多种机器学习算法识别冰山的比较
[J].
DOI:10.11947/j.AGCS.2020.20190174
[本文引用: 1]
冰山识别对于海洋环境监测和船只安全运行等具有重要的意义,是北极航道开通和北极开发过程中的重要内容。采用合成孔径雷达(SAR)影像进行冰山识别具有独特的优势,多种机器学习算法均可用于SAR影像的冰山识别中。为了最大限度地发挥机器学习算法的性能,有必要对不同机器学习算法及其搭配使用的特征与特征标准化方法进行评估,从而进行最优冰山识别方法的选择。因此,本文基于Sentinel-1A SAR影像,采用多种机器学习方法、多种特征组合及多种特征标准化方法进行冰山识别,并比较各流程方法的识别性能差异。采用的机器学习算法包括贝叶斯分类器(Bayes)、反向神经网络(BPNN)、线性判别分析(LDA)、随机森林(RF)以及支持向量机(SVM);特征标准化方法包括Min-max标准化、Z-score标准化及log函数标准化;数据集是含有12个SAR影像特征的969个冰山与非冰山样本,样本主要位于格陵兰岛东海岸。分类效果采用接收者操作特性(ROC)曲线下的面积(AUC)进行衡量。结果显示,最佳搭配下的RF的AUC值最高,达到了0.945,比最差的Bayes高出0.09。从识别率上来看,RF在冰山查全率为80%的情况下非冰山查全率达到92.6%,效果最好,比第2位的BPNN高出1.4%,比最差的Bayes高出2.6%;BPNN在冰山查全率为90%的情况下非冰山查全率达到87.4%,比第2位的RF高出0.8%,比最差的Bayes高出2.7%。上述结果表明,对冰山识别而言,选择最优的机器学习算法和最佳的特征与特征标准化方法都是十分重要的。
Comparison of multiple machine learning algorithms based on Sentinel-1A data to identify icebergs
[J].
基于高分辨率遥感的珊瑚礁地貌单元体系构建和分类方法——以8波段Worldview-2影像为例
[J].
DOI:10.11978/2019100
[本文引用: 1]
珊瑚礁生态系统是全球初级生产力最高的生态系统之一, 在维持海洋生物多样性、防浪固滩、资源供给等方面发挥着巨大作用。珊瑚礁遥感地貌分类体系是珊瑚礁保护、管理及可持续发展的必要基础, 但目前还未有结合珊瑚覆盖度进行分类的体系。本文基于WorldView-2高分辨率遥感影像, 以中国南海西沙群岛七连屿北部赵述岛和西沙洲所在礁盘作为研究区, 结合珊瑚覆盖度、区域地貌成分和水动力条件等指标, 建立了既适用于遥感监测又与珊瑚生存状况相关联的珊瑚礁地貌单元分类体系。同时, 利用面向对象的支持向量机(Support Vector Machine, SVM)和随机森林(Random Forest, RF)分类方法进行珊瑚礁地貌单元的信息提取, 并对分类结果进行精度评价。结果表明, SVM和RF两种分类方法均能较好地提取出珊瑚礁地貌单元, 分类精度分别为87.59%和79.81%。针对分类过程中出现的错分、漏分问题, 结合珊瑚礁成因和分布规律对分类结果进行修正, 修正后分类提取的精度达到91.3%, Kappa系数为0.9041, 表明本文构建的珊瑚礁地貌单元分类体系在一定程度上能满足当前珊瑚岛礁信息提取的需要。
Construction and classification of coral reef geomorphological unit system based on high-resolution remote sensing: Taking 8-band Worldview-2 image as an example
[J].
面向对象方法和多源遥感数据的杭州湾海岸线提取分析
[J].
DOI:10.3724/SP.J.1047.2013.00262
[本文引用: 1]
本文以1983-2011 年的多源遥感数据为基础, 利用GIS 空间分析和地图代数功能, 提取杭州湾海岸线, 分析了其变迁的位置、长度, 以及增加和减少的陆地面积。结果表明:受到自然和人为因素的影响, 杭州湾南北两岸的海岸线变迁规律不同。杭州湾北岸1983-1993 年共有60.2km的海岸线向陆迁移, 最大迁移距离0.6km, 减少的陆地面积共为23.5km<sup>2</sup>。1993-2011 年由于围垦和工业填海北岸向海迁移。其中,1993-2002 年最大迁移距离3.6km, 新增陆地面积42.5km<sup>2</sup>, 2002-2011 年最大迁移距离2.9km, 新增陆地面积61.0km<sup>2</sup>。由于淤积和围垦, 杭州湾南岸海岸线不断向海迁移, 1983-1993 年、1993-2002 年和2002-2011 年向海迁移最大距离分别是1.8km、2.7km和5.1km, 新增陆地面积分别为34.3km<sup>2</sup>、230.2km<sup>2</sup>及331.7km<sup>2</sup>。海岸线向海迁移的速度越来越快, 规模越来越大。研究成果对于地图制图、滨海湿地生态资源管理, 以及海岸线保护具有十分重要的意义。
Coastline extraction and analysis of Hangzhou Bay based on object-oriented method and multi-source remote sensing data
[J].DOI:10.3724/SP.J.1047.2013.001262 URL [本文引用: 1]
Examining land cover and greenness dynamics in Hangzhou Bay in 1985—2016 using Landsat time-series data
[J].DOI:10.3390/rs10010032 URL [本文引用: 1]
Long-term spatiotemporal changes in ecosystem services caused by coastal wetland type transformation in China’s Hangzhou Bay
[J].
DOI:10.3390/jmse10111781
URL
[本文引用: 1]
Coastal wetlands provide essential ecosystem services, while usually experiencing land transformation or degradation mainly due to intense anthropogenic activities and climate changes. Understanding the changes in wetlands ecosystem services is essential to decision makers for generating sound coastal planning. Hangzhou Bay is rich in wetland resources, and the urbanization of Hangzhou Bay in the past three decades has caused fundamental changes in the wetlands in the region. Based on the remote sensing images of the Hangzhou Bay area from 1990 to 2020, this paper analyzes the land use situation of the Hangzhou Bay area in seven periods. This paper calculates the area transfer matrix of various types of wetlands. It uses the InVEST model to evaluate the changes in the function of wetland ecosystem services in the Hangzhou Bay area. Hangzhou Bay wetlands show a trend of transferring natural wetlands to artificial and non-wetlands from 1990 to 2020. Carbon stocks fell by 14.24%. The annual water production decreased by 33.93% and then returned to the original level. The area of habitat degradation increased by 79.94%. The main influencing factors are paddy field degradation, increase in non-wetland area, and decrease in sea area. This paper proposes that the development and construction of farmland in the “red line” area and established wetland reserves are prohibited, and to strengthen the training of wetland management personnel, establish a sound decision-making consultation mechanism, and increase the scientific research expenditure on wetlands in the region.
围填海影响下东海区主要海湾形态时空演变
[J].
DOI:10.11821/dlxb202001010
[本文引用: 1]
围填海影响下海湾形态变化能够深刻反映人类活动对海湾自然环境的影响程度,分析海湾形态变化对合理高效地利用与保护海湾资源具有重要意义。研究以东海区12个主要海湾(包括陆域与水域)为研究区,基于20世纪90年代以来6个时期的Landsat TM/OLI遥感影像数据,通过海湾岸线与湾面形态分析东海区主要海湾的变化特征,探讨围填海强度与海湾形态变化之间的相关性。主要结论为:① 1990—2015年,东海区主要海湾岸线总长度共波动增长66.65 km,2005—2010年间海湾开发最活跃,阶段内岸线增长量达38 km。岸线长度三沙湾最大(439 km),泉州湾最小(105 km);兴化湾增长最多(54.53 km),罗源湾缩短最多(25.75 km)。自然岸线与人工岸线长度此消彼长,岸线人工化程度不断加强,东海北部海湾岸线总长度大于南部海湾。② 1990—2015年,东海区海湾岸线共向海推进26.93 km,合1.08 km/a,在1995—2000年及2005—2010年间推进最多,分别达7.10 km和 6.00 km,在1990—1995年间推进量最小,为2.97 km。杭州湾(4.93 km)和兴化湾(4.15 km)岸线向海推进距离最长,厦门湾推进(0.55 km)最短;东海南部海湾岸线迁移量平缓,北部海湾则更为剧烈,是东海区岸线迁移变化的主体。③ 1990—2015年间东海区主要海湾水域总面积由初期的13.85 km2减少至12.29 km2,累积减少11.23 %,海湾形状不断向复杂化演变。其中杭州湾海湾水域面积减少量最多,达到0.726 km2,占研究区的46.69 %。空间上,北部海湾水域面积减少量更大,而南部海湾水域面积减小速率更快。④ 1990年以来,东海区主要海湾人工化指数平均值和岸线开发强度指数均有所上涨,21世纪以来的开发利用度显著提高。南部(闽)海湾的开发利用程度较北部(浙沪)更为深入,北部海湾开发强度的年际波动差异更大。海湾开发强度与海湾岸线长度、人工岸线长度、海湾形态指数呈正相关关系,与自然岸线长度、海湾水域面积呈负相关关系。当海湾开发强度增加时,同时段内海湾围填海活动的强度也显著增加。
Spatial and temporal evolutions of the major bays in the East China Sea under the influence of reclamation
[J].
DOI:10.11821/dlxb202001010
[本文引用: 1]
The spatial pattern changes of bays under the influence of reclamation can profoundly reflect how human activities affect the natural environments, which is important to effectively protect and utilize bay resources. Based on 6 Landsat TM/OLI remote sensing images during 1990-2015, this study analyzed the variations of major bays from the coastline and bay surface morphology and explored the correlation between the reclamation intensity and spatial pattern changes for the 12 major bays in the East China Sea (ECS). The main conclusions include that: (1) the length of the main bay coastline in the East China Sea, from 1990 to 2015, increased by 66.65 km. The extensive coastline growth was found during 2005-2010 and the growth reached 38 km. Sansha Bay has the longest coastline (439 km) and the shortest (105 km) was found in Luoyuan Bay; Xinghua Bay experienced the largest coastline growth (54.53 km) in the past decades, and the least was in Luoyuan Bay (25.75 km). In general, the artificial coastline continued to increase and the degree of artificialization had been continuously strengthened. (2) The coastline of the bay continuously moved to the sea, with a distance of 26.93 km (1.08 km/a). The most significant seaward expansions were found in 1995-2000 and 2005-2010, reaching 7.10 km and 6.00 km, respectively. Hangzhou (4.93 km) and Xinghua bays (4.15 km) experienced the largest seaward expansion of coastline, while Xiamen Bay had the shortest (0.55 km). (3) The total area of the major bay waters decreased from 13.85 km2 in 1990 to 12.29 km2 in 2015 in the East China Sea, down by 11.23%. Additionally, the morphological indices of the bays showed a continuous rise trend, which indicates that spatial patterns were transformed to be more complicated. The largest reduction with water area was observed in the Hangzhou Bay (0.726 km2), accounting for 46.69% of the research area. (4) The indexes of artificiality and development intensity showed a continuous rise trend. The utilization degree in the southern part of the study area is higher than that of the northern part, and the interannual fluctuation of the development intensity in the north is much varied. In addition, the bay development is positively correlated with the length of the coastline, the length of the artificial coastline and the shape index of the bay, and negatively correlated with the length of the natural coastline and the area of the waters. As the development intensity increased, the intensity of reclamation activities increased significantly.
Changes of the spatial and temporal characteristics of land-use landscape patterns using multi-temporal Landsat satellite data:A case study of Zhoushan Island,China
[J].DOI:10.1016/j.ocecoaman.2021.105842 URL [本文引用: 1]
Dynamic monitoring and analysis of land-use and land-cover change using Landsat multitemporal data in the Zhoushan Archipelago,China
[J].DOI:10.1109/Access.6287639 URL [本文引用: 1]
全球2000—2015年30 m分辨率逐年土地覆盖制图
[J].
Mapping annual global land cover changes at a 30 m resolution from 2000 to 2015
[J].
基于GEE数据平台的北洛河流域1970—2019年土地利用结构变化特征
[J].
Characteristics of land use structure change in Beiluo River basin during 1970—2019 based on Google Earth Engine
[J].
一种基于Google Earth Engine云平台的潮间带遥感信息提取方法
[J].
A method for extracting intertidal remote sensing information based on Google Earth Engine cloud platform
[J].
Long-term surface water dynamics analysis based on Landsat imagery and the Google Earth Engine platform:A case study in the middle Yangtze River basin
[J].
DOI:10.3390/rs10101635
URL
[本文引用: 1]
Dynamics of surface water is of great significance to understand the impacts of global changes and human activities on water resources. Remote sensing provides many advantages in monitoring surface water; however, in large scale, the efficiency of traditional remote sensing methods is extremely low because these methods consume a high amount of manpower, storage, and computing resources. In this paper, we propose a new method for quickly determining what the annual maximal and minimal surface water extent is. The maximal and minimal water extent in the year of 1990, 2000, 2010 and 2017 in the Middle Yangtze River Basin in China were calculated on the Google Earth Engine platform. This approach takes full advantage of the data and computing advantages of the Google Earth Engine’s cloud platform, processed 2343 scenes of Landsat images. Firstly, based on the estimated value of cloud cover for each pixel, the high cloud covered pixels were removed to eliminate the cloud interference and improve the calculation efficiency. Secondly, the annual greenest and wettest images were mosaiced based on vegetation index and surface water index, then the minimum and maximum surface water extents were obtained by the Random Forest Classification. Results showed that (1) the yearly minimal surface water extents were 14,751.23 km2, 14,403.48 km2, 13,601.48 km2, and 15,697.42 km2, in the year of 1990, 2000, 2010, and 2017, respectively. (2) The yearly maximal surface water extents were 18,174.76 km2, 20,671.83 km2, 19,097.73 km2, and 18,235.95 km2, in the year of 1990, 2000, 2010, and 2017, respectively. (3) The accuracies of surface water classification ranged from 86% to 93%. Additionally, the causes of these changes were analyzed. The accuracy evaluation and comparison with other research results show that this method is reliable, novel, and fast in terms of calculating the maximal and minimal surface water extent. In addition, the proposed method can easily be implemented in other regions worldwide.
Performance evaluation of machine learning algorithms using optical and microwave data for LULC classification
[J].DOI:10.1016/j.rsase.2021.100599 URL [本文引用: 1]
Understanding land use/land cover dynamics and impacts of human activities in the Mekong Delta over the last 40 years
[J].DOI:10.1016/j.gecco.2020.e00991 URL [本文引用: 1]
Random forest classifier for remote sensing classification
[J].DOI:10.1080/01431160412331269698 URL [本文引用: 1]
Random forests for classification in ecology
[J].
DOI:10.1890/07-0539.1
PMID:18051647
[本文引用: 1]
Classification procedures are some of the most widely used statistical methods in ecology. Random forests (RF) is a new and powerful statistical classifier that is well established in other disciplines but is relatively unknown in ecology. Advantages of RF compared to other statistical classifiers include (1) very high classification accuracy; (2) a novel method of determining variable importance; (3) ability to model complex interactions among predictor variables; (4) flexibility to perform several types of statistical data analysis, including regression, classification, survival analysis, and unsupervised learning; and (5) an algorithm for imputing missing values. We compared the accuracies of RF and four other commonly used statistical classifiers using data on invasive plant species presence in Lava Beds National Monument, California, USA, rare lichen species presence in the Pacific Northwest, USA, and nest sites for cavity nesting birds in the Uinta Mountains, Utah, USA. We observed high classification accuracy in all applications as measured by cross-validation and, in the case of the lichen data, by independent test data, when comparing RF to other common classification methods. We also observed that the variables that RF identified as most important for classifying invasive plant species coincided with expectations based on the literature.
Random forests
[J].DOI:10.1023/A:1010933404324 URL [本文引用: 2]
面向灾后水体遥感信息提取的知识决策树构建及应用
[J].
Construction and application of knowledge decision tree after a disaster for water body information extraction from remote sensing images
[J].
Sentinel-2影像多特征优选的黄河三角洲湿地信息提取
[J].
Wetland mapping of Yellow River Delta wetlands based on multi-feature optimization of Sentinel-2 images
[J].
Remote sensing image classification based on the optimal support vector machine and modified binary coded ant colony optimization algorithm
[J].DOI:10.1016/j.ins.2017.03.027 URL [本文引用: 1]
Principal component analysis
[J].DOI:10.1002/wics.101 URL [本文引用: 2]
What is principal component analysis?
[J].
舟山群岛海岸线遥感信息提取及时空演变分析
[J].
Coastline extraction and spatial-temporal variations using remote sensing technology in Zhoushan Islands
[J].
