

0 引言
目前,监测生态环境质量的研究方法主要有生态环境状况指数(eco-environment index,EI)与遥感生态指数(remote sensing environment index,RSEI)。前者统计数据较难获取,生态指标权重的赋予较为主观[4],后者计算较为简单,数据源获取更为容易,能够客观反映研究区域生态环境质量[5]。因此,RSEI在多种场景中得到了广泛的应用[6⇓⇓⇓-10]。学者们根据研究区域的地理环境变化,如: 城市、乡村、森林、湿地、海岛、沙漠、黄土地、矿区等,提出修正的遥感生态指数(modified remote sensing ecological index,MRSEI) 、改进遥感生态指数(improved remote sensing ecological index,IRSEI)及增强遥感生态指数(enhanced remote sensing ecological index,ERSEI)等适应不同地理环境的改进版RSEI模型[11⇓⇓⇓⇓⇓-17]。但是,目前国内外鲜有针对海岸带区域的IRSEI模型。由于不同地理环境的生态特性具有明显差异,海岸带位于海陆系统交界处,具有其自身的独特性[18]。因此,本研究根据自身的生态特性,构建IRSEI。从而准确、全面地评估湛江市生态环境质量。
利用谷歌地球云平台(Google Earth Engine,GEE),获取2000年、2005年、2009年、2015年和2020年的Landsat遥感影像。根据湛江市地理环境,构建适宜湛江市生态格局评估的IRSEI,即在绿度、湿度、干度和热度4个经典指标的基础上,引入土地利用指标(land use index,LUI)、人口分布(population,POP)指标。利用ENVI 5.3和ArcGIS 10.8平台对湛江市生态环境质量进行定量分析与监测。
1 研究区概况与数据源
1.1 研究区概况
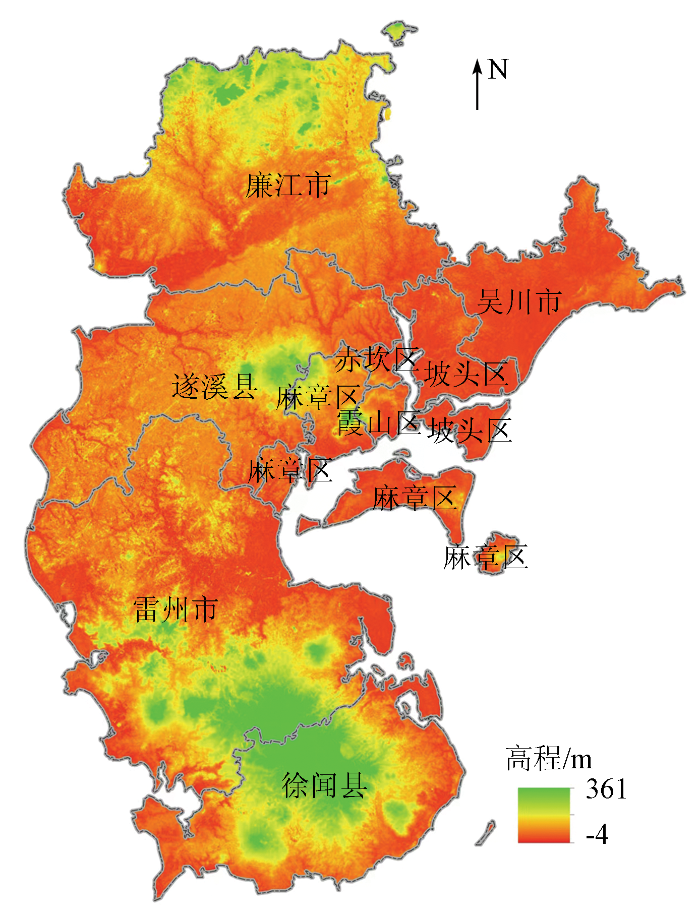
以湛江市为研究区,其地理坐标为N20°13'~21°57',E109°40'~110°58'之间,区域整体呈狭长型,陆地大部分由半岛和岛屿组成,其中东海岛为中国第五大岛屿。海岸线长达1 556 km,市区所辖面积约13 225 km2。西临北部湾,东与茂名市相连,南滨邻南海。其位于广西、广东与海南三省区交汇处。共辖4个区、3个县级市和2个县(图1)。该地区为热带北缘季风气候,主要受海洋气候的调节,年平均气温在22.7~23.5 ℃,10月—次年3月为干季,4—9月为湿季。湛江市地形主要为平原,较少部分滨海区域为台地。地势大致为东西两侧低而南北高,坡度为1°~4°,较为平缓。湛江市存在大面积的滩涂湿地,同时拥有中国红树林分布最集中、种类最多、面积最大的红树林湿地自然保护区,总面积约20 278.8 km2[19]。
图1
1.2 数据源及其预处理
湛江市遥感影像由于云层影响质量较差,因此,需要将多景影像进行去云/云影之后再进行拼接以获取完整覆盖研究区的无云影像。本文基于GEE平台,获取湛江市范围2000年5月—2009年9月的Landsat5和2015年5月—2020年9月的Landsat8地表反射率数据集。并进行最小云量影像合成,去除有云/云影像元,以无云像元合成目标年份影像。具体数据来源如表1所示。
表1 数据来源
Tab.1
2 研究方法
根据研究区海岸带的地理环境特点,在经典RSEI的4个指标基础上,增加了LUI和POP。构建基于6个指标的IRSEI模型对湛江市生态环境质量进行评估与分析。技术路线如图2所示。
图2

2.1 绿度指标
选取归一化差异植被指数(normalized difference vegetation index, NDVI)作为绿度指标,用于定量地反映植被生长状况、植被覆盖度及生物量等信息[22],是生态环境质量变化研究中的重要指标。其计算公式为:
式中: Landsat5遥感数据中
2.2 湿度指标
式中: WETTM为Landsat5遥感卫星的湿度指标; WETOLI为Landsat8遥感卫星的湿度指标;
2.3 热度指标
选取地表温度(land surface temperature, LST)代表热度指标,通过Landsat遥感数据的热红外波段的辐射值和最新修订的定标参数[25],本研究选用的计算公式为:
式中:
2.4 干度指标
选用土壤指数(soil index,SI)和建筑物指数(index-based built-up index,IBI)组合代表干度指标
2.5 LUI
2.6 POP
POP(人/km2×100)反映人类活动对生态环境质量变化的影响。POP指在一定时间内人口数量在该区域的空间分布状况。其计算公式为:
式中Q为0.01 km2内的人口数量。湛江市近20 a间人口数量增长迅速,人口空间分布数量从某种程度上反映出人类活动对生态环境质量的影响。因此,本研究将POP作为IRSEI评价中的一个因子。
2.7 IRSEI
本研究采用主成分分析(principal component analysis,PCA)法构建IRSEI。此方法将6项单一指标耦合成一项综合指数,把主要信息集中到第一主成分分量(PC1)上,使得IRSEI能够综合6项指标信息。采用PCA法的优点就是指标权重较为客观,避免因人而异、因方法而异的权重设定造成的结果偏差。
由于6个指标的量纲不统一,因此,在PCA之前,必须对6个指标分别进行归一化处理[29],计算公式为:
式中: PN为归一化后的指标值;
对指标进行PCA之前,采用改进的归一化水体指数(modified normalized difference water index,MNDWI)对湛江市水体进行掩模处理[22],避免因水体对WET分量权重造成影响,进而影响PCA的载荷值分布。将6个指标叠加合成为一幅新图层,然后对新图层进行PCA,得到PC1值。
为使生态环境越好PC1值越大,用1减去 P
为了便于指标间的比较和度量,同样对IRSEI0进行归一化处理,即
式中
参照相关技术规定[22],将归一化处理后的5期IRSEI进行分级处理与差值分析。
3 结果与分析
3.1 各年份生态指数分析
3.1.1 各年份生态指数PCA
各年份各指标PCA结果如表2所示。
表2 各年份各指标PCA结果
Tab.2
| 年份 | 主成分分量 | NDVI | WET | NDBSI | LST | LUI | POP | 特征值 | 特征值贡献率 |
|---|---|---|---|---|---|---|---|---|---|
| 2000年 | PC1 | 0.530 | 0.229 | -0.204 | -0.777 | -0.002 | -0.149 | 0.517 2 | 0.887 |
| PC2 | -0.472 | -0.096 | 0.131 | -0.224 | 0.007 | -0.837 | 0.049 0 | 0.084 | |
| PC3 | -0.544 | -0.137 | -0.729 | -0.274 | -0.006 | 0.281 | 0.010 2 | 0.017 | |
| 2005年 | PC1 | 0.495 | 0.232 | -0.225 | -0.795 | -0.001 | -0.136 | 0.571 6 | 0.895 |
| PC2 | -0.573 | -0.109 | 0.127 | -0.297 | 0.005 | -0.745 | 0.049 1 | 0.077 | |
| PC3 | -0.520 | -0.118 | -0.723 | -0.219 | -0.006 | 0.381 | 0.010 8 | 0.017 | |
| 2009年 | PC1 | 0.517 | 0.241 | -0.074 | -0.171 | -0.580 | -0.551 | 0.551 4 | 0.868 |
| PC2 | 0.463 | 0.130 | 0.387 | 0.113 | 0.298 | 0.719 | 0.061 6 | 0.097 | |
| PC3 | 0.528 | 0.217 | -0.536 | -0.255 | -0.540 | 0.173 | 0.011 0 | 0.017 | |
| 2015年 | PC1 | 0.444 | 0.327 | -0.250 | -0.790 | -0.091 | -0.002 | 0.244 6 | 0.744 |
| PC2 | 0.327 | -0.214 | -0.053 | -0.151 | -0.906 | 0.027 | 0.052 8 | 0.161 | |
| PC3 | 0.619 | -0.398 | -0.217 | -0.492 | 0.412 | -0.013 | 0.021 4 | 0.065 | |
| 2020年 | PC1 | 0.444 | 0.310 | -0.738 | -0.231 | -0.330 | -0.012 | 0.241 3 | 0.753 |
| PC2 | 0.206 | 0.170 | -0.221 | -0.018 | 0.939 | 0.001 | 0.052 5 | 0.164 | |
| PC3 | 0.516 | -0.041 | 0.291 | -0.953 | 0.046 | -0.002 | 0.021 7 | 0.068 |
3.1.2 遥感生态指数变化分析
表3 不同年份IRSEI均值及IRSEI与各指标的平均相关度
Tab.3
| 年份 | NDVI | WET | NDBSI | LST | LUI | POP | IRSEI 均值 |
|---|---|---|---|---|---|---|---|
| 2000年 | 0.72 | 0.75 | 0.73 | 0.75 | 0.53 | 0.20 | 0.18 |
| 2005年 | 0.71 | 0.75 | 0.73 | 0.74 | 0.53 | 0.21 | 0.18 |
| 2009年 | 0.74 | 0.75 | 0.75 | 0.74 | 0.57 | 0.21 | 0.35 |
| 2015年 | 0.55 | 0.57 | 0.55 | 0.16 | 0.42 | 0.17 | 0.42 |
| 2020年 | 0.59 | 0.56 | 0.54 | 0.15 | 0.43 | 0.17 | 0.38 |
| 均值 | 0.66 | 0.68 | 0.66 | 0.51 | 0.50 | 0.19 | 0.30 |
图3

图3
2000—2020年IRSEI时空分布
Fig.3
Spatial and temporal distribution of IRSEI from 2000 to 2020
3.1.3 IRSEI分级
表4展示了湛江市5期生态环境质量等级的面积与比例。2000年与2005年,湛江市的生态环境质量级别分布情况较为相似,等级为差和较差的生态环境面积占比最高。2000年湛江市等级为较差与差的生态环境占比与分别为49.95%与48.28%,后续依次是等级为中、优和良的生态环境面积占比,分别为1.04%,0.52%和0.21%。2005年湛江市等级为差的生态环境面积占比最高,约为65.48%,其次是等级为差的生态环境占比约32.72%。2009年和2015年的生态环境质量等级分布较为相似,等级为中的生态环境占比超过65%,等级为优和良的占比最小,在1%左右。2020年湛江市等级为中的生态环境占比最高,为68.69%,其次是等级为差,为30.79%,其余占比均小于1%。综上所述,湛江市2009年和2015年生态面积整体较好,等级为中、良和优的生态环境面积占比较大。
表4 各年份不同等级IRSEI的面积与比例
Tab.4
| 等级 | 2000年 | 2005年 | 2009年 | 2015年 | 2020年 | |||||
|---|---|---|---|---|---|---|---|---|---|---|
| 面积/km2 | 比例/% | 面积/km2 | 比例/% | 面积/km2 | 比例/% | 面积/km2 | 比例/% | 面积/km2 | 比例/% | |
| 差[0,0.2) | 6 385.38 | 48.28 | 8 659.39 | 65.48 | 0.01 | 0.00 | 1 043.53 | 7.89 | 4 072.28 | 30.79 |
| 较差[0.02,0.35) | 6 605.60 | 49.95 | 4 326.90 | 32.72 | 4 478.66 | 33.87 | 2 529.22 | 19.12 | 0.00 | 0.00 |
| 中[0.35,0.55) | 137.20 | 1.04 | 79.37 | 0.60 | 8 674.53 | 65.59 | 9 495.07 | 71.80 | 9 083.81 | 68.69 |
| 良[0.55,0.75) | 27.78 | 0.21 | 0.03 | 0.00 | 37.34 | 0.28 | 142.90 | 1.08 | 63.43 | 0.48 |
| 优[0.75,1] | 69.04 | 0.52 | 159.31 | 1.20 | 34.46 | 0.26 | 14.27 | 0.11 | 5.42 | 0.04 |
从空间上看(图4),2000年,湛江市生态环境等级为差的区域主要分布在南部、北部与中部沿海,等级为较差的区域集中分布在湛江市中部。2005年,生态环境等级为较差的分布在湛江市南半部临海区域。2009年,生态环境质量等级为较差的区域主要为湛江市北部邻桂地区、西南地区与中部偏东的沿海地区。2015年,生态环境质量等级为较差的区域主要为湛江市西北、中部偏东与西南沿海地区,等级为中的区域主要分布在东北、中部与南部中心。2020年,生态环境质量等级为差的区域主要分布在湛江市北部与西南部,等级为中的主要分布在东南部与中部。综上所述,湛江市中部地区的生态环境质量高于西南与西北地区。
图4

图4
2000—2020年生态环境质量分级
Fig.4
Classification of ecological environment quality from 2000 to 2020
3.2 湛江市生态环境质量变化分析
为了进一步分析湛江市2000—2020年生态环境质量时空变化,对5期IRSEI值进行差值处理,并对结果进行分级。表5为20 a间湛江市生态环境质量变化面积及其占比情况。从4个阶段来看,2000—2005年,湛江市生态环境质量有73.93%的面积为基本不变,轻度变好和明显变好的比例为2.64%与7.25%,轻度变差与明显变差的占比分别为9.97%与6.21%,基本不变的占比最高,说明湛江市生态环境质量在此期间基本保持不变; 2005—2009年,湛江市生态环境明显变好比例最高,为89.03%,轻度变差与明显变差面积比例最低,分别为0.02%与1.27%,湛江市生态环境质量在此期间明显提升; 2009—2015年间,湛江市明显变好与轻度变好的比例分别为50.84%与20.09%,明显变差与轻度变差比例分别为9.25%与7.63%,明显变好比例较大于明显变差比例,说明湛江市生态环境质量在此期间略有提升; 2015—2020年间,湛江市轻度变差与明显变差面积占比分别为20.46%与10.84%,明显变好与轻度变好比例分别为4.24%与0.54%,湛江市生态环境变差的比例高于变好的比例,但比例相差微小,湛江市生态环境质量在此期间略微下降。2000—2020年间,湛江市生态环境大范围变好,变好总面积占比为87.65%,轻度变差与明显变差比例分别为1.35%与2.99%,变好比例远高于变差比例,说明湛江市20 a来的生态环境质量得到显著提升。
表5 不同程度生态环境质量变化
Tab.5
| 变化程度 | 2000—2005年 | 2005—2009年 | 2009—2015年 | 2015—2020年 | 2000—2020年 | |||||
|---|---|---|---|---|---|---|---|---|---|---|
| 面积/km2 | 比例/% | 面积/km2 | 比例/% | 面积/km2 | 比例/% | 面积/km2 | 比例/% | 面积/km2 | 比例/% | |
| 明显变差 [-1,-0.1) | 821.62 | 6.21 | 167.38 | 1.27 | 1 223.97 | 9.25 | 1 433.22 | 10.84 | 395.50 | 2.99 |
| 轻度变差 [-0.1,0.02) | 1 318.17 | 9.97 | 2.63 | 0.02 | 1 008.76 | 7.63 | 2 706.29 | 20.46 | 178.73 | 1.35 |
| 基本不变 [0.02,0.05) | 9 777.17 | 73.93 | 400.89 | 3.03 | 1 612.28 | 12.19 | 8 453.99 | 63.92 | 1 059.36 | 8.01 |
| 轻度变好 [0.05,0.1) | 348.94 | 2.64 | 879.65 | 6.65 | 2 656.56 | 20.09 | 70.91 | 0.54 | 1 149.94 | 8.70 |
| 明显变好 [0.1,1] | 959.11 | 7.25 | 11 774.46 | 89.03 | 6 723.43 | 50.84 | 560.58 | 4.24 | 10 441.48 | 78.95 |
从空间上看(图5),2000—2005年,约2/3的地区生态环境质量发生变化; 湛江市生态环境质量恶化主要发生在北部以及少部分沿海中部地区,生态环境好转主要分布在南部以及中部东侧沿海区域。2005—2009年,湛江市生态环境质量大范围明显变好,少量轻度变好分布于西南地区。2009—2015年,湛江市大部分生态环境质量得到提升,分布于最南端、东北以及中部区域,部分区域生态环境发生恶化,主要分布于北部与西南沿海区域。2015—2020年,湛江市整体生态环境质量基本不变,有少部分区域生态环境质量变差,主要分布于西南沿海区域,少量分布于北部地区。变好区域少量分布于中部地区。2000—2020年间,湛江市生态环境质量整体得到提升,生态系统较为稳定,生态环境恶化地区主要分布于北部与西南沿海区域,该区域主要受人类活动影响。
图5
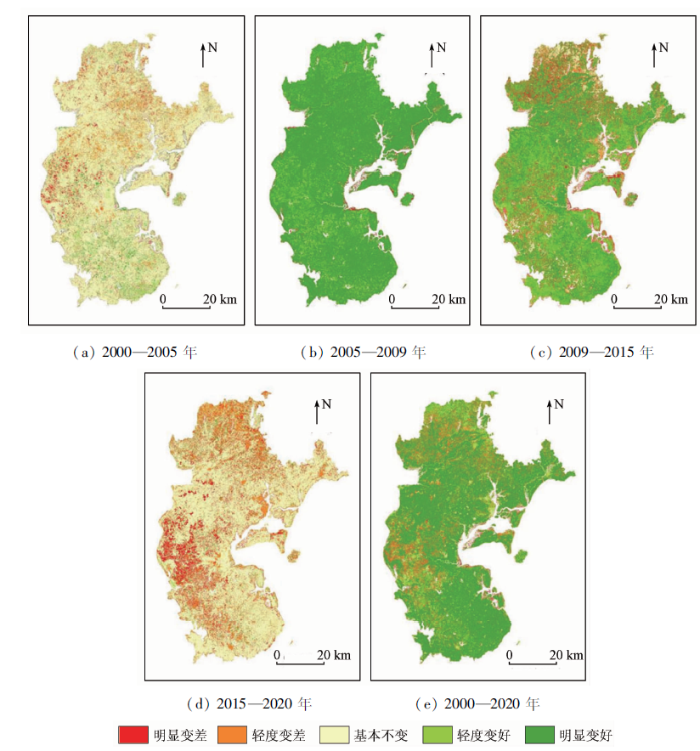
图5
2000—2020年湛江市生态环境空间变化
Fig.5
Space change of ecological environment in Zhanjiang City from 2000 to 2020
4 讨论与结论
1)本研究构建的IRSEI第一主成分贡献率都超过74%,与RSEI指数相比,IRSEI也能较好地集成各项指标有效特征信息。在PC1中,绿度指标与湿度指标的特征值符号为正,在生态环境质量评估中作用为正,干度指标、热度指标、土地利用指标与人口分布指标的特征值符号为负,在生态环境质量评估中作用为负。IRSEI指数能够准确、全面地评估湛江市生态环境质量。
2)2000年、2005年、2009年、2015年和2020年IRSEI分别为0.18,0.18,0.35,0.42,0.38。呈现“下降—上升”趋势,20 a间,湛江市生态环境质量明显变好面积比例为78.95%,说明湛江市生态环境质量总体变好。湛江市环境质量变好区域主要分布在中部与南部中心区域,这些地区土地利用类型主要为农田与森林,生态环境恶化区域主要分布在北部、中部偏东与西南部区域。这些地区土地利用类型主要为建设用地。
3)尽管本研究提出IRSEI,可以相对客观地分析湛江市生态环境质量变化,但研究中也存在不足,如大气、水系、气温和种群多样性等也是导致生态环境质量发生变化的原因,上述因素对生态环境质量变化的驱动机制还有待研究,若未来研究能综合考量其他生态指标,更能全面地评价湛江市生态环境质量。
参考文献
海岸带开发利用研究进展
[J].
Research progress of coastal zone develo-pment
[J].
海岸带快速城市化的土地资源冲突与协调——以山东半岛为例
[J].
Land resource conflicts and coordination in fast urbanized coastal zone:A case study of the Shandong Peninsula
[J].
基于栖息地风险评价模型的海岸带滩涂湿地风险评价——以闽三角为例
[J].
Assessing ecosystem risk in coastal wetland of the South Fujian Golden Delta using a habitat risk assessment model based on the land-use effect on tidal flat wetland
[J].
城市遥感生态指数的创建及其应用
[J].
A remote sensing urban ecological index and its application
[J].
基于 RSEI 模型的昆明市生态环境质量动态监测
[J].利用遥感技术进行生态环境监测有利于快速了解生态环境的变化过程。以昆明市为研究区,以Landsat TM和OLI影像为数据源,采用主成分分析法,运用集成于绿度、湿度、干度和热度4个指标的遥感生态指数(remote sensing ecological index, RSEI),对昆明市2000—2018年生态环境质量进行了评价。结果表明:RSEI指数能较好地指示区域生态环境状况,研究区RSEI主要是受干度的影响,其次是湿度和绿度,热度对RSEI模型的影响最小;2000—2018年,昆明市RSEI 5年平均值为0.51,生态环境质量处于一般状态(0.4~0.6),生态环境质量呈现“上升-下降-上升-下降”的波动变化趋势。其中,2010年受干旱因素影响,生态环境质量较其他年份相对较低;昆明市生态环境质量西部优于东部,其中以西南角的生态环境质量最佳。
Dynamic monitoring of ecological environment quality in Kunming based on RSEI model
[J].
基于 RSEI模型的石家庄生态环境质量评价
[J].
Evaluation of ecological environment quality in Shijiazhuang based on RSEI model
[J].
Evaluation of the temporal and spatial changes of ecological quality in the Hami Oasis based on RSEI
[J].
DOI:10.3390/su12187716
URL
[本文引用: 1]

Given the restrictions on special geographic locations in development processes, the measurement and analysis of the ecological quality of the Hami Oasis are of great significance for the protection of this fragile oasis. In this study, the ecological quality of the Hami Oasis was monitored by constructing a remote sensing ecological index (RSEI) for arid areas. Using the standard deviation ellipse and moving window method, the ecological status and space–time changes were explored for both their external and internal factors in the Hami Oasis. Finally, a geo-detector was employed to determine the driving factors of the ecological quality of the Hami Oasis. The results revealed that: (1) In the remote sensing ecological index constructed in the Hami Oasis, the main influencing factors were dryness and wetness. The average value of the ecological quality of the oasis was less than 0.5, and the ecological quality level was relatively poor. Among the five grades of ecological quality in the Hami Oasis, the poor grade and the good grade showed the largest changes, decreasing by 200 and increasing by 300, respectively, which were mainly concentrated in the periphery of the oasis. (2) The improved ecological quality of the Hami Oasis was mainly manifested in the expansion of the artificial oasis, while the deteriorated area was manifested as an increase in the built-up area. Moreover, the ecological quality of the Hami Oasis presented a ringlike nesting distribution pattern from the internal built-up area to the artificial oasis periphery. (3) The external expansion direction of the ecological quality of the Hami Oasis featured southeast–northwest expansion, which was consistent with the direction of the rivers and traffic roads. The transformation between different ecological qualities in the oasis and the expansion of the built-up area were the reasons for the fragmentation of the Hami Oasis’ landscape. (4) Compared to a single factor, the dual-factor for the ecological quality of the Hami Oasis had stronger explanatory power. Moreover, changes in land use types caused changes in the ecological quality of the Hami Oasis. During the study period, we found that human activities had a more significant impact than natural factors on the development of the Hami Oasis. (5) The Moran’s I Index increased from 0.835268 in 2000 to 0.923976 in 2018, and the p values in the study area all reached a 0.05 significant level. At the same time, the areas with p values above the 0.01 and 0.001 significant levels have also increased significantly in the past 18 years.
Spatiotemporal change and landscape pattern variation of eco-environmental quality in Jing-Jin-Ji urban agglomeration from 2001 to 2015
[J].DOI:10.1109/Access.6287639 URL [本文引用: 1]
基于遥感生态指数的甬江流域生态环境变化分析
[J].
Analysis of ecological environment changes in Yongjiang River basin based on remote sensing ecological index
[J].
基于改进遥感生态指数模型的锡林郭勒草原生态环境评价
[J].
Evaluation of ecological environment in the Xilin Gol Steppe based on modified remote sensing eco-logical index model
[J].
基于改进的遥感生态指数的北京市门头沟区生态环境质量评价
[J].
Evaluation of eco-environmental quality in Mentougou District of Beijing based on improved remote sensing ecological index
[J].
干旱地区遥感生态指数的改进——以乌兰布和沙漠为例
[J].
DOI:10.13287/j.1001-9332.202011.011
[本文引用: 1]
干旱区以荒漠为主要背景,生态环境脆弱,极易受到自然和人为因素的影响。为了定量评价干旱区生态环境质量,基于遥感生态指数(RSEI),针对干旱区对其进行改进,构建了干旱遥感生态指数(ARSEI),该指数耦合了绿度、湿度、盐度、热度以及土地退化度信息。利用ARSEI和RSEI对乌兰布和沙漠2000—2019年生态环境质量进行动态监测和评价,分析两者的差别及在干旱区的适用性。同时分析乌兰布和沙漠生态环境质量时空变化特征及原因。结果表明: ARSEI比RSEI对干旱区生态环境质量具有更好的适用性,ARSEI增强了土地利用类型变化在生态环境质量评价中的作用。2000—2019年,乌兰布和沙漠生态环境质量整体上为差。等级为优、良、中的部分主要分布在沙漠北部,等级为差的部分主要集中在戈壁和沙地处,较差主要在低覆盖度植被区。2000—2019年,乌兰布和沙漠生态环境质量总体变好,沙漠北部城镇或农场生态环境质量变化复杂,变差和变好交替分布。生态农业和沙产业对生态环境质量有明显的改善作用,这是乌兰布和沙漠生态环境质量变化的主要原因。
Improvement of remote sensing eco-logical index in arid regions:Taking Ulan Buh Desert as an example
[J].
干旱荒漠区生态环境质量遥感动态监测——以古尔班通古特沙漠为例
[J].
DOI:10.13287/j.1001-9332.201903.008
[本文引用: 1]
利用遥感生态指数(RSEI)对区域生态变化进行评价,可以快速、高效、客观地获取研究区生态环境变化状况.本研究以两期Landsat数据为数据源,计算研究区绿度、湿度、热度、干度4个生态因子的遥感生态指数,并基于主成分分析法确定其权重,对古尔班通古特沙漠2006—2017年间的生态环境时空格局进行定性和定量评价.结果表明: 湿度和绿度对古尔班通古特沙漠生态环境质量起正面作用,而热度和干度对生态环境质量起负面作用,其中代表绿度指标的归一化植被指数(NDVI)的贡献最大.2006—2017年间,古尔班通古特沙漠的RSEI有所下降,其均值从0.294下降至0.243,降幅达20.1%,研究区的生态环境状况呈现整体变差的趋势.古尔班通古特沙漠中部生态环境较为稳定,东北部植被覆盖密集区及南缘灌溉区生态环境质量变好,沙漠南部及西北部区域生态环境质量变差.
Dynamic monitoring of eco-environmental quality in arid desert area by remote sensing:Taking the Gurbantunggut Desert China as an example
[J].
改进型遥感生态指数及干旱区生态环境评价
[J].
Enhanced remote sensing ecological index and ecological environment evaluation in arid area
[J].
基于改进遥感生态指数的海南岛生态环境质量动态变化
[J].
Dynamic monitoring of ecological environment quality of Hainan Island based on improved remote sensing ecological index
[J].
海岸带生态风险评价研究进展
[J].
DOI:10.11867/j.issn.1001-8166.2016.02.0137.
[本文引用: 1]
海岸带位于海陆系统交错地带,独特的区位特征使其生态风险评价既有区域生态风险评价的综合性,亦有自身的特殊性。近年来,随着沿海经济发展和海岸带生态环境的恶化,海岸带生态风险越来越受到关注,但尚缺乏有关海岸带生态风险评价深入系统的研究与总结。通过梳理和归纳现有研究成果,基于海陆相互作用和陆海统筹的思想,在充分考虑海岸带生态环境的独特性、地域性和综合性的基础上,从风险源—生境—风险受体三大基本要素对海岸带生态风险评价概念及其组分进行了科学界定,并从风险源与驱动力、风险受体与评价终点、综合评价等视角详细阐释了目前海岸带生态风险评价研究的相关主题、发展脉络和主要论点;在分析海岸带生态风险评价的特征、已有模型和方法的基础上,解析了海岸带生态风险评价的理论架构。最后分析现有研究的不足,展望未来研究趋向,为今后海岸带生态风险评价研究提供思路与参考。
Coastal ecological risk assessment:Its research progress and prospect
[J].
湛江红树林国家级自然保护区
[J].
Zhanjiang mangrove national nature reserve
[J].
The 30 m annual land cover dataset and its dynamics in China from 1990 to 2019
[J].
DOI:10.5194/essd-13-3907-2021
URL
[本文引用: 1]
. Land cover (LC) determines the energy exchange, water and carbon cycle between Earth's spheres. Accurate LC information is a fundamental parameter for the environment and climate studies. Considering that the LC in China has been altered dramatically with the economic development in the past few decades, sequential and fine-scale LC monitoring is in urgent need. However, currently, fine-resolution annual LC dataset produced by the observational images is generally unavailable for China due to the lack of sufficient training samples and computational capabilities. To deal with this issue, we produced the first Landsat-derived annual China land cover dataset (CLCD) on the Google Earth Engine (GEE) platform, which contains 30 m annual LC and its dynamics in China from 1990 to 2019. We first collected the training samples by combining stable samples extracted from China's land-use/cover datasets (CLUDs) and visually interpreted samples from satellite time-series data, Google Earth and Google Maps. Using 335 709 Landsat images on the GEE, several temporal metrics were constructed and fed to the random forest classifier to obtain classification results. We then proposed a post-processing method incorporating spatial–temporal filtering and logical reasoning to further improve the spatial–temporal consistency of CLCD. Finally, the overall accuracy of CLCD reached 79.31 % based on 5463 visually interpreted samples. A further assessment based on 5131 third-party test samples showed that the overall accuracy of CLCD outperforms that of MCD12Q1, ESACCI_LC, FROM_GLC and GlobeLand30. Besides, we intercompared the CLCD with several Landsat-derived thematic products, which exhibited good consistencies with the Global Forest Change, the Global Surface Water, and three impervious surface products. Based on the CLCD, the trends and patterns of China's LC changes during 1985 and 2019 were revealed, such as expansion of impervious surface (+148.71 %) and water (+18.39 %), decrease in cropland (−4.85 %) and grassland (−3.29 %), and increase in forest (+4.34 %). In general, CLCD reflected the rapid urbanization and a series of ecological projects (e.g. Gain for Green) in China and revealed the anthropogenic implications on LC under the condition of climate change, signifying its potential application in the global change research. The CLCD dataset introduced in this article is freely available at https://doi.org/10.5281/zenodo.4417810 (Yang and Huang, 2021).
Detecting ecological changes with a remote sensing based ecological index(RSEI)produced time series and change vector analysis
[J].
DOI:10.3390/rs11202345
URL
[本文引用: 1]
Increasing human activities have caused significant global ecosystem disturbances at various scales. There is an increasing need for effective techniques to quantify and detect ecological changes. Remote sensing can serve as a measurement surrogate of spatial changes in ecological conditions. This study has improved a newly-proposed remote sensing based ecological index (RSEI) with a sharpened land surface temperature image and then used the improved index to produce the time series of ecological-status images. The Mann–Kendall test and Theil–Sen estimator were employed to evaluate the significance of the trend of the RSEI time series and the direction of change. The change vector analysis (CVA) was employed to detect ecological changes based on the image series. This RSEI-CVA approach was applied to Fujian province, China to quantify and detect the ecological changes of the province in a period from 2002 to 2017 using Moderate Resolution Imaging Spectroradiometer (MODIS) data. The result shows that the RSEI-CVA method can effectively quantify and detect spatiotemporal changes in ecological conditions of the province, which reveals an ecological improvement in the province during the study period. This is indicated by the rise of mean RSEI scores from 0.794 to 0.852 due to an increase in forest area by 7078 km2. Nevertheless, CVA-based change detection has detected ecological declines in the eastern coastal areas of the province. This study shows that the RSEI-CVA approach would serve as a prototype method to quantify and detect ecological changes and hence promote ecological change detection at various scales.
基于遥感生态指数的上海南汇东滩海岸带湿地生态格局变化评价
[J].
Evaluation of ecological pattern change of Nanhui Dongtan wetland in Shanghai based on remote sensing ecological index
[J].
基于改进型遥感生态指数(MRSEI)模型的滇中地区生态环境质量研究
[J].
Research on ecological environment quality in central Yunnan based on MRSEI model
[J].
基于遥感生态指数的新疆玛纳斯湖湿地生态变化评价
[J].
Evaluation of ecological changes based on a remote sensing ecological index in a Manas Lake wetland,Xinjiang
[J].
Summary of current radiometric calibration coefficients for Landsat MSS,TM,ETM+,and EO-1 ALI sensors
[J].DOI:10.1016/j.rse.2009.01.007 URL [本文引用: 1]
Tropical forest cover density mapping
[J].
陆地表层人类活动强度:概念、方法及应用
[J].
DOI:10.11821/dlxb201507004
[本文引用: 1]
人类活动强度是表征人类对陆地表层影响和作用程度的综合指标。在定义陆地表层人类活动强度、建设用地当量等概念的基础上,建立了人类活动强度算法模型和土地利用/覆被类型的建设用地当量系数折算方法,并利用1984-2008年期间6个年份的土地利用数据,对中国进行了实证应用研究。结果表明:中国的人类活动强度变化大致以2000年为界,前期增长相对缓慢,后期增长明显加快,1984年全国的人类活动强度为7.63%,到2008年上升为8.54%。2008年县级单元的人类活动强度按大于27%、16%~27%、10%~16%、6%~10%和小于6%划分为高、较高、中等、较低和低5个等级,其空间分布格局大致以贺兰山—龙门山—景洪线为界分为东、西两个部分。东部是高、较高和中等类型的集中分布区,低和较低类型呈条带状分布于山地、丘陵区;西部以低和较低类型为主体,在甘肃河西走廊、青海东部及新疆天山南北坡有零散的中等和较高类型分布。
Human activity intensity of land surface:Concept,method and application in China
[J].
基于RSEI模型的生态质量评估及城镇化影响——以南京市为例
[J].
DOI:10.13287/j.1001-9332.202001.030
[本文引用: 1]
利用2000和2017年Landsat5/TM和Landsat8/OLI影像,基于遥感生态指数(RSEI)模型,结合2000—2017年南京市气象观测数据和社会经济数据,对南京及其特色生态区域的生态环境变化进行分析与评估,结果表明: 2000—2017年,南京市RSEI平均值由0.626降至0.618;将RSEI值分成差、较差、一般、良和优5个等级,良好以上面积占比由61.0%降至57.1%,较差以下等级面积占比略有上升;与2000年相比,2017年南京市生态质量变好的面积占比为34.5%,变差的为34.7%,30.8%的面积基本不变,其中,主城区的生态质量明显好转,生态质量好转的面积超过了变差的面积,而新城区和郊区生态质量明显恶化,生态质量变差的面积超过了好转的面积;在3个生态保护区中,紫金山生态质量明显好于老山和江心洲;城镇化率与RSEI呈极显著负相关关系,相关系数达-0.91。城市化进程总体上会对生态环境产生负面影响,但严格的保护和管理措施可以使良好的生态环境得以保持甚至改善。
Ecological quality assessment and the impact of urbanization based on RSEI model for Nanjing,Jiangsu Province,China
[J].
