

0 引言
全球海岸带容纳了约60%的人口[1],中国70%以上的中等以上城市位于沿海地区,占国内生产总值的60%以上,水产养殖产出占世界的61.5%[2]。随着人口和经济增长,海岸带生态系统受人类活动的影响愈发明显[3]。潮滩、海岸线和养殖水体是诊断海岸带生态系统健康状况和制定利用保护策略的3个关键指标。水产养殖是中国沿海地区海岸带变化的重要驱动因素之一,在保障高质量蛋白质供应、促进经济发展以及缓解海水侵蚀等方面发挥着重要作用[4]。近几十年来,中国沿海地区的养殖水体急剧增加[2],已成为中国最重要的渔业产品供应源,约占中国国内鱼类产品的72%[5]。此外,水产养殖是全球增长最快的渔业方式。从1990—2015年,全球水产养殖产量增长了近5倍[6]。潮滩是野生动物的重要栖息地,具有抵抗风暴侵袭,维持海岸线,过滤污染物的作用。中国拥有世界面积第二大的潮滩[7],并经历了巨大变化[8],变化的主要驱动因素之一是沿海地区围填海[9]。海岸线变化是波浪侵蚀、风暴潮、河流泥沙负荷和人类影响共同作用的结果。因此,准确监测潮滩、海岸线和养殖水体的变化极其重要,可为生态系统保护提供不可或缺的信息。然而,由于海岸带的快速变化和极大的空间跨度,获取潮滩、海岸线和养殖水体变化信息仍面临巨大挑战。
尽管已利用地球观测数据获得了海岸带变化的信息,但长期、准确和全面的信息仍有待获取,需进一步改进方法以提高信息提取的准确性和效率,除潮滩外,还需要提取养殖水体和海岸线。基于GEE(Google Earth Engine)等云平台[7,18,20-21],综合多源遥感卫星(Landsat4/5/7/8和Sentinel-2A/B)可显著缩短重复观测周期,通过观测不同潮位时的水边线,可实现潮滩、海岸线与养殖水体的检测。因此,本文旨在利用Landsat4/5/7/8和Sentinel-2A/B时间序列图像,实现潮滩、海岸线和养殖水体的高效准确检测; 并通过获取1989—2021年中国大陆海岸带潮滩、海岸线和养殖水体的分布和变化信息,为海岸管理提供准确信息。
1 研究区与数据源
研究区覆盖中国大陆整个海岸带,从南至北延伸约4 400 km,包括广西、海南、广东、福建、浙江、江苏、山东、河北、辽宁等9个省(自治区),上海、天津2个直辖市以及香港和澳门特别行政区。综合运用2种数据,可提高观测频次,增加在高潮位和低潮位时获得观测数据的可能性。
2 研究方法
2.1 数据处理流程
整个工作流如图1所示,包括2大部分6个步骤: 获得水体出现概率数据(步骤1和2); 通过高、低潮位水边线获得潮滩、海岸线和养殖水体(步骤3—6)。在GEE云平台中,筛选云覆盖率小于80%的Landsat4/5/7/8和Sentinel-2A/B地表反射率数据,经云检测、云掩模、重采样、观测日期排序等预处理,获得多时序数据(每年无云有效观测频次为数十至上百次),其中云检测的标准为“蓝光波段反射率大于0.25”(图1步骤1)。Sentinel-2A/B数据用于计算归一化差值水体指数(normalized difference water index,NDWI)的波段空间分辨率为10 m,用于计算修正的水体指数(modified normalized difference water index,mNDWI)的短波红外(SWIR1)空间分辨率为20 m,Landsat4/5/7/8数据的对应波段空间分辨率为30 m,为综合运用2种数据,提高观测频次,Sentinel-2A/B数据空间分辨率均被重采样至30 m,重采样方式为双线性内插法。
图1
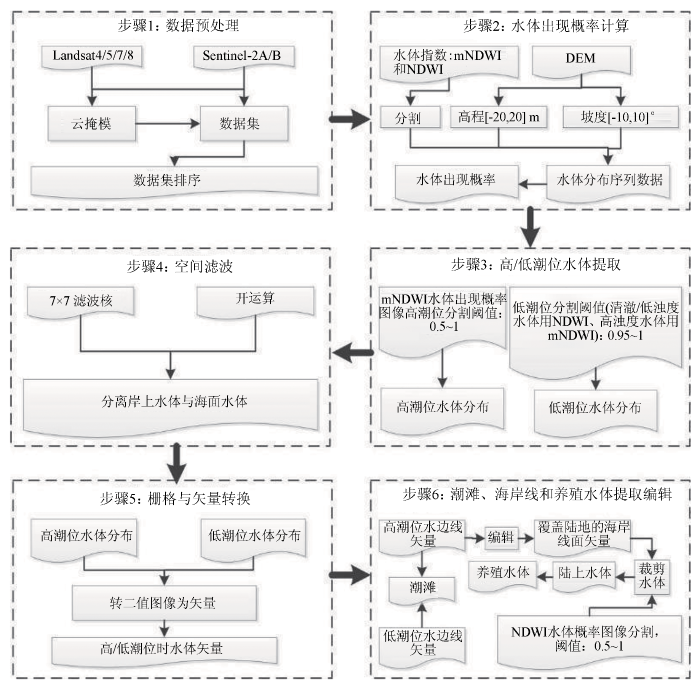
图1
潮滩、海岸线和养殖水体检测流程
Fig.1
Workflow of the integrated method to detect tidal flats, shorelines, and aquaculture water bodies
2.2 水体分布提取
在以往的研究[18,20]中,mNDWI与NDWI均已用于水体的检测,包括单个水体指数[2,22⇓⇓-25],及将水体指数与植被指数结合以减少当像素被植被和水部分覆盖时植被对水体识别的影响,水体判别的标准为,NDWI/mNDWI>EVI和EVI<0.1[20,26]。阴影对水体识别影响较大,云阴影只对单次观测造成影响,但对时间序列观测不会产生影响,原因是云阴影在空间分布上不断变化,作为空间随机分布的噪声不影响水体出现概率图像特征。为了克服地形阴影效应,引入了空间分辨率为30 m的数字高程模型(digital elevation model,DEM)数据,设置高程范围[-20,20] m和地形坡度范围[-10,10]°为有效范围(图1步骤2)。
值得注意的是,应该为不同水色的海水选择不同的水体指数。mNDWI指数适用于检测含有大量悬浮砂和淤泥的高浑浊黄色水体,以及清澈与低浑浊海水的干/湿边界,而NDWI适用于检测清澈与低浑浊海水的水体分布(图2)。如果海水清澈或浑浊度较低(图2(a)),NDWI比mNDWI能更好地区分开放水域和潮滩(图2(b)),而mNDWI可更好地区分潮滩以及陆地(图2(c))。因此,应使用NDWI检测低潮位水边线,并使用mNDWI检测清澈或浑浊程度较低海水的高潮位水边线。如果海水高度浑浊且呈黄色水色,含有大量悬浮泥沙(图2(d)),由于NDWI无法区分潮滩和水域(图2(e)),只有mNDWI可用于检测水边线(图2(f))。水体分割阈值也是水体识别的关键参数,分割测试表明,NDWI或mNDWI图像直方图的2个峰值之间的中间值可以设置为分割阈值。
图2
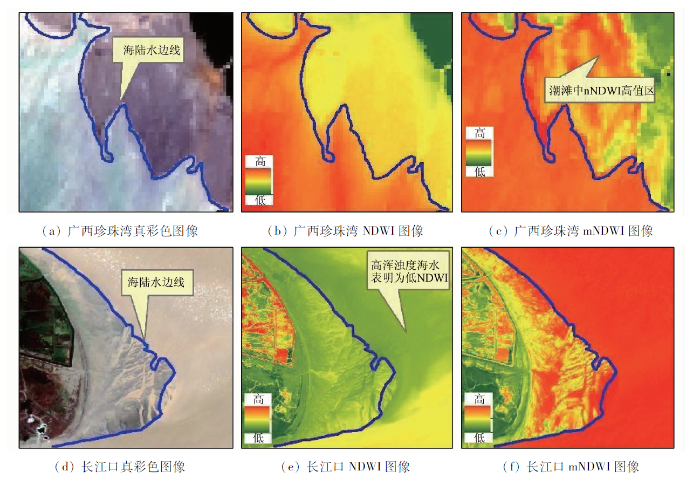
图2
不同水色NDWI与mNDWI水体指数对比
Fig.2
Comparison of NDWI and mNDWI at two sites with different water colors
2.3 水体出现概率计算
水体出现概率WOR计算公式为:
式中NoW和NoO分别为卫星过境形成有效观测(无云覆盖)时出现水体的次数和卫星过境形成有效观测的次数。
海洋开放水域的WOR接近1,而潮坪的WOR介于0~1之间。因此,可通过设置水体出现概率的下限和上限阈值来检测高潮和低潮位的水边线,并用高潮位水边线代表海岸线。对于清澈或低浑浊度的海水,根据mNDWI计算的WOR图像用于检测高潮水线,因为该指数比NDWI更适于检测潮滩的干/湿边界,根据NDWI计算的WOR图像用于检测低潮水边线,因为该指数比mNDWI更适合检测海水范围; 对于高浑浊度的海水,利用mNDWI计算的WOR图像用于检测高、低潮水边线。
2.4 海岸线提取
低潮位海岸线通过分割mNDWI或NDWI指数计算的水体出现概率图像获得,mNDWI对应高浑浊度海水,NDWI对应清澈或低浑浊度海水。低潮位海岸线理论分割阈值为1,但由于数据噪声等各种影响,实际值小于1,通过实验发现最佳分割阈值为0.95。
2.5 潮滩与养殖水体提取
对潮滩和水体光谱特征的分析表明,NDWI在区分潮滩和水体的效果明显优于mNDWI,原因是湿的潮滩的光谱特征受其土壤和/或沙子中的水的影响很大。因此,NDWI是检测低潮位水边线的最佳指标。图3中比较表明,mNDWI在检测高潮位水边线方面优于NDWI,而在检测低潮位水边线方面则相反。与mNDWI(图3(a))检测到的水位线相比,NDWI检测到的低潮位水边线更靠近大海(图3(b))。这是因为mNDWI将一些湿潮滩误识别为水体。广西珍珠湾基于mNDWI检测(应用mNDWI检测高、低潮位水边线)的潮滩面积为13.5 km2,而基于mNDWI与NDWI检测(分别应用mNDWI和NDWI检测高、低潮位水边线)的潮滩面积为30 km2,该面积比仅使用mNDWI检测的潮滩面积大122%(图3(b))。
图3
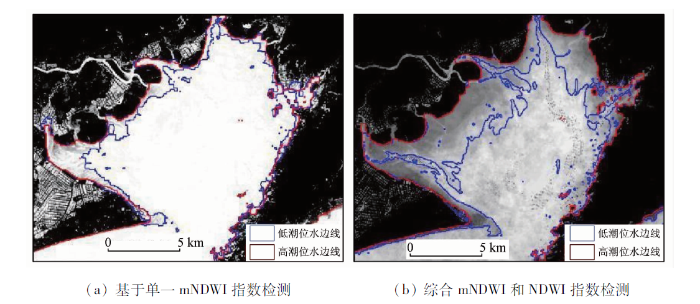
图3
使用不同水体指数检测潮滩对比
Fig.3
Comparison of multiple mNDWI and NDWI indices and a single NDWI index
3 结果与分析
3.1 典型海岸带潮滩、海岸线、养殖水体分布特征及结果可靠性
通过图像目视判读检查了潮滩、海岸线和养殖水体分布,以及初步结果的可靠性(图4)。潮滩位于海岸线的向海一侧,养殖水体以不同于天然池塘和水体的规则形状为主,在陆地一侧; 海岸线与陆地和水之间的边界相匹配(图4),仅有少量河流被误识别为养殖水体(图4(g)—(h))。以广西珍珠湾为试验区,对比了潮滩、海岸线、养殖水体的检测结果与资源3号全色与多光谱融合遥感影像(空间分辨率为2 m)解译结果,二者吻合度很高,解译结果由于采用的遥感数据空间分辨率高,边界更圆滑清晰,检测与解译的海岸线长度分别为88.1 km和96.8 km(相差为9.0%),检测的潮滩、养殖水体面积分别为29.1 km2和15.7 km2,解译的潮滩、养殖水体面积分别为33.3 km2和16.4 km2,二者相差分别为12.6%和4.4%(图5)。辽宁省、山东省、浙江省和福建省的潮滩面积最大,广东省、江苏省、福建省和山东省的海岸线最长,山东省和广东省的养殖池塘面积最大(图6)。
图4
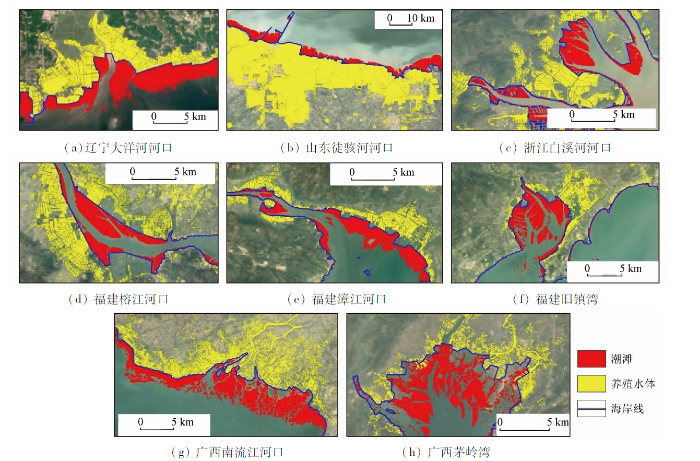
图4
典型区2021年潮滩、海岸线和养殖水体分布
Fig.4
Distribution of tidal flats, shorelines, and aquaculture water bodies in some sub-regions in 2021
图5
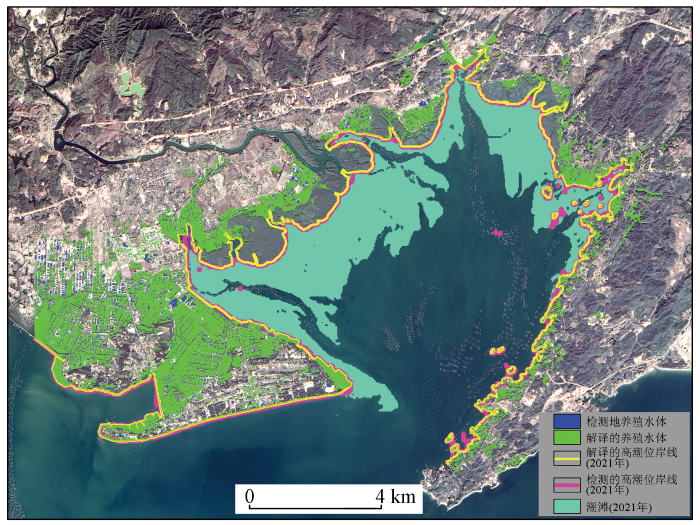
图5
广西珍珠湾2021年潮滩、海岸线和养殖水体检测结果与高分影像目视解译结果对比
Fig.5
Comparison of detection results of tidal flats, shorelines, and aquaculture water bodies and high-resolution image visual interpretation results in Pearl Bay, Guangxi, in 2021
图6
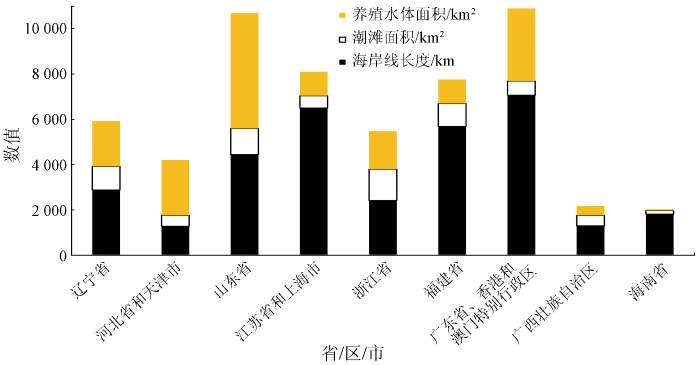
图6
中国大陆海岸带2021年潮滩、海岸线和养殖水体统计
Fig.6
Statistics of tidal flats, shorelines and aquaculture water brodies along the coastal zone of mainland China in 2021
3.2 潮滩、海岸线和养殖水体年际变化
总体而言,所有省(区市)的潮滩面积均有所减少,养殖水体面积和海岸线长度均有所增加(图7)。造成这些现象的主要原因是各种人类活动,如潮滩开垦、水产养殖池塘以及天然海岸线的建设和改建为人造海岸线。1989—2021年,中国大陆沿海潮滩的减少率、海岸线长度和养殖水体的增加率平均分别为46.2%,34.4%和149.3%,三者变化值分别为7 173.2 km2,5 320.5 km和9 046.5 km2。
图7
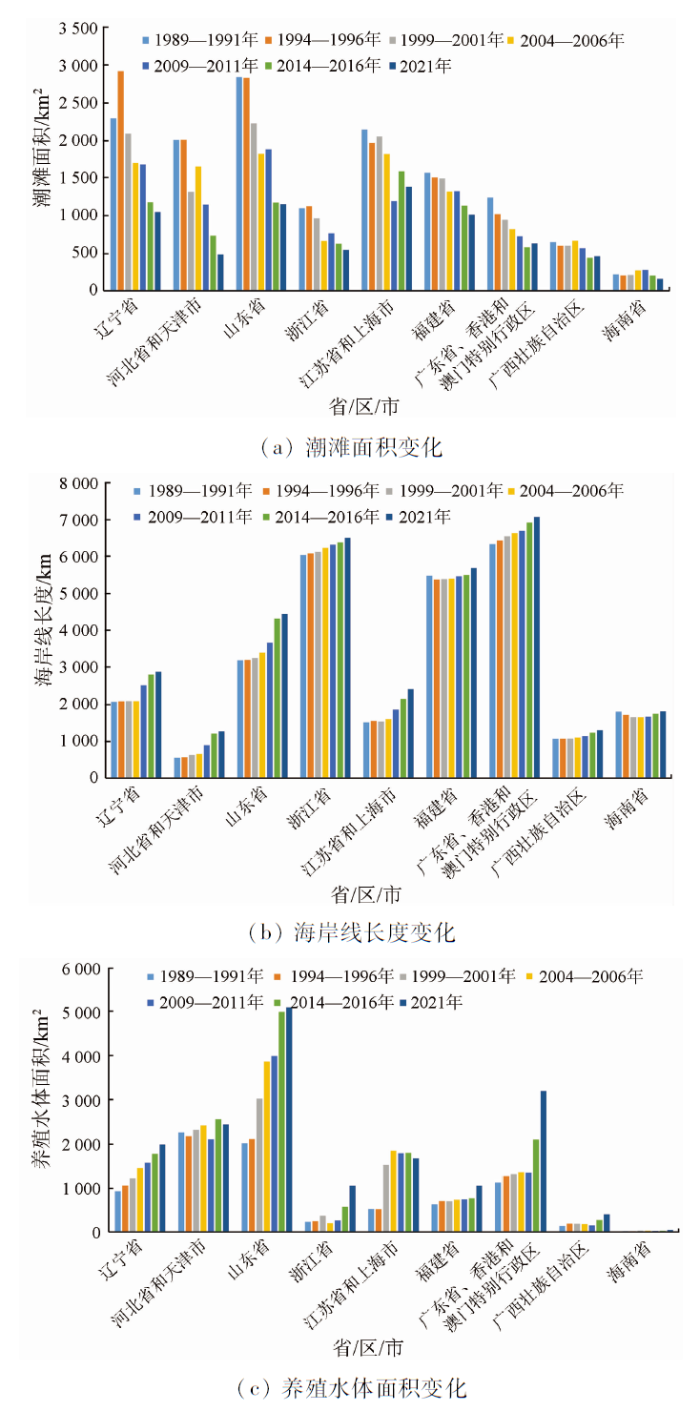
图7
潮滩、海岸线和养殖水体变化统计
Fig.7
Changes of tidal flats, shorelines and aquaculture water bodies
北方省市的潮滩减少比南方省市更严重,包括辽宁省、河北省和天津市、山东省,其平均减少率为63.1%,远高于整个海岸带的平均值(46.2%),占整个减少面积的62%。如果以1989—2021年的减少率在未来继续下去,预计辽宁省、河北省和天津市、山东省的潮滩将分别在27 a,10 a和22 a内完全消失。辽宁省、河北省和天津市、山东省的平均潮滩宽度,即用平均海岸线长度划分的潮滩面积,分别从1989年的0.97 km,2.41 km和0.78 km降至2021年的0.44 km,0.58 km和0.32 km。3个地区的平均损失宽度为0.94 km,远大于整个海岸带的平均值(0.42 km)。
养殖水体扩张最快的4个省市分别是山东省,广东省、香港和澳门特别行政区,江苏省和上海市,辽宁省,增加值分别是3 069.86 km2,2 073.02 km2,1 140.96 km2和1 054.64 km2,占总增加值的81.1%。山东省、江苏省和上海市、辽宁省的平均水产养殖宽度,即水产养殖面积除以平均海岸线长度,从1989—1991年的0.56 km,0.3 km和0.4 km增加到2021年的1.37 km,1.0 km和0.75 km,宽度增值分别为0.84 km,0.63 km和0.45 km,大于整个海岸带的的平均值(0.32 km)。
除海南省外,其他地区的海岸线长度都略有增加。海南省的海岸线长度稳定,略有波动。广西壮族自治区和海南省的潮滩、养殖水体和海岸线的变化率在所有地区中最慢。
1989—2021年,潮滩和养殖水体面积的变化呈现出相反的趋势(图7(a)和7(b))。通过进一步评估了它们之间的定量关系(图8)发现,所有省份二者均呈现负相关趋势,表明养殖水体的扩张是潮滩面积减少的重要驱动因素。山东省、浙江省、江苏省和上海市、广东省、广西壮族自治区等省区市的线性变化方程的乘性系数绝对值小于1,表明养殖水体的扩张占据了除潮滩外的其他土地覆盖类型的很大一部分。相反,辽宁省、河北省和天津市、福建省、海南省等省市线性变化方程的乘性系数绝对值大于1,表明潮滩是由包括养殖水体扩张在内的人类活动共同作用而减少。所有省区市养殖水体面积与海岸线长度呈正相关,辽宁省,河北省和天津市,山东省,浙江省,江苏省和上海市,福建省,广东省、香港和澳门特别行政区,广西壮族自治区,海南省等省区市决定系数分别为0.82,0.33,0.84,0.63,0.28,0.74,0.81,0.82,0.05,线性拟合线乘性系数分别为0.87,1.10,0.39,0.45,0.32,0.68,0.31,0.89,1.45,除河北省和天津市、江苏省和上海市以及海南省外,其他省市决定系数大于0.6,养殖水体面积与海岸线长度呈强正相关,表面这些省市养殖水体是海岸线变化的重要驱动因子。
图8
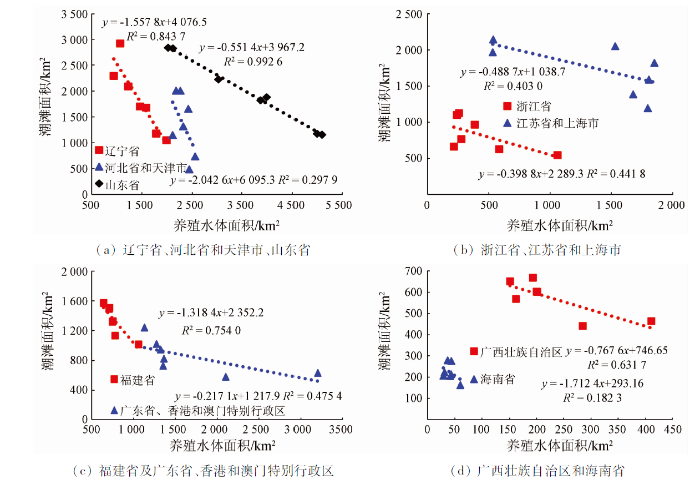
图8
潮滩与养殖水体面积相关关系
Fig.8
Scatter plots and linear relationships between the areas of tidal flats and aquaculture water bodies
4 讨论
4.1 与其他结果对比及差异原因分析
比较和分析不同方法的结果(图9—10)有助于方法改进,提高结果可靠性。与UQD[7],IGSNRR[17],CTF[18],FUDAN/OU[20]等方法对比可知,本文中的潮滩和养殖水体提取结果更准确可靠。通过整合Landsat4/5/7/8和Sentinel-2A/B卫星数据,增加观测频次,提高高、低潮位时的观测概率; 对于高、低潮位水边线的观测分别采用mNDWI与NDWI指数(双指数),最大程度发挥mNDWI指数对土壤湿度敏感利于检测高潮位干/湿水边线的优势,以及NDWI指数对土壤湿度不敏感利于检测低潮位海水潮滩水边线的优势,解决应用单一指数检测潮滩范围过窄的问题; 根据不同的海水浑浊度选择适用的水体指数,避免NDWI指数将高浑浊度海水识别为潮滩,致使识别的潮滩面积偏大。除浙江省、江苏省和上海市2区域外,本文结果(AGRS)与CTF结果[18]相近(二者相差为4.8%),但比FUDAN/OU结果[20]明显偏大(二者相差为41.3%),原因是本文与CTF[18]均采用了双指数法,而FUDAN/OU[20]采用了mNDWI单一指数进行水体的识别,由于开阔水域和含水量高的潮滩之间的mNDWI值相似,导致检测的低潮位水边线比真实低潮位水边线更靠近陆地一侧(图3)。对于浙江省、江苏省和上海市,本文与FUDAN/OU结果[20]接近(二者相差为5.9%),而明显小于CTF结果[18](二者相差为87.7%),原因是该区域内海水浑浊度很高,CTF[18]采用NDWI检测低潮位水边线时误将高浊度海水识别成了潮滩(图10(c))。所有地区的UQD[7]的面积都大于AGRS,CTF[18]和FUDAN/OU[20]的面积(图9),根据数据对比(图10)显示原因是其将陆地水体(如养殖水体)误识别为潮滩。UQD滩涂基于光谱特征通过分类算法来识别,由于光谱特征的相似性,难以完全区分陆地水体和滩涂。除山东省和广东省外,本文的养殖水体面积与Ren等[2]的结果接近,平均相对误差为17%(图11),差异可能是由于某些类型的陆地水体误判别为养殖水体造成的,例如盐池和稻田。根据山东省政府出版的年度统计书,沿海地区的水产养殖池塘平均面积为5 577.45 km2,相对于Ren等[2]的结果(2 291 km2),更接近本文AGRS结果(4 991.37 km2)。
图9
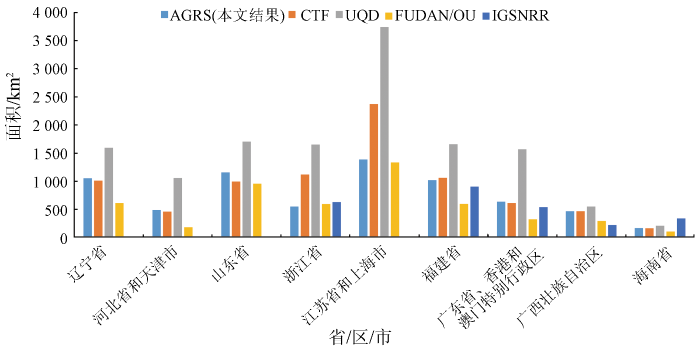
图9
潮滩面积分省/区/市统计及与其他结果对比
Fig.9
Provincial statistics of tidal flats and its comparison with other results
图10

图10
典型区潮滩分布对比
Fig.10
Subset views and comparison of tidal flats from different results
图11
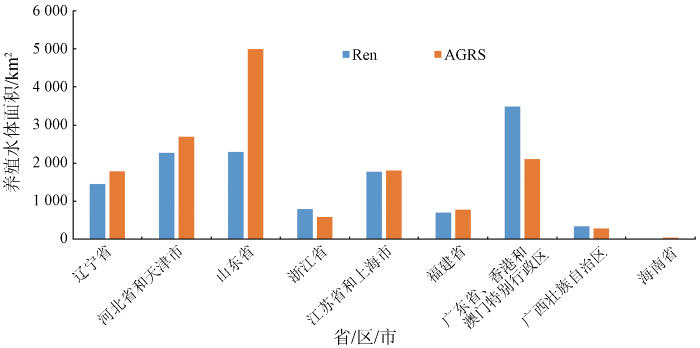
图11
养殖水体面积统计及与其他结果对比
Fig.11
Statistics of aquaculture water bodies and its comparison with other results
4.2 卫星过境观测时潮位变化范围
综合应用不同的卫星数据有助于增加观测频率,提高潮滩检测的精度,明确Landsat与Sentinel-2系列卫星综合过境观测时的潮位变化范围,是潮滩检测不确定性分析与方法改进的基础。为此对比了东营潮汐监测站全年潮位变化与卫星观测时的潮位变化(图12)。结果表明,利用了包括Landsat8与Sentinel-2A/B在内的3颗陆地卫星,尽管每年可对海岸带进行多达97次的观测,仍只能观测到部分潮位变化范围,约为全年潮位范围的56%,特别是无法观测最低潮位时的水边线(最低潮位为8 m)意味着,尽管卫星数据检测的潮滩变化率和趋势是可靠的,但实际潮滩的面积大于卫星数据检测的潮滩面积。
图12
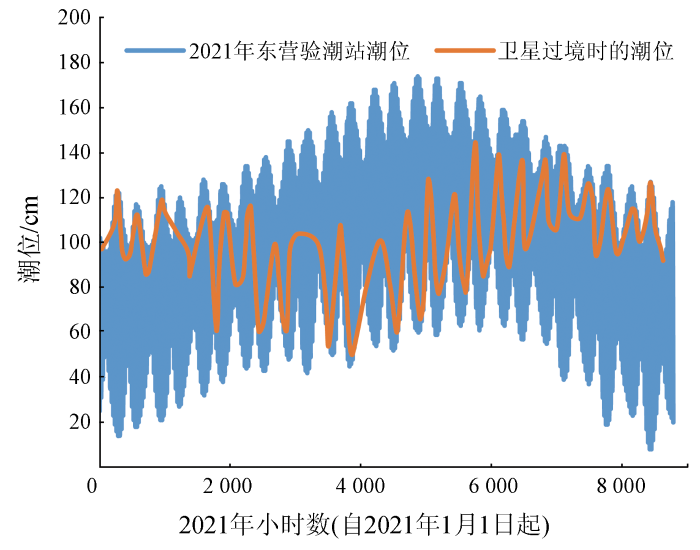
图12
东营潮位年内变化与卫星有效观测时的潮位变化对比
Fig.12
Tidal level changes in one year and at the satellite observation time, without any cloud cover, at the Dongying tide monitoring gauge
5 结论
综合应用Landsat4/5/7/8和Sentinel-2A/B光学遥感数据较好地解决了潮位引起的水边线动态变化与卫星瞬时观测的矛盾,增加低潮位观测的概率,提高潮滩检测的可靠性。针对不同的海水类型应选用不同的水体检测指数,发挥NDWI对水陆分界敏感及mNDWI对陆上干/湿边界敏感的优势,提高检测准度。养殖水体的检测应采用NDWI,可去除水田的干扰; 清澈或低浑浊程度海水低潮位水边线的检测应采用NDWI,高潮位水边线的检测应采用mNDWI; 高浑浊度海水低潮位水边线的检测应采用mNDWI。
1989—2021年间,中国大陆海岸带发生了巨大变化,潮滩快速消失,养殖水体面积和海岸线长度增加。整个中国大陆的潮滩减少率、海岸线长度和养殖水体增加率平均分别为46.2%,34.4%和149.3%,潮滩减少与养殖水体增加面积分别为7 173.2 km2和9 046.5 km2,海岸线长度增加5 320.5 km。潮滩的减少与养殖水体的增加高度负相关,表明养殖水体的扩张是潮滩减少的重要驱动因素。
北方省市的潮滩损失比南方省区市更严重(包括辽宁省、河北省和天津市、山东省),区内潮滩的平均减少率为63.1%,远大于整个海岸带的平均值(46.2%),占整个大陆海岸带潮滩损失面积的62%。以1989—2021年潮滩平均减少率计算,辽宁省、河北省和天津市、山东省的潮滩将分别在27 a,10 a和22 a内完全消失。
参考文献
Overcoming the impacts of aquaculture on the coastal zone
[J].DOI:10.1016/j.ocecoaman.2006.06.018 URL [本文引用: 1]
Rapid expansion of coastal aquaculture ponds in China from Landsat observations during 1984—2016
[J].DOI:10.1016/j.jag.2019.101902 URL [本文引用: 7]
Spatio-temporal characteristics of the mainland coastline utilization degree over the last 70 years in China
[J].DOI:10.1016/j.ocecoaman.2014.06.016 URL [本文引用: 1]
Nation-scale mapping of coastal aquaculture ponds with Sentinel-1 SAR data using Google Earth Engine
[J].
DOI:10.3390/rs12183086
URL
[本文引用: 1]

Global rapid expansion of the coastal aquaculture industry has made great contributions to enhance food security, but has also caused a series of ecological and environmental issues. Sustainable management of coastal areas requires the explicit and efficient mapping of the spatial distribution of aquaculture ponds. In this study, a Google Earth Engine (GEE) application was developed for mapping coastal aquaculture ponds at a national scale with a novel classification scheme using Sentinel-1 time series data. Relevant indices used in the classification mainly include the water index, texture, and geometric metrics derived from radar backscatter, which were then used to segment and classify aquaculture ponds. Using this approach, we classified aquaculture ponds for the full extent of the coastal area in Vietnam with an overall accuracy of 90.16% (based on independent sample evaluation). The approach, enabling wall-to-wall mapping and area estimation, is essential to the efficient monitoring and management of aquaculture ponds. The classification results showed that aquaculture ponds are widely distributed in Vietnam’s coastal area and are concentrated in the Mekong River Delta and Red River delta (85.14% of the total area), which are facing the increasing collective risk of climate change (e.g., sea level rise and salinity intrusion). Further investigation of the classification results also provides significant insights into the stability and deliverability of the approach. The water index derived from annual median radar backscatter intensity was determined to be efficient at mapping water bodies, likely due to its strong response to water bodies regardless of weather. The geometric metrics considering the spatial variation of radar backscatter patterns were effective at distinguishing aquaculture ponds from other water bodies. The primary use of GEE in this approach makes it replicable and transferable by other users. Our approach lays a solid foundation for intelligent monitoring and management of coastal ecosystems.
China’s aquaculture and the world’s wild fisheries
[J].
DOI:10.1126/science.1260149
URL
[本文引用: 1]
Curbing demand for wild fish in aquafeeds is critical
Large-scale assessment of coastal aquaculture ponds with Sentinel-1 time series data
[J].DOI:10.3390/rs9050440 URL [本文引用: 1]
The global distribution and trajectory of tidal flats
[J].DOI:10.1038/s41586-018-0805-8 [本文引用: 6]
Tracking the rapid loss of tidal wetlands in the Yellow Sea
[J].DOI:10.1890/130260 URL [本文引用: 1]
Mapping coastal wetlands of China using time series Landsat images in 2018 and Google Earth Engine
[J].
DOI:10.1016/j.isprsjprs.2020.03.014
PMID:32405155
[本文引用: 1]
Coastal wetlands, composed of coastal vegetation and non-vegetated tidal flats, play critical roles in biodiversity conservation, food production, and the global economy. Coastal wetlands in China are changing quickly due to land reclamation from sea, aquaculture, industrialization, and urbanization. However, accurate and updated maps of coastal wetlands (including vegetation and tidal flats) in China are unavailable, and the detailed spatial distribution of coastal wetlands are unknown. Here, we developed a new pixel- and phenology-based algorithm to identify and map coastal wetlands in China for 2018 using time series Landsat imagery (2,798 ETM+/OLI images) and the Google Earth Engine (GEE). The resultant map had a very high overall accuracy (98%). There were 7,474.6 km of coastal wetlands in China in 2018, which included 5,379.8 km of tidal flats, 1,856.4 km of deciduous wetlands, and 238.3 km of evergreen wetlands. Jiangsu Province had the largest area of coastal wetlands in China, followed by Shandong, Fujian, and Zhejiang Provinces. Our study demonstrates the high potential of time series Landsat images, pixel- and phenology-based algorithm, and GEE for mapping coastal wetlands at large scales. The resultant coastal wetland maps at 30-m spatial resolution serve as the most current dataset for sustainable management, ecological assessments, and conservation of coastal wetlands in China.
Comparing mean high water and high water line shorelines:Should proxy-datum offsets be incorporated into shoreline change analysis?
[J].DOI:10.2112/04-0401.1 URL [本文引用: 1]
The classification of intertidal mudflats
[J].DOI:10.1016/S0278-4343(00)00011-X URL [本文引用: 1]
The high water line as shoreline indicator
[J].
Evaluating shoreline identification using optical satellite images
[J].DOI:10.1016/j.margeo.2014.11.002 URL [本文引用: 1]
Continuous monitoring of coastline dynamics in western Florida with a 30-year time series of Landsat imagery
[J].DOI:10.1016/j.rse.2016.03.031 URL [本文引用: 2]
Detection and characterization of coastal tidal wetland change in the northeastern US using Landsat time series
[J].DOI:10.1016/j.rse.2022.113047 URL [本文引用: 1]
Extracting the intertidal extent and topography of the Australian coastline from a 28 year time series of Landsat observations
[J].DOI:10.1016/j.rse.2017.04.009 URL [本文引用: 1]
Mapping large-area tidal flats without the dependence on tidal elevations:A case study of Southern China
[J].DOI:10.1016/j.isprsjprs.2019.11.022 URL [本文引用: 2]
Rapid,robust,and automated mapping of tidal flats in China using time series Sentinel-2 images and Google Earth Engine
[J].DOI:10.1016/j.rse.2021.112285 URL [本文引用: 11]
Mapping tidal flats of the Bohai and Yellow Seas using time series Sentinel-2 images and Google Earth Engine
[J].
DOI:10.3390/rs14081789
URL
[本文引用: 1]
Tidal flats are one of the most productive ecosystems on Earth, providing essential ecological and economical services. Because of the increasing anthropogenic interruption and sea level rise, tidal flats are under great threat. However, updated and large-scale accurate tidal flat maps around the Bohai and Yellow Seas are still relatively rare, hindering the assessment and management of tidal flats. Based on time-series Sentinel-2 imagery and Google Earth Engine (GEE), we proposed a new method for tidal flat mapping with the Normalized Difference Water Index (NDWI) extremum composite around the Bohai and Yellow Seas. Tidal flats were derived from the differences of maximum and minimum water extent composites. Overall, 3477 images acquired from 1 Oct 2020 to 31 Oct 2021 produced a tidal flat map around the Bohai and Yellow Seas with an overall accuracy of 94.55% and total area of 546,360.2 ha. The resultant tidal flat map at 10 m resolution, currently one of the most updated products around the Bohai and Yellow Seas, could facilitate the process of sustainable policy making related to tidal flats and will help reveal the processes and mechanisms of its responses to natural and human disturbance.
Tracking annual changes of coastal tidal flats in China during 1986—2016 through analyses of Landsat images with Google Earth Engine
[J].DOI:10.1016/j.rse.2018.11.030 URL [本文引用: 10]
Google Earth Engine:Planetary-scale geospatial analysis for everyone
[J].DOI:10.1016/j.rse.2017.06.031 URL [本文引用: 1]
Wetland monitoring using classification trees and SPOT-5 seasonal time series
[J].DOI:10.1016/j.rse.2009.10.009 URL [本文引用: 1]
Assessment of inundation changes of Poyang Lake using MODIS observations between 2000 and 2010
[J].DOI:10.1016/j.rse.2012.01.014 URL [本文引用: 1]
Automated water extraction index:A new technique for surface water mapping using Landsat imagery
[J].DOI:10.1016/j.rse.2013.08.029 URL [本文引用: 1]
Modification of normalised difference water index (NDWI) to enhance open water features in remotely sensed imagery
[J].DOI:10.1080/01431160600589179 URL [本文引用: 1]
Continuous monitoring of lake dynamics on the Mongolian Plateau using all available Landsat imagery and Google Earth Engine
[J].
DOI:10.1016/j.scitotenv.2019.06.341
[本文引用: 1]
Lakes are important water resources on the Mongolian Plateau (MP) for human's livelihood and production as well as maintaining ecosystem services. Previous studies, based on the Landsat-based analyses at epoch scale and visual interpretation approach, have reported a significant loss in the lake areas and numbers, especially from the late 1990s to 2010. Given the remarkable inter- and infra-annual variations of lakes in the aril and semi-arid region, a comprehensive picture of annual lake dynamics is needed. Here we took advantages of the power of all the available Landsat images and the cloud computing platform Google Earth Engine (GEE) to map water body for each scene, and then extracted lakes by post-processing including raster-to-vector conversion and separation of lakes and rivers. Continuous dynamics of the lakes over 1 km2 was monitored annually on the MP from 1991 to 2017. We found a significant shrinkage in the lake areas and numbers of the MP from 1991 to 2009, then the decreasing lakes on the MP have recovered since circa 2009. Specifically, Inner Mongolia of China experienced more dramatic lake variations than Mongolia. A few administrative regions with huge lakes, including Hulunbuir and Xilin Gol in Inner Mongolia and Ubsa in Mongolia, dominated the lake area variations in the study area, suggesting that the prior treatments on these major lakes would be critical for water management on the MP. The varied drivers of lake variations in different regions showed the complexity of factors impacting lakes. While both natural and anthropogenic factors significantly affected lake dynamics before 2009, precipitation played increasingly important rule for the recovery of lakes on the MP after 2009. J.V, (C) 2019 Elsevier B.V.
