

0 引言
GPM的空间分辨率(0.1°×0.1°)虽然比TRMM高,但在地形复杂的地区,其精度仍然不高,需要用降尺度的方法提升GPM降水产品的精度。目前已有国内外学者基于降水主导因子对GPM降水卫星产品建立降尺度模型,如Lu等[8]以中国天山山脉为研究区域,基于地形因子和植被指数构建地理加权回归降尺度模型,与逐步回归降尺度模型进行对比; 史岚等[9]引入水汽数据,结合地形因子和植被因子,构建地理加权回归降尺度模型; 胡实等[10]研究将GPM降水产品与植被指数和高程结合,构建时滞地理加权回归模型; Brocca等[11]结合GPM早期降水产品、雨量计和欧洲中期降水中心天气预报再分析3种降水产品,提出3种不同的降水径流模型。虽然GPM降水产品基于降水主导因子的研究众多,但是运用深度学习方法研究降水降尺度的相关研究较少。
深度学习由Hinton等[12]在2006年提出,它由机器学习演变而来,可以一次性学习所有特征,具有更强大的学习能力。深度学习有多种算法,如前馈神经网络、卷积神经网络、循环神经网络(recurrent neural network,RNN)等。深度学习在其他领域获得了不小的成果,使得更多的学者将深度学习应用在降尺度方面。如Afshin等[13]选取了卡隆盆地的降水量、南方涛动指数、海平面气压和海表面温度等数据,将人工神经网络、模糊逻辑和小波函数结合,海平面气压和海表温度达到了最佳的结果。国内外学者不仅将深度学习方法应用在海温降尺度方面,而且更偏向于利用深度学习方法预报降尺度的研究。Bonnet等[14]运用视觉预测深度学习算法预测巴西圣保罗的降水量,指出视觉预测深度学习算法作为辅助临近预报具有很大的潜力; 王慧媛[15]基于雷达回波数据和气象站数据,运用多时间尺度支持向量机估测华东地区短时动态降水; 周康辉等[16]结合多源观测数据和高分辨率数值天气预报,运用深度学习算法,可视化强对流天气并解释预测过程,发现该算法得出的结果比单一数据的预报更加可靠; 郭瀚阳等[17]利用卷积循环网络模型预报高分辨率的强对流天气; 徐海龙等[18]基于长短时记忆网络(long short-term memory neural network,LSTM)算法,结合最小二乘法,提高了日长变化预报的精确性; 袁建刚等[19]根据递归神经网络算法建立全球电离层模型,成功模拟出电离层的物理变化; Xiang等[20]提出了新的基于参考和梯度引导的降尺度深度学习模型。深度学习的算法多应用于图像识别、无人机和预测等领域[21⇓⇓-24],在降水降尺度研究领域应用较少。
目前,降水降尺度研究大多基于年尺度、季尺度和月尺度,很少研究日尺度,同样也缺乏构建深度学习降尺度模型。本文选择闽浙赣作为研究区,基于2015—2019年日降水数据,对GPM卫星遥感降水产品运用深度学习方法构建降尺度模型,获得研究区高精度的降水数据,并对模型结果进行评估。
1 研究区概况及数据源
1.1 研究区概况
闽浙赣地区(如图1)位于中国的东南部,处于中国地形第三级阶梯,东濒东海,西临湖南和湖北,南近广东,北与江苏和安徽接壤。该区域经纬度范围为E113.5°~122°,N23.5°~31°。研究区包含福建、浙江和江西三省行政区域,有杭州市、南昌市、福州市等31个地级城市,三省总面积大约是39万km2。海拔由西向东升高,地势起伏较大,地形多为高山、山地、丘陵,同时也有平原。该研究区域的气候类型属于亚热带季风气候和亚热带季风性湿润气候,具有雨热同期的特点,夏季高温多雨,盛行东南季风,冬季低温少雨,盛行西北风。研究区域的年降水量可以达到1 000~2 000 mm左右。从春末到夏季都是多雨时节,容易发生滑坡、泥石流等地质灾害和洪涝灾害,同时也容易出现风雹、台风等气象灾害。因此,研究闽浙赣地区降水的时间和空间分布具有十分重大的意义,可以为监测、预测自然灾害提供技术支撑。
图1
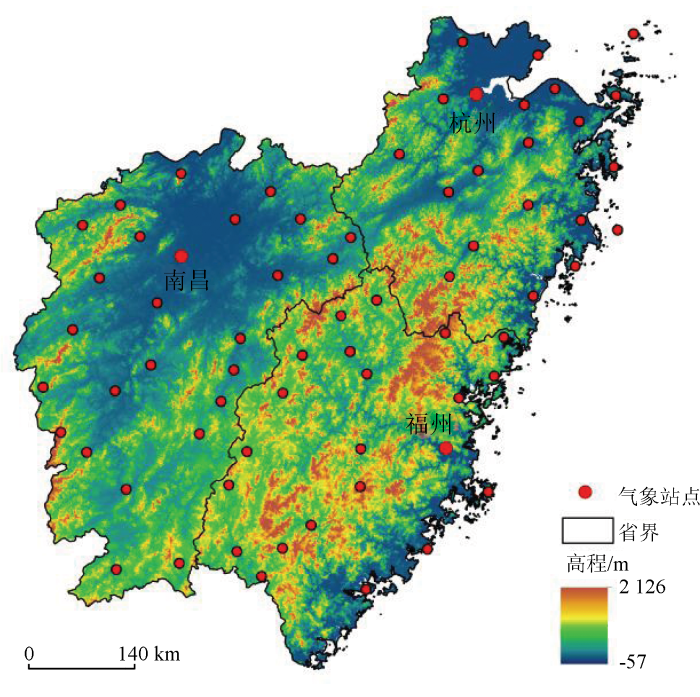
图1
闽浙赣地区的地形和气象站点分布图
(该图基于自然资源部标准地图服务网站下载的审图号为GS(2016)2923号的标准地图制作,底图无修改。下文同。)
Fig.1
Distribution map of topographic and meteorological stations in Fujian-Zhejiang-Jiangxi regions
1.2 数据源及其预处理
1.2.1 GPM数据
本文采用的GPM数据来自美国国家航空航天局(
1.2.2 气象数据
气象站点数据来自于中国气象科学共享服务网(
1.2.3 基础地理数据
数字高程模型 (digital elevation model, DEM)来自国家基础地理信息数据库(
1.2.4 植被指数数据
归一化植被指数 (normalized difference vegetation index,NDVI)数据为MOD13A2中国区域NDVI合成产品,来自于美国国家航空航天局的官方网站(
2 研究方法
2.1 降尺度模型构建
2.1.1 模型构建
GPM=f(Lon, Lat, Slope, Aspect, H, NDVI) 。
将降水主导因子输入深度学习降尺度模型中,构建空间分辨率1 km×1 km的GPM降尺度模型。
2.1.2 基于LSTM的降尺度模拟
RNN与普通神经网络相比没有太多的限制因素,应用于序列数据集更优,但是在训练过程中容易出现梯度消失或者梯度爆炸的问题,尤其是长序列的时候,问题更加明显。在此基础上,Hochreiter等[27]对RNN进行了算法提升,提出了LSTM,LSTM克服了RNN的不足之处[28]。如图2所示,LSTM由单元状态(cell state)和门控(gates)构成,在每个序列索引位置t的门是由输入门、遗忘门和输出门构成,输入门控制信息流入,遗忘门控制状态更新,输出门控制信息输出。图2中,Xt和ht分别为t时刻的输入和输出,σ和Tanh分别为sigmoid和Tanh激活函数,⊗表示乘法,输出结果的值域为[0,1],表示允许输出多少数据,值越小,表示输出数据越少,反之,输出数据越多, ⊕为加法,A为其他时刻的LSTM结构。
图2
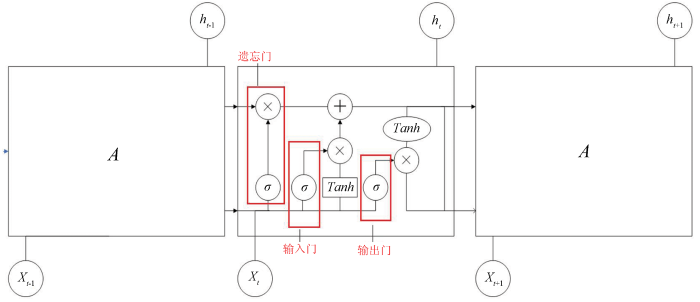
一般LSTM可解决长时间序列的问题,随之而来的局限性是当前时间t的目标值不仅与t-1时刻的变量有关,还和当前时间t的变量有关,事实上,当前时间t的变量并不存在,因为t时间的变量与输出结果共同存在。在此基础上,本文考虑将第一个数据集输入LSTM模型中,输出的结果和下一个数据集再次输入到LSTM模型中,对LSTM进行优化,得到优化后的LSTM(optimized LSTM, OLSTM)算法,具体如下: ①调整算法网络,初始化权重值、迭代次数等参数; ②将2015—2019年的数据集分为训练集和测试集,输入第一个训练集主导因子,输出的结果和下一个训练集主导因子输入模型中,得到OLSTM模型; ③将数据的测试集输入降尺度模型中进行测试并计算精度指标,以检验降尺度模型。
2.2 误差验证
本文从加密站和个例年2方面进行验证,以说明模型在空间和时间上的普适性。采用相关系数R、平均相对误差(mean relative error, MRE)以及均方根误差(root mean square error, RMSE)对估算降水量与实测降水量比较,分析两者之间的误差,评估降尺度模型结果精度。采用标准差
式中:
3 分析与讨论
3.1 模型调整参数
不断调整隐含层L、神经元N和迭代次数epochs,得到降水数据的训练集和测试集的决定系数R2、RMSE和MRE,根据降水数据集的长度,神经元数量N为300,隐含层L和迭代次数的调整结果如表1所示。从表1可知,当L=5,N=300,epochs=250时,训练集的决定系数R2为0.89,RMSE为0.39 mm,此时决定系数最高,RMSE最低,拟合出的降水精度理论上是最优的,但是此时的测试集R2和MRE不是最优解,过分追求评估指数最优,导致结果过于拟合,模型将会表现出极差的泛化能力,甚至得到的降水精度不如预期的理想,这是因为迭代次数过多,拟合了训练集数据的噪声和训练样例中没有代表性的特征。为了解决过拟合的问题,本文逐渐减少隐含层的层数和迭代次数,直到隐含层为4,迭代次数为150时,损失值(loss)慢慢收敛稳定,故选取模型的参数为: L=4,N=300,epochs=150,将参数和降水数据集输入模型中,得到2015—2019年降水数据集。
表1 模型调整参数表
Tab.1
| L | N | epochs | 训练集 | 测试集 | ||||
|---|---|---|---|---|---|---|---|---|
| R2 | RMSE/ mm | MRE/% | R2 | RMSE/ mm | MRE/% | |||
| 4 | 300 | 150 | 0.88 | 1.17 | 14.76 | 0.94 | 1.34 | 14.31 |
| 4 | 300 | 200 | 0.89 | 0.76 | 71.37 | 0.87 | 0.88 | 62.82 |
| 4 | 300 | 250 | 0.87 | 0.56 | 89.25 | 0.66 | 0.60 | 83.96 |
| 5 | 300 | 150 | 0.87 | 1.38 | 18.67 | 0.88 | 1.96 | 16.52 |
| 5 | 300 | 200 | 0.89 | 0.89 | 30.28 | 0.90 | 0.93 | 34.54 |
| 5 | 300 | 250 | 0.89 | 0.39 | 33.36 | 0.75 | 0.11 | 32.63 |
| … | … | … | … | … | … | … | … | … |
3.2 降尺度的结果分析与验证
图3—6分别为2019年四季中某一天的气象站降水、遥感卫星GPM IMERG和降尺度结果的对比图,可以看出降尺度结果降水的分布图比气象站降水分布图和遥感卫星GPM IMERG降水分布图具有更高的空间分辨率,还精细地刻画了研究区降水的空间分布差异。从整体上来看,GPM IMERG降水产品对研究区进行了严重的低估,降尺度结果则与气象站降水量比较接近,但是在7月12日,GPM降水产品对研究区局地进行了高估,比如江西宜春。降尺度结果的空间分布情况与气象站降水数据的空间格局也更为一致,但是空间差异性较气象站降水数据更为精细,在降水的最值区域三者有差异: 在1月17日(图3),气象站降水最大值在浙江玉环,降水量是42.1 mm,GPM和降尺度结果的最大降水量分别在浙江上虞和平湖,数值较低,分别是11.2 mm和25.1 mm; 在4月7日(图4),浙江云和的气象站降水量最大,为52.8 mm,GPM和降尺度结果的最大降水量都位于福建福鼎; 在7月12日(图5),福建福安的气象站最大降水量达到了75.7 mm,GPM和降尺度结果的最大降水量都在福建永定; 在10月16日(图6),江西靖安的气象站降水量最大,为14.5 mm,GPM降水量在江西遂川最大,达6 mm,降尺度结果的最大降水量位于江西靖安,为13.5 mm,与气象站最大降水量所在位置和数值都更为一致。总体而言气象站降水的最值区域与GPM的最值降水区域有区别,与降尺度结果的最值区域更为接近。
图3
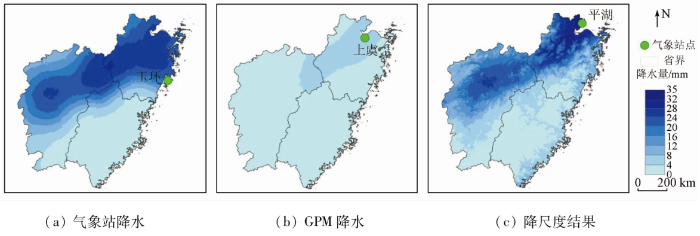
图3
2019年1月17日降水空间分布图
Fig.3
Spatial distribution of precipitation on January 17, 2019
图4
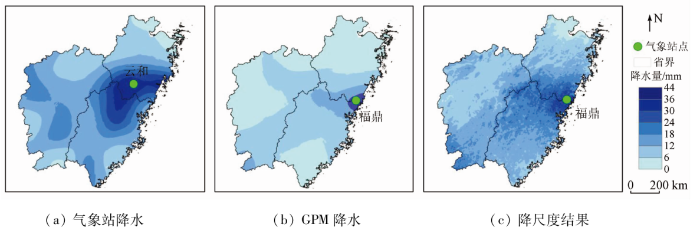
图4
2019年4月7日降水空间分布图
Fig.4
Spatial distribution of precipitation on April 7, 2019
图5
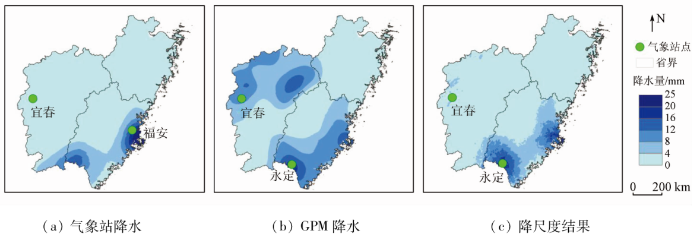
图5
2019年7月12日降水空间分布图
Fig.5
Spatial distribution of precipitation on July 12, 2019
图6
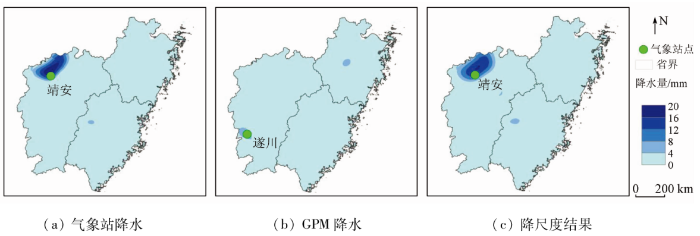
图6
2019年10月16日降水空间分布图
Fig.6
Spatial distribution of precipitation on October 16, 2019
从降水时间分布来看,1月17日,图3(a)和图3(c)可知,闽浙赣地区降水分布由西北向东南方向递减,降水集中在浙江北部,浙江东北沿海地区降水量最多,达到了大雨级别,而降尺度结果的级别仍是中雨,在福建地区降水最少; 4月7日,从图4(a)和图4(c)可以看出,气象站降水集中在浙江和福建交界处、江西中部和西部,降尺度结果在浙江和福建交界处降水量较多,在其他地方是少量降水; 7月12日,由图5(a)可以见到,研究区大部分地区是少雨,除了福建地区沿海和南部地区仍有降水,降尺度结果的空间分布格局与气象站一致; 10月16日,图6(a)和图6(c)可知,气象站降水集中在江西西北部,其他地方仍有少量降水,而降尺度结果也集中在江西西北部。运用深度学习算法订正降水数据的方法提高了原始GPM IMERG数据的精度,该方法在一定程度上是可靠的。本文降尺度结果虽然能够较好地反映出闽浙赣降水的时间和空间分布情况,但是在一些细节上仍有偏差。主要在4月7日这一天,降水集中在浙江南部和福建北部,处于暴雨强度,而降尺度结果并没有达到暴雨强度,即降尺度结果在4月7日订正效果并不好,未来将引入水汽含量、风向等其他降水因子,提升深度学习降尺度模型的效果。
3.3 模型验证
3.3.1 典型区域加密站验证
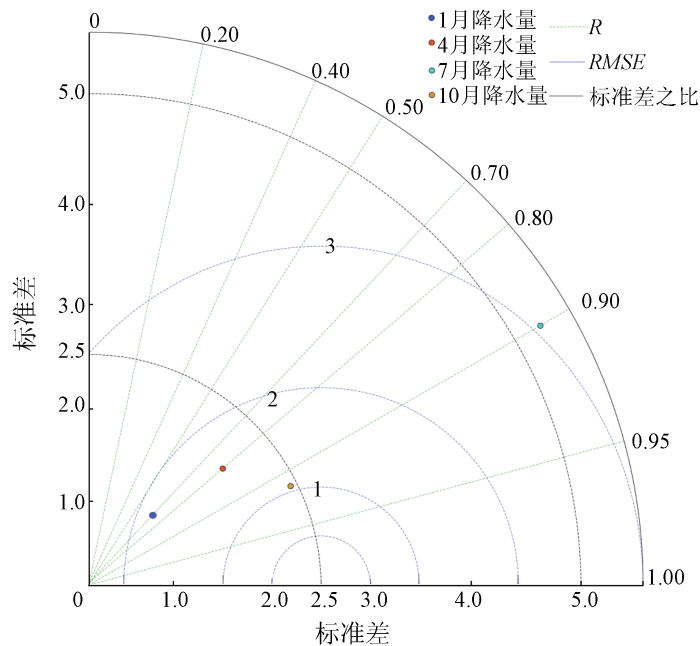
利用鄱阳湖流域84个加密气象站点2015—2019年平均月降水量对OLSTM降尺度模型进行验证。为更好地验证OLSTM深度学习的降尺度效果,本文将降尺度结果绘制成平均月降水的泰勒图。从图7可知,平均月降水量的相关系数R都超过了0.7,其中,10月的降尺度结果最优,比其他月份表现更佳,R达到了0.91,RMSE为1.19 mm,标准差是2.46,最接近标准差之比2.5; 7月和4月次之,7月的R是0.9,RMSE是3.01 mm,标准差是5.23,4月的相关系数是0.8,RMSE是1.66 mm,标准差是1.66。但是1月误差偏差较大,R是0.7,RMSE是1.9 mm,标准差是0.78。这是因为1月降水量少,降尺度模型存在高估的现象。
图7
3.3.2 个例年验证
为了验证深度学习降尺度模型在时间尺度的模拟水平,本文选取未参与模型训练的2020年降水数据,对研究区的空间降水进行降尺度,将降尺度后的降水数据与气象站点数据分别从日尺度和月尺度2个时间尺度进行精度评估,计算降尺度前后的精度指标R,RMSE和MRE以评估模型的实用性。
图8
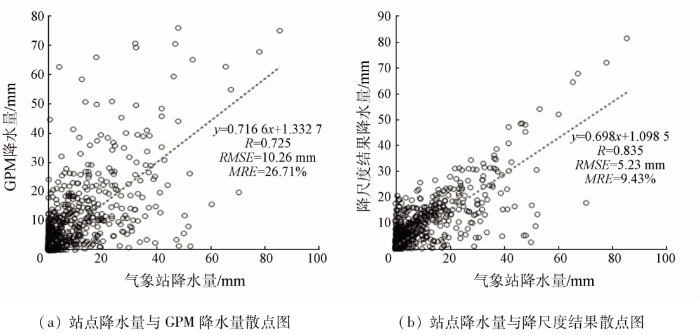
图8
日尺度下站点降水量分别和GPM降水量与降尺度结果的散点图
Fig.8
Scatter plot of station precipitation, GPM precipitation and downscaling result precipitation at daily scale
2) 月尺度降水精度评估。为对比分析月尺度下GPM降水数据与降尺度结果的精度,表2是2020年各月的2种降水数据的误差对比。从表2可以看出,降尺度结果的质量比降尺度前更优一点,每月的相关系数R都提升了,R的平均值达到了0.882,10月的R甚至达到了0.893,但4月的R比较低,只有0.879,2个月相差了0.14,体现出降尺度结果与实测值有较好的一致性; 4个月的MRE在5.71%~7.87%之间,大大降低了GPM降水数据与实测数据的误差; 每月的RMSE在0.324~4.123之间,降低了0.359~3.269,提升了GPM 降水产品的精度。其中,降尺度结果最好的是7月和10月,1月和4月降尺度结果稍微较差,这与以前学者研究的结果一致[29]。GPM由于自身的算法的限制,对微量降水和固态降水敏感,有可能出现少雨强高估的现象[30],也有台风登陆,带来强降水,造成误差的原因。总的来说,利用深度学习降尺度模型对GPM降水产品进行降尺度具有一定的效果。
表2 GPM降水数据与降尺度结果精度指标
Tab.2
| 月份 | R | MRE/% | RMSE/mm | |||
|---|---|---|---|---|---|---|
| GPM | 降尺度 结果 | GPM | 降尺度 结果 | GPM | 降尺度 结果 | |
| 1月 | 0.784 | 0.868 | 12.01 | 5.71 | 0.683 | 0.324 |
| 4月 | 0.770 | 0.879 | 11.16 | 7.76 | 0.885 | 0.268 |
| 7月 | 0.785 | 0.888 | 15.15 | 7.59 | 7.392 | 4.123 |
| 10月 | 0.789 | 0.893 | 15.61 | 7.87 | 2.673 | 0.360 |
| 平均 | 0.782 | 0.882 | 13.50 | 7.20 | 2.908 | 1.269 |
4 结论
本文根据深度学习模型的特点,构建OLSTM深度学习降尺度模型,基于2015—2019年的逐日降水数据和植被数据以及高程数据,对GPM降水产品订正,得到研究区的降水空间分布。通过降水实测值和降尺度结果的误差验证,得出如下结论:
1)从降水空间分布来看,降尺度结果与气象站降水数据的空间分布趋于一致,比GPM IMERG降水产品更能体现出闽浙赣地区的降水空间分布,气象站降水的最值区域与降尺度结果的最值区域相同; 从降水的时间分布来看,降尺度结果在1月17日,7月12日和10月16日与气象站降水具有一致性,1月17日降水都集中在浙江北部,7月12日降水全集中在福建地区沿海和南部地区,10月16日降水中心皆集中在江西西北部。
2)加密站验证表明,OLSTM降尺度模型在7月和10月的降水量表现较好,1月和4月相对较差,即在每月的降水量的相关系数大于0.7,说明该模型较为可靠。
3)个例年验证表明,OLSTM降尺度模型的空间降水估算方法效果良好,能够在一定程度上提升GPM产品的降水精度和空间分辨率,2020年降水数据经过降尺度后R在0.8以上,说明模型适用于闽浙赣区域。但是2020年降尺度结果有季节性区别,7月和10月拟合效果较好,1月和4月次之。主要原因是4月台风登陆南边沿海城市,带来的强降水使得GPM产品的捕捉降水能力减弱。
综上,本文提出的优化深度学习降尺度模型无论在日尺度还是月尺度都有较高的精度,且在时间和空间具有一定的普适性,后续将引入水汽含量、风向等其他降水因子,以期进一步提升深度学习降尺度模型的效果。
参考文献
Trends of temperature and precipitation extremes in the Loess Plateau region of China,1961—2010
[J].DOI:10.1007/s00704-016-1820-z URL [本文引用: 1]
Projected changes of precipitation extremes in river basins over China
[J].DOI:10.1016/j.quaint.2011.01.002 URL [本文引用: 1]
Changing spring phenology dates in the Three-Rivers Headwater region of the Tibetan Plateau during 1960—2013
[J].DOI:10.1007/s00376-017-6296-y [本文引用: 1]
Changing inland lakes responding to climate warming in Northeastern Tibetan Plateau
[J].DOI:10.1007/s10584-011-0032-x URL [本文引用: 1]
基于GPM卫星的广东汛期降水日变化特征与评估
[J].
Characteristics and evaluation of diurnal rainfall variation in rainy seasons in Guangdong based on GPM satellite
[J].
The global precipitation measurement mission
[J].
DOI:10.1175/BAMS-D-13-00164.1
[本文引用: 1]

Precipitation affects many aspects of our everyday life. It is the primary source of freshwater and has significant socioeconomic impacts resulting from natural hazards such as hurricanes, floods, droughts, and landslides. Fundamentally, precipitation is a critical component of the global water and energy cycle that governs the weather, climate, and ecological systems. Accurate and timely knowledge of when, where, and how much it rains or snows is essential for understanding how the Earth system functions and for improving the prediction of weather, climate, freshwater resources, and natural hazard events. The Global Precipitation Measurement (GPM) mission is an international satellite mission specifically designed to set a new standard for the measurement of precipitation from space and to provide a new generation of global rainfall and snowfall observations in all parts of the world every 3 h. The National Aeronautics and Space Administration (NASA) and the Japan Aerospace and Exploration Agency (JAXA) successfully launched the Core Observatory satellite on 28 February 2014 carrying advanced radar and radiometer systems to serve as a precipitation physics observatory. This will serve as a transfer standard for improving the accuracy and consistency of precipitation measurements from a constellation of research and operational satellites provided by a consortium of international partners. GPM will provide key measurements for understanding the global water and energy cycle in a changing climate as well as timely information useful for a range of regional and global societal applications such as numerical weather prediction, natural hazard monitoring, freshwater resource management, and crop forecasting.
Performance evaluation of metric measures for converting 30-min GPM rain data to 1-min for microwave applications in Tropical region of Nigeria:A multivariate approach
[J].DOI:10.1016/j.asr.2022.01.040 URL [本文引用: 1]
Correcting GPM IMERG precipitation data over the Tianshan Mountains in China
[J].DOI:10.1016/j.jhydrol.2019.06.019 URL [本文引用: 1]
闽浙赣地区GPM IMERG降水产品降尺度建模与比较分析
[J].
DOI:10.12082/dqxxkx.2019.180603
[本文引用: 1]
针对目前的技术手段下难以直接获得大范围高精度精细化降水空间分布的问题,本文以闽浙赣地区为研究范围,选用GPM IMERG降水产品,综合应用地面实测降水数据以及水汽与植被指数数据,基于地理加权回归(GWR)法构建了基于水汽因子的降尺度模型,同时基于最小二乘(OLS)法构建了基于水汽因子与植被指数的对比模型,将降水产品的分辨率从0.1°提升至1 km,最终获得2015年闽浙赣地区各月精细化降水空间分布,使用验证站点实测数据进行验证。结果表明:① 构建的 3个降尺度模型中,GWR模型与2种OLS模型相比,拟合优度分别提升了102.9%和93.9%,模型降尺度结果整体优于2种OLS模型,且月际差异小,稳定性更高;2种OLS模型中,采用了水汽因子的模型拟合效果有8个月份更优;② 融合多源数据的GWR降尺度模型获得的结果在研究区内是可靠的,与GPM降水产品相比,在提升空间分辨率的同时,平均相对误差与均方根误差月均分别下降了42%和32%,精度明显改善。
Downscaling modeling of the GPM IMERG precipitation product and comparative analysis in the Fujian-Zhejiang-Jiangxi region
[J].
太行山区遥感卫星反演降雨产品降尺度研究
[J].
DOI:10.11821/dlyj020190545
[本文引用: 1]
高时空分辨率降雨数据的获取对陆地水循环研究至关重要。遥感卫星反演降水产品虽然能有效再现降雨的空间格局,但存在空间分辨率较低的问题。以植被指数NDVI(Normalized Difference Vegetation Index)和海拔高度为自变量,通过构建太行山区GPM降水(Global Precipitation Measurement Mission)的时滞地理加权回归模型,得到了2014—2016年研究区1 km分辨率GPM降水数据。研究结果表明:利用植被指数和海拔高度构建的时滞地理加权回归模型能够有效地对太行山月尺度GPM降雨数据进行尺度下延,在提高GPM数据空间分辨率的同时保留了原始数据的观测精度。考虑NDVI的时滞性提高了地理加权回归模型的降尺度效果,相对于多元线性回归模型和不考虑NDVI时滞效应的地理加权回归模型,时滞地理加权回归模型的降尺度结果与站点实测数据的确定性系数更高,RMSE更低。冬季降雨与第二年春季植被NDVI的关系较为密切,虽然采用第二年春季的NDVI作为解释变量构建降尺度模型能有效地提高冬季降雨的降尺度效果,但基于植被指数和海拔高度构建的时滞地理加权回归模型更加适用于植被生长季GPM降雨数据的降尺度研究。
Spatial downscaling of remotely sensed precipitation in Taihang Mountains
[J].
DOI:10.11821/dlyj020190545
[本文引用: 1]
As a fundamental component in water circulation, the spatio-temporal pattern of precipitation is critical for terrestrial hydrological cycle simulation. The satellite-based precipitation can describe the spatial pattern of precipitation properly, but the relatively low spatial resolution of the product limited its application in terrestrial hydrological cycle simulation. By taking Taihang Mountains as an example, based on the relationship between precipitation, altitude and NDVI (Normalized Difference Vegetation Index), the monthly GPM (Global Precipitation Measurement Mission) data from 2014 to 2016 are disaggregated to 1-km resolution with a GWRDL model (Geographically Weighted Regression Model coupled with Distributed Lagging). The results showed that with the aid of the altitude and NDVI, the GWRDL model could effectively downscale monthly GPM data. The spatial resolution of downscaled GPM data was increased by the GWRDL model, and the accuracy of the original GPM data was retained at the same time. Compared with precipitation downscaled by the Geographically Weighted Regression Model and Multiple Linear Regression Model, the precipitation downscaled by GWRDL model has highest coefficients of determination (R2), lowest root mean square error (RMSE) and lowest mean absolute error (MAE) with the observed data, indicating that using NDVI in other months as explanatory variable is better than that using NDVI in current month, and this practice improved the downscaling algorithm and highlighted the accuracy of downscaled precipitation. Because the relationship between precipitation and NDVI was closer in the next spring than that in winter, using NDVI in the following 2-3 months (NDVI in next spring) as an explanatory variable in GWRDL model can improve precipitation downscaling precision in winter. Although the GWRDL model, which gives a consideration of time lagging of NDVI, has a better performance than GWR model in winter, it is more suitable for precipitation downscaling in vegetation growing stage than in winter. Compared with original GPM data, the coefficients of determination between downscaled GPM data and observed precipitation was averagely increased by 0.02 with GWRDL model in vegetation growing stage (April to October), which is higher than that in winter (0.002). Therefore, we suggest that the GWRDL model should be used in GPM downscaling in vegetation growing seasons.
River flow prediction in data scarce regions:Soil moisture integrated satellite rainfall products outperform rain gauge observations in West Africa
[J].
DOI:10.1038/s41598-020-69343-x
PMID:32719498
[本文引用: 1]
Satellite precipitation products have been largely improved in the recent years particularly with the launch of the global precipitation measurement (GPM) core satellite. Moreover, the development of techniques for exploiting the information provided by satellite soil moisture to complement/enhance precipitation products have improved the accuracy of accumulated rainfall estimates over land. Such satellite enhanced precipitation products, available with a short latency (< 1 day), represent an important and new source of information for river flow prediction and water resources management, particularly in developing countries in which ground observations are scarcely available and the access to such data is not always ensured. In this study, three recently developed rainfall products obtained from the integration of GPM rainfall and satellite soil moisture products have been used; namely GPM+SM2RAIN, PRISM-SMOS, and PRISM-SMAP. The prediction of observed daily river discharge at 10 basins located in Europe (4), West Africa (3) and South Africa (3) is carried out. For comparison, we have also considered three rainfall products based on: (1) GPM only, i.e., the Early Run version of the Integrated Multi-Satellite Retrievals for GPM (GPM-ER), (2) rain gauges, i.e., the Global Precipitation Climatology Centre, and (3) the latest European Centre for Medium-Range Weather Forecasts reanalysis, ERA5. Three different conceptual and lumped rainfall-runoff models are employed to obtain robust and reliable results over the 3-year data period 2015-2017. Results indicate that, particularly over scarcely gauged areas (West Africa), the integrated products outperform both ground- and reanalysis-based rainfall estimates. For all basins, the GPM+SM2RAIN product is performing the best among the short latency products with mean Kling-Gupta Efficiency (KGE) equal to 0.87, and significantly better than GPM-ER (mean KGE = 0.77). The integrated products are found to reproduce particularly well the high flows. These results highlight the strong need to disseminate such integrated satellite rainfall products for hydrological (and agricultural) applications in poorly gauged areas such as Africa and South America.
A fast learning algorithm for deep belief nets
[J].
DOI:10.1162/neco.2006.18.7.1527
PMID:16764513
[本文引用: 1]
We show how to use "complementary priors" to eliminate the explaining-away effects that make inference difficult in densely connected belief nets that have many hidden layers. Using complementary priors, we derive a fast, greedy algorithm that can learn deep, directed belief networks one layer at a time, provided the top two layers form an undirected associative memory. The fast, greedy algorithm is used to initialize a slower learning procedure that fine-tunes the weights using a contrastive version of the wake-sleep algorithm. After fine-tuning, a network with three hidden layers forms a very good generative model of the joint distribution of handwritten digit images and their labels. This generative model gives better digit classification than the best discriminative learning algorithms. The low-dimensional manifolds on which the digits lie are modeled by long ravines in the free-energy landscape of the top-level associative memory, and it is easy to explore these ravines by using the directed connections to display what the associative memory has in mind.
Long term rainfall forecasting by integrated artificial neural network-fuzzy logic-wavelet model in Karoon basin
[J].
Precipitation nowcasting with weather Radar images and deep learning in São Paulo,Brasil
[J].
DOI:10.3390/atmos11111157
URL
[本文引用: 1]
Precipitation nowcasting can predict and alert for any possibility of abrupt weather changes which may cause both human and material risks. Most of the conventional nowcasting methods extrapolate weather radar echoes, but precipitation nowcasting is still a challenge, mainly due to rapid changes in meteorological systems and time required for numerical simulations. Recently video prediction deep learning (VPDL) algorithms have been applied in precipitation nowcasting. In this study, we use the VPDL PredRNN++ and sequences of radar reflectivity images to predict the future sequence of reflectivity images for up to 1-h lead time for São Paulo, Brazil. We also verify the feasibility for the continuous use of the VPDL model, providing the meteorologist with trends and forecasts in precipitation edges regardless of the weather event occurring. The results obtained confirm the potential of the VPDL model as an additional tool to assist nowcasting. Even though meteorological systems that trigger natural disasters vary by location, a general solution can contribute as a tool to assist decision-makers and consequently issue efficient alerts.
机器学习在强对流监测预报中的应用进展
[J].
Advances in application of machine learning to severe convective weather monitoring and forecasting
[J].
基于深度学习的强对流高分辨率临近预报试验
[J].
High resolution nowcasting experiment of severe convections based on deep learning
[J].
利用长短时记忆网络的日长变化预报
[J].
Prediction of length-of-day variations by long short-term memory network
[J].
基于深度学习构建的全球电离层NmF2模型
[J].
A global ionospheric NmF2 model developed by deep learning
[J].
A novel reference-based and gradient-guided deep learning model for daily precipitation downscaling
[J].
DOI:10.3390/atmos13040511
URL
[本文引用: 1]
The spatial resolution of precipitation predicted by general circulation models is too coarse to meet current research and operational needs. Downscaling is one way to provide finer resolution data at local scales. The single-image super-resolution method in the computer vision field has made great strides lately and has been applied in various fields. In this article, we propose a novel reference-based and gradient-guided deep learning model (RBGGM) to downscale daily precipitation considering the discontinuity of precipitation and ill-posed nature of downscaling. Global Precipitation Measurement Mission (GPM) precipitation data, variables in ERA5 re-analysis data, and topographic data are selected to perform the downscaling, and a residual dense attention block is constructed to extract features of them. By exploring the discontinuous feature of precipitation, we introduce gradient feature to reconstruct precipitation distribution. We also extract the feature of high-resolution monthly precipitation as a reference feature to resolve the ill-posed nature of downscaling. Extensive experimental results on benchmark data sets demonstrate that our proposed model performs better than other baseline methods. Furthermore, we construct a daily precipitation downscaling data set based on GPM precipitation data, ERA5 re-analysis data and topographic data.
基于深度学习的新增建设用地信息提取试验研究——全国土地利用遥感监测工程创新探索
[J].
Research on new construction land information extraction based on deep learning:Innovation exploration of the national project of land use monitoring via remote sensing
[J].
基于主动深度学习的极化SAR图像分类
[J].
Active deep learning based polarimetric SAR image classification
[J].
基于系留无人机的应急测绘技术应用
[J].
Tethered UAVs-based applications in emergency surveying and mapping
[J].
面向对象结合深度学习方法的矿区地物提取
[J].
Surface features extraction of mining area image based on object-oriented and deep-learning method
[J].
中国东部植被NDVI对气温和降水的旬响应特征
[J].
Ten-day response of vegetation NDVI to the variations of temperature and precipitation in Eastern China
[J].
DOI:10.11821/xb200907009
[本文引用: 1]
<p>This paper analyzed the temporal and spatial responses of vegetation NDVI to the variations of temperature and precipitation in each ten-day period in the whole year, spring, summer and autumn covering 1998 to 2007 based on the SPOT VGT-NDVI data and daily temperature and precipitation data from 205 meteorological stations in eastern China. The results indicate that on the whole, the response of vegetation NDVI to the variation of temperature is greater than to that of precipitation in eastern China. Vegetation NDVI maximally responds to the variation of temperature with a lag of about 10 days, and it maximally responds to the variation of precipitation with a lag of about 30 days. The response of vegetation NDVI to temperature and precipitation is the greatest in autumn, and the lag time is longer in summer. Spatially, the maximum response of vegetation NDVI to the variation of temperature is greater in the northern and central parts than in the southern part of eastern China. The maximum response of vegetation NDVI to the variation of precipitation is greater in the northern part than in the central and southern parts of eastern China. There is more lag time of vegetation NDVI to the variation of temperature in the northern and southern parts, while less in the central part. The lag time of vegetation NDVI to the variation of precipitation gradually increases from the northern to the southern part according to the latitude. The response of vegetation NDVI to the variations of temperature and precipitation in eastern China is mainly consistent with other results obtained in eastern and southern China.</p>
中国区域地理、地形因子对降水分布影响的估算和分析
[J].
Estimation and analysis for geographic and orographic influences on precipitation distribution in China
[J].
Long short-term memory
[J].
DOI:10.1162/neco.1997.9.8.1735
PMID:9377276
[本文引用: 1]
Learning to store information over extended time intervals by recurrent backpropagation takes a very long time, mostly because of insufficient, decaying error backflow. We briefly review Hochreiter's (1991) analysis of this problem, then address it by introducing a novel, efficient, gradient-based method called long short-term memory (LSTM). Truncating the gradient where this does not do harm, LSTM can learn to bridge minimal time lags in excess of 1000 discrete-time steps by enforcing constant error flow through constant error carousels within special units. Multiplicative gate units learn to open and close access to the constant error flow. LSTM is local in space and time; its computational complexity per time step and weight is O(1). Our experiments with artificial data involve local, distributed, real-valued, and noisy pattern representations. In comparisons with real-time recurrent learning, back propagation through time, recurrent cascade correlation, Elman nets, and neural sequence chunking, LSTM leads to many more successful runs, and learns much faster. LSTM also solves complex, artificial long-time-lag tasks that have never been solved by previous recurrent network algorithms.
A review of recurrent neural networks:LSTM cells and network architectures
[J].
DOI:10.1162/neco_a_01199
URL
[本文引用: 1]
Recurrent neural networks (RNNs) have been widely adopted in research areas concerned with sequential data, such as text, audio, and video. However, RNNs consisting of sigma cells or tanh cells are unable to learn the relevant information of input data when the input gap is large. By introducing gate functions into the cell structure, the long short-term memory (LSTM) could handle the problem of long-term dependencies well. Since its introduction, almost all the exciting results based on RNNs have been achieved by the LSTM. The LSTM has become the focus of deep learning. We review the LSTM cell and its variants to explore the learning capacity of the LSTM cell. Furthermore, the LSTM networks are divided into two broad categories: LSTM-dominated networks and integrated LSTM networks. In addition, their various applications are discussed. Finally, future research directions are presented for LSTM networks.
GPM卫星降水数据在天山山区的适用性分析
[J].
DOI:10.11849/zrzyxb.20160057
[本文引用: 1]
卫星降水产品在山区的适用性具有较高的不确定性。论文基于天山山区2014—2015年167个气象站点数据,应用较为广泛的两套卫星降水产品——TRMM与CMORPH,选用均方根误差(RMSE)、相关系数(R)、相对误差(PB),以及分类统计分析指标(错报率FAR、探测率POD、公正先兆评分ETS、频率偏差BIAS)等,评估了新一代卫星降水产品——Global Precipitation Measurement(GPM)在天山山区的适用性。结果表明:相对于以上两种产品,GPM在山区的精度最高。具体表现在:1)3套产品在降水较多的夏秋季均表现较好,相对于TRMM与CMORPH,GPM与观测数据的相关系数最高(R≥0.6),相对误差最小(PB≈10%);2)在整个天山山区,GPM相对于其他两套产品表现出较低的误差范围(-55%~55%);3)GPM在不同的高程带内,均表现出同观测站点较低的误差与较高的相关系数;4)3套降水产品均表现出对探测弱降水事件较高的准确性(POD≈0.58)和较低的错误率(FAR≈0.63),但综合分析4种指数,GPM表现最佳,能够以较准确的精度和较低的误差估测降水系统。
The applicability evaluation of three satellite products in Tianshan Mountains
[J].
A novel approach to identify sources of errors in IMERG for GPM ground validation
[J].
DOI:10.1175/JHM-D-16-0079.1
URL
[本文引用: 1]
The comparison of satellite and high-quality, ground-based estimates of precipitation is an important means to assess the confidence in satellite-based algorithms and to provide a benchmark for their continued development and future improvement. To these ends, it is beneficial to identify sources of estimation uncertainty, thereby facilitating a precise understanding of the origins of the problem. This is especially true for new datasets such as the Integrated Multisatellite Retrievals for GPM (IMERG) product, which provides global precipitation gridded at a high resolution using measurements from different sources and techniques. Here, IMERG is evaluated against a dense network of gauges in the mid-Atlantic region of the United States. A novel approach is presented, leveraging ancillary variables in IMERG to attribute the errors to the individual instruments or techniques within the algorithm. As a whole, IMERG exhibits some misses and false alarms for rain detection, while its rain-rate estimates tend to overestimate drizzle and underestimate heavy rain with considerable random error. Tracing the errors to their sources, the most reliable IMERG estimates come from passive microwave satellites, which in turn exhibit a hierarchy of performance. The morphing technique has comparable proficiency with the less skillful satellites, but infrared estimations perform poorly. The approach here demonstrated that, underlying the overall reasonable performance of IMERG, different sources have different reliability, thus enabling both IMERG users and developers to better recognize the uncertainty in the estimate. Future validation efforts are urged to adopt such a categorization to bridge between gridded rainfall and instantaneous satellite estimates.
