

0 引言
自生态系统健康概念提出以来[4],国内外学者对生态系统健康相关问题展开了一系列研究,并取得显著成果。Schaeffer等[5]在1988年首次对生态系统健康量化评估进行研究; Rapport等[6-7]首先提出生态系统健康具有活力(vigor)、组织结构(organization)和弹力(resilience),而后又对生态系统健康的测量方法及公式进行探索。目前生态系统健康评价常用模型主要有活力—组织力—弹力(vigour-organization-resilience,VOR)模型、压力—状态—响应(pressure-state-response,PSR)模型,在PSR模型的基础上也产生了驱动力—状态—响应(drivingforce-state-response,DSR)模型以及驱动力—压力—状态—影响—响应(driving-pressure-state-impact-response,DPSIR)模型。其中VOR和PSR模型已被广泛运用于城市、区域、流域、荒漠草原、湿地等生态系统健康评估[8⇓⇓⇓⇓⇓⇓-15],取得了很好的应用效果,但在省域范围开展县级尺度的生态系统健康评估研究较少。安徽省作为长三角地区的重要一员,对其开展时间序列生态系统健康评估,对于长三角生态绿色一体化高质量发展具有重要意义。
因此,本文拟基于安徽省1980年、1990年、1995年、2000年、2005年、2010年、2015年7期土地利用数据,根据VOR模型建立安徽省生态系统健康评价体系,采用熵权法确定系统指标权重,在县级尺度上计算生态系统健康综合指数和划分等级,并在此基础上探讨安徽省县级尺度的生态系统健康时空演变特征,为安徽省未来的生态规划提供理论支持。
1 研究区概况与数据源
1.1 研究区概况
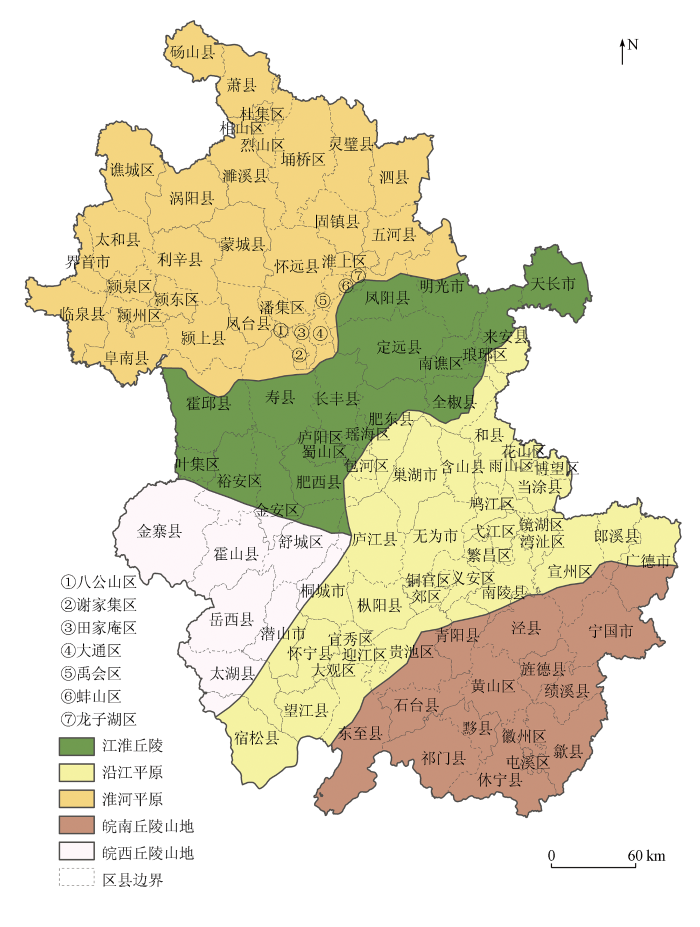
安徽省(图1)地理位置处于中国华东地区,位于长江、淮河中下游,是长三角地区重要组成部分,其位置于E114°54'~119°37',N29°41'~34°38'之间,重要地理分界线秦岭—淮河线横贯全省。安徽省地跨淮河、长江、新安江三大水系,由淮河平原区、江淮丘陵区、沿江平原区、皖西丘陵山地区、皖南丘陵山地区5个地貌区构成。安徽省气候分布差异明显,处于东亚季风区、亚热带与暖温带过渡区; 季风明显,四季分明,降水周期变化大。
图1
1.2 数据源及预处理
本文采用的1980年、1990年、1995年、2000年、2005年、2010年、2015年共7期安徽省土地利用类型栅格图的数据来源于国家地球系统科学数据中心黄河中下游分中心(
2 研究方法
2.1 生态系统健康评价指标体系
生态系统活力揭示了生态系统功能; 组织力根据景观格局的稳定性和连通性确定; 弹力是指在受到胁迫下维持自身结构和功能稳定的能力[17]。本文选择活力、组织力、弹力3个方面构成安徽省生态系统健康评价体系子系统,子系统下选取林/草地覆盖率C、香浓多样性(Shannon’s diversity index,SHDI)、蔓延度(contagion index,CONTAG)、平均斑块面积(mean patch area,MPS)、人类干扰指数IH、生境质量指数
表1 生态系统健康评价体系指标及其描述
Tab.1
| 评价子系统 | 评价指标 | 公式 | 描述 |
|---|---|---|---|
| 活力 | 林/草地覆盖率C(+) | 评价单元内林地、草地面积之和所占比例。其中Af为林地面积; Ag为草地面积; CA为评价单元总面积 | |
| 组织力 | SHDI (-) | m为景观类型数量; pi为评价单元内第i类景观类型所占面积的比例。SHDI值越大,表明该区域景观多样性较高 | |
| CONTAG(+) | gik为第i类景观类型与第k类景观类型毗邻的斑块数目。CONTAG反映区域优势地类的影响力,其值越大表明景观格局中存在的优势地类间连接程度强,景观破碎化程度低;反之值越小表明景观格局中存在多种小斑块,景观的破碎化程度高 | ||
| MPS(+) | NP为评价单元中斑块总数。MPS值越大为景观破碎度越低 | ||
| 人类干扰指数IH(-) | A1为评价单元中耕地总面积; A2为评价单元中建设用地总面积。IH值越大,人类活动对生态系统影响越大,对生态系统健康的破坏程度越大 | ||
| 弹力 | 生境质量指数Qxj(+) | Hj为生境类型j的栖息地适宜性,取值范围0~1; r为半饱和常数,取最大生境退化指数Dxj的一半; z为归一化常量,一般情况下设为2.5。其中Dxj为生境退化度[22]。当前景观上栖息地质量的相对水平,数字越大表明生境质量越好 |
为避免数据来源、类型等差异导致指标无法进行比较与计算,采用极差法[1]将指标各数据进行标准化处理,正、负向作用指标的公式分别为:
式中: Y为指标标准化值; X为指标实际值; Xmax和Xmin分别为指标观测数据中最大值和最小值。
2.2 生态系统健康评价指标权重
本文对于生态系统健康评价体系的指标权重确定采用熵权法[23],熵权法主要公式为:
式中: Yuv为第u个指标下第v个评价单元的指标标准化值; puv为第u个指标下第v个评价单元的指标值比重; eu为第u个指标的信息熵; t=1/ln(n),n为评价单元的总数; l为指标总个数; wu为第u个指标相对于子系统的权重。评价子系统的权重可用相同方法计算,不做赘述。
通过熵值的大小反映指标的差异,判断指标对于生态系统健康体系的影响程度进而确定权重。最终获取安徽省生态系统健康评价体系各指标权重(表2)。
表2 安徽省生态系统健康评价体系及权重
Tab.2
| 评价模型 | 评价子系统 | 相对于子系统 的权重值 | 相对于生态系统 健康评价体系 的权重值 |
|---|---|---|---|
| 生态系统 健康评价 | 活力(0.279 1) | 林/草地覆盖率(1.000 0) | 林/草地覆盖率(0.279 1) |
| 组织力 (0.485 3) | SHDI(0.238 8) | SHDI(0.115 9) | |
| CONTAG (0.157 4) | CONTAG (0.076 4) | ||
| MPS(0.171 0) | MPS(0.083 0) | ||
| 人类干扰指数(0.432 8) | 人类干扰指数(0.210 1) | ||
| 弹力(0.235 6) | 生境质量指数(1.000 0) | 生境质量指数(0.235 6) |
2.3 生态系统健康等级划分
生态系统健康评价是指在确定各指标权重基础上,对生态系统健康评价体系的各指标进行加权累加,计算安徽省生态系统健康综合指数[1],公式为:
式中: Fv为第v个评价单元的生态系统健康综合指数; Wu为第u个评价指标相对于子系统的权重;
表3 安徽省生态系统健康评价等级及相关描述
Tab.3
| 健康等级 | 综合指 数范围 | 健康水平描述 |
|---|---|---|
| 很健康(一级) | [0.8, 1.0] | 生态系统结构和多样性稳定,功能完整,生态系统恢复力很强,系统维持正常的循环与平衡,极少受到外界干扰 |
| 健康(二级) | [0.6, 0.8) | 生态系统结构与功能较为稳定,生态系统恢复力较强,受到一部分外界干扰,但没有影响其整体稳定性 |
| 亚健康(三级) | [0.4, 0.6) | 生态系统结构受到一定程度影响而发生改变,部分功能可以实现,受到一定程度的外界干扰,产生了一定污染 |
| 不健康(四级) | [0.2, 0.4) | 生态系统结构受到大幅度冲击,大部分功能丧失,生态系统恢复力大幅度下降,部分外界干扰已经造成了严重侵害 |
| 病态(五级) | [0.0, 0.2) | 生态系统结构崩溃,功能退化,系统难以维持正常的生命活动,外界干扰已经超过自身承载能力,系统受到严重污染 |
3 结果与分析
3.1 生态系统健康评价指标计算
图2
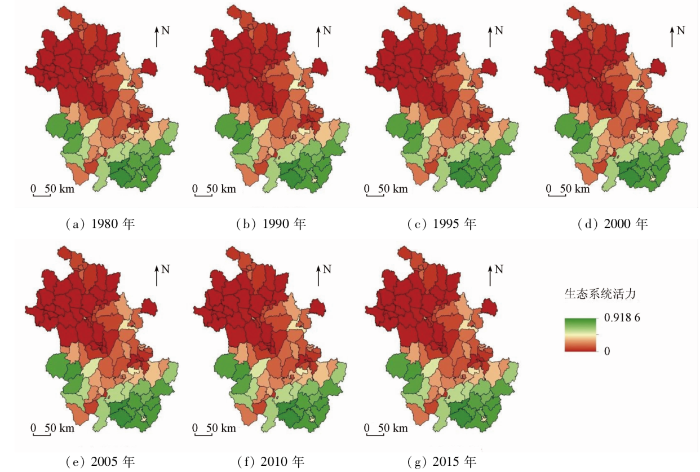
图3
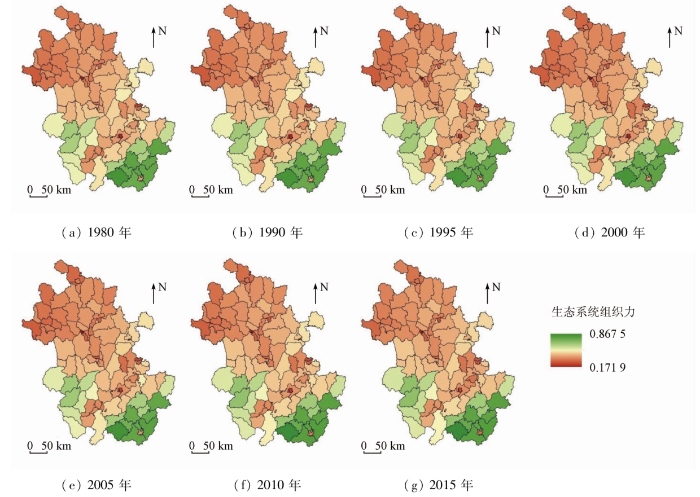
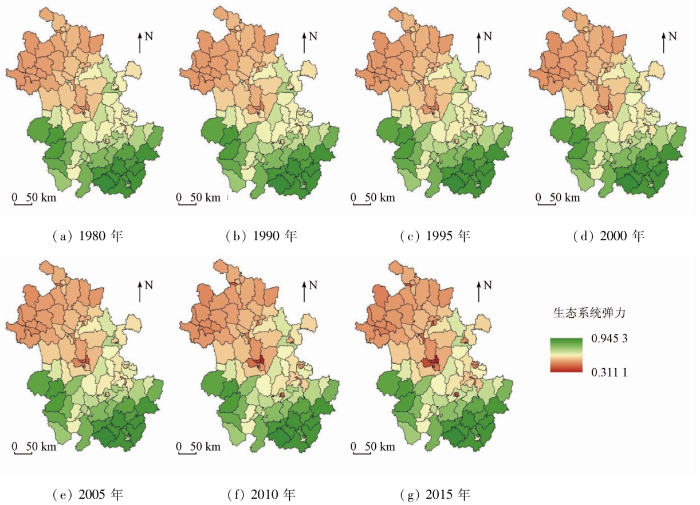
图4
生态系统活力可以反映出系统循环与能量输入效率[26]。由图2可以看出,1980—2015年黄山市整体生态系统活力水平最高,亳州市、阜阳市整体生态系统活力水平最低。从空间分布来看,安徽省生态系统活力水平较高的区域集中在皖南丘陵山地区和皖西丘陵山地区,而淮河平原区和江淮丘陵区生态系统活力较低,沿江平原区活力居中,空间差异明显。这种差异主要是由于地貌类型差异造成的,生态系统活力水平较高的区域对应山区,其林地和草地覆盖率高,这2种地类不易受人类活动干扰、有利于生态系统的物质循环,具有较高的生态活力; 而生态系统活力水平较低的区域对应平原区,土地类型以耕地为主,其生物多样性较低、易受人类活动而造成生态系统不同程度的破坏,因此生态系统活力水平较低。
生态系统组织力可以反映出系统复杂程度,系统越复杂,其组织结构与功能越复杂,其生态系统健康水平越高。由图3可以看出,在空间分布方面,安徽省北部地区生态系统组织力水平整体低于安徽省南部地区。这种差异主要是由于安徽北部耕地和建设用地面积比例要远大于安徽南部,而在生态系统组织力的指标构成中,人类干扰指数权重最大,也即耕地和建设用地比例越大,人类干扰指数越大,生态系统组织力越弱。其中,淮南市八公山区生态系统组织力水平最低,其平均值约为0.18; 黄山市祁门县生态系统组织力水平最高,其平均值约为0.84。
生态系统弹力可以反映出受到外界干扰的抵抗力和自我恢复能力。由图4可以看出,在空间分布方面,安徽省生态系统弹力变化存在较明显的南北差异。安徽省北部地区生态系统弹力整体处于较低水平,南部地区尤其是长江以南区域生态系统弹力水平较高,且状态较为稳定。主要原因是安徽省南方地区植被覆盖度高、生物多样性较高、抵抗人类活动干扰的能力较强,且生态系统稳定性强,很少发生大规模自然灾害,因此其生态系统弹力较强; 而安徽省北部地区耕地分布广泛,且耕地流失严重,因此生态系统弹力健康水平较低。
3.2 生态系统健康时空特征分析
3.2.1 空间格局特征分析
图5
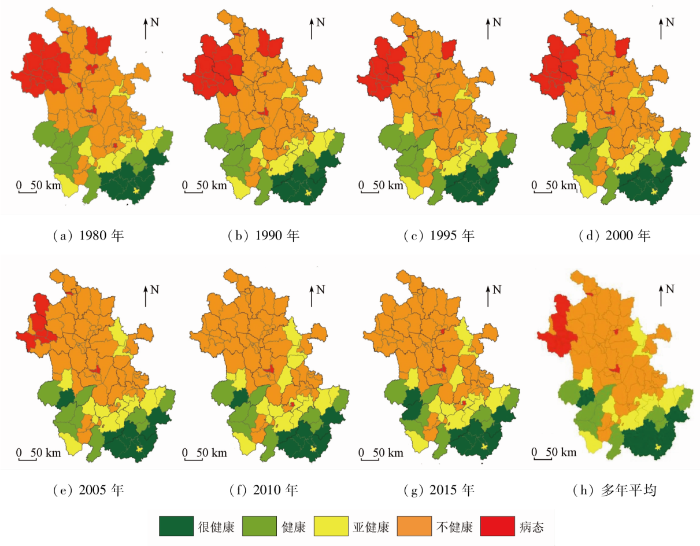
图5
安徽省1980—2015年生态系统健康等级与多年平均健康等级空间分布图
Fig.5
Spatial distribution of ecosystem health grades and multi-year average health grades in Anhui Province from 1980 to 2015
由图5可见,安徽省生态系统多年平均健康综合指数与多年平均健康等级空间分布整体呈现南高北低格局,且均与地貌类型有较强关联。健康和很健康等级的区县全部集中分布于皖西丘陵山地区和皖南丘陵山地区2类区域,亚健康等级区县也主要分布于这2类地貌类型区的边缘区县,且该2类地貌类型区无不健康和病态等级的区县分布。其他地貌类型区则以不健康等级和病态健康等级的区县为主。其中,不健康等级区县连片分布于淮河平原区、江淮丘陵区以及沿江平原区; 病态等级区县则集中分布于地处淮河平原区的阜阳市大部分区县和亳州市谯城区、淮北市相山区、蚌埠市龙子湖区,以及江淮丘陵区的合肥市庐阳区和瑶海区。此外,六安市因地处淮河平原区、江淮丘陵区、皖西丘陵山地区等多种地貌区,其所辖区县同时存在很健康、健康、亚健康、不健康4种不同健康等级,其中霍邱县耕地分布广泛,人类干扰指数约0.89、林/草地覆盖率约0.73%,MPS归一化值约0.35,SHDI值约0.50,CONTAG值约63.98,表明霍邱县的植被覆盖度低,耕地聚集度较高、连通性较强,易受人类活动的影响,生态系统组织结构不稳定,进而导致其生态系统健康水平较低; 而金寨县、霍山县海拔较高多山地丘陵,耕地分布较少,林/草地覆盖率80%以上,人类干扰指数均小于0.2,高覆盖度的林地使得该地区生物种类丰富、生物多样性增大,故其生态系统结构稳定、生态系统健康水平高。
2015年,在全省104个县级行政区中,很健康、健康、亚健康、不健康和病态各等级的区县数量分别为11个、8个、16个、65个和4个,数量占比分别为10.58%,7.69%,15.38%,62.50%和3.85%,面积占比分别为13.46%,12.89%,16.83%,56.37%和0.46%。无论是区县数量还是面积,均以不健康等级为主,亚健康等级次之。其中,合肥市庐阳区生态系统健康综合指数最低,约0.17,主要是由于庐阳区以人类活动为主,人类干扰指数约0.87,SHDI值约0.67,CONTAG值约56.65,平均斑块面积归一化值约0.18,表明该地区人类活动影响强度大,生物多样性较低,生态系统组织结构不稳定,景观破碎化程度深,进而生态系统健康水平较低。黄山市祁门县生态系统健康水平最高,达到0.92,是由于其人类干扰指数小于0.1,SHDI平均值约0.48,CONTAG值约69.11,林/草地覆盖率大于90%,生境质量指数约0.94,表明该地区植被覆盖度高,生境质量水平高,优势地类即林/草地的聚集度高,且不易受人类活动干扰,故生态系统健康水平较高。
3.2.2 时间演变特征分析
基于图5统计各时期安徽省不同健康等级的面积,得到安徽省1980—2015年生态系统健康各等级面积变化图(图6)。由图6(a)可以看出,1980—2015年安徽省平均生态系统健康综合指数由0.37提升至0.40,使得安徽省整体的平均健康等级由不健康提升至亚健康。其中,阜阳市临泉县、阜南县和亳州市利辛县的生态系统健康综合指数提升最大,均提升了0.07,增幅分别为47.94%,43.69%和41.57%。尽管整体平均的健康综合指数有所提升,但依然有蚌埠市龙子湖区,滁州市琅琊区、南谯区,合肥市包河区、庐阳区,黄山市徽州区、屯溪区,马鞍山市雨山区,铜陵市铜官区,芜湖市繁昌区、鸠江区、弋江区,以及宣城市广德市等13个区县的健康综合指数下降,表明这些区域的生态系统健康水平不稳定,健康等级有下降风险。其中,综合指数下降最多的区县分别为黄山市屯溪区下降0.06,马鞍山市雨山区下降0.04,芜湖市繁昌区下降0.03。
图6
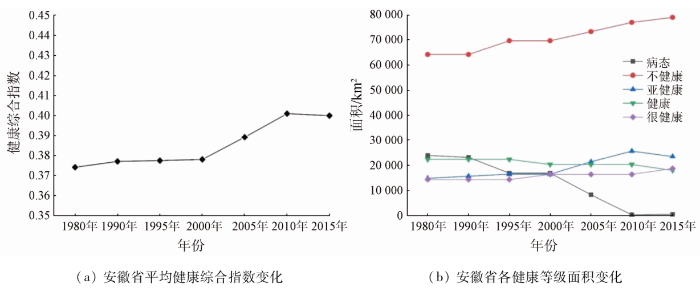
图6
安徽省1980—2015年生态系统平均健康综合指数与健康等级面积变化图
Fig.6
Changes in the average ecosystem health integrated index and the area of health grade in Anhui Province, 1980—2015
结合图5和图6(b)可以看出,1980—2015年安徽省生态系统各健康等级的面积发生了不同程度的变化,整体表现为安徽省生态系统健康等级逐渐提升。经统计,共24个区县健康等级上升,无区县健康等级下降。生态系统病态等级转化为不健康等级的区县数为17个,转化面积高达23 367.85 km2,安徽淮河平原区基本实现病态等级区县清零,仅剩蚌埠市龙子湖区尚为病态等级。其中,阜阳市、亳州市健康等级实现整体提升,由1980年的全域病态等级提升为2015年的全域不健康等级; 淮北市相山区、蚌埠市淮上区、淮南市田家庵区及宿州市灵璧县、泗县也由病态等级提升至不健康等级。不健康等级转化为亚健康等级的区县数为5个,分别为滁州市明光县、六安市裕安区、合肥市巢湖市及铜陵市枞阳县和义安区,转化面积达8 624.73 km2。无亚健康等级区县转为健康等级。健康等级转化为很健康等级的区县数为2个,分别为六安市霍山县和安庆市岳西县,转化面积为4 410.82 km2。
4 结论与讨论
本文基于安徽省1980—2015年时间序列土地利用类型数据,根据“活力—组织力—弹力”(VOR)模型构建安徽省生态系统健康评价体系,分析安徽省生态系统健康时空演变特征,结论如下:
1)在空间格局方面,安徽省不健康等级区县最多,亚健康等级区县次之,面积占比分别为56.37%和16.83%; 安徽省生态系统多年平均健康综合指数与多年平均健康等级空间分布整体呈现南高北低格局,且均与地貌类型有较强关联。安徽省皖南丘陵山地区和皖西丘陵山地区2个地貌区整体健康水平始终优于其他地区,健康和很健康等级区域集中分布于此2个区域,亚健康等级区县也主要分布于这2个地貌区边缘。黄山市祁门县生态系统健康综合指数高达0.92,为县级最高生态系统健康水平。病态等级区县集中分布于淮河平原区的阜阳市大部分区县和亳州市谯城区、淮北市相山区、蚌埠市龙子湖区,以及江淮丘陵区的合肥市庐阳区和瑶海区,其中合肥市庐阳区生态系统健康综合指数约0.17,为县级最低生态系统健康水平。
2)在时间演化方面,1980—2015年安徽省整体的生态系统健康等级逐渐提升,共24个区县健康等级上升,无区县健康等级下降; 全省平均生态系统健康综合指数由0.37提升至0.40,使得全省整体平均健康等级由不健康提升至亚健康。其中,阜阳市、亳州市实现了由全域病态等级到全域不健康等级的整体提升,阜阳市临泉县、阜南县和亳州市利辛县生态系统健康综合指数提升最大。但依然还有13个区县的健康综合指数下降,下降最多的区县分别为黄山市屯溪区、马鞍山市雨山区和芜湖市繁昌区,表明这些区域的生态系统健康水平不稳定,健康等级有下降风险。
本文在县级尺度开展了安徽省时间序列生态系统健康时空演变分析。结论认为安徽省生态系统健综合逐渐提高,但部分地区依然存在健康等级下降风险,且目前安徽省整体以不健康等级的区县为主。因此,应在重点关注部分区县健康综合指数下降的前提下,逐步提升不健康等级区域的生态系统活力、组织力和弹力,进而提升安徽省生态系统整体健康水平的。研究结论对安徽省制定合理的土地利用政策、保护治理生态环境、优化生态系统服务功能等具有一定参考价值。
参考文献
基于PSR模型的陕西省土地生态系统健康评价
[J].
DOI:10.13287/j.1001-9332.202105.013
[本文引用: 3]

基于“压力-状态-响应”(PSR)模型和熵值法对陕西省十市一区的土地生态系统健康状况进行诊断,分析了2009—2017年间土地生态系统健康等级时空变化趋势,以及影响土地生态系统健康变化的驱动因素。结果表明: 2009—2017年间,陕西省土地生态系统健康水平整体提升,其中,2009—2014年间土地生态系统健康程度较低,2014年后健康状况得到明显改善。西安市、宝鸡市、渭南市和汉中市土地生态系统健康等级高且变化幅度大,延安市、榆林市、安康市土地生态系统健康等级较低且变化幅度小,整体呈陕南地区>关中地区>陕北地区。总体来看,陕西省土地生态系统的压力、状态和响应指数均有所增长,但增速趋缓,2014年以后基本趋于平缓,表明在2014—2017年陕西省土地生态系统处于稳定的健康状态。人口增长、城市化水平、单位耕地化肥负荷、森林覆盖率、工业废水排放达标率和工业固体废物综合利用率是影响陕西省土地生态系统健康变化的主要驱动因素。控制化肥农药使用量、优化土地利用结构和提高土地利用效率是陕西省推进生态文明建设、落实生态保护红线的必要措施。
Evaluation of land ecosystem health in Shaanxi Province,Northwest China based on PSR Model
[J].
城市景观格局演变的生态环境效应研究进展
[J].
Eco-environmental effects of urban landscape pattern changes:Progresses,problems,and perspectives
[J].DOI:10.5846/stxb URL [本文引用: 1]
区县生态系统健康评价方法——以东莞市各镇区为例
[J].
County ecosystem health assessment:A case study of 32 counties in Dongguan City,China
[J].
Ecosystem health:I.measuring ecosystem health
[J].DOI:10.1007/BF01873258 URL [本文引用: 1]
What constitutes ecosystem health?
[J].DOI:10.1353/pbm.1990.0004 URL [本文引用: 1]
Assessing ecosystem health
[J].DOI:10.1016/S0169-5347(98)01449-9 URL [本文引用: 1]
Research note:Ecosystem Health (EH) assessment of a rapidly urbanizing metropolitan city region of eastern India:A study on Kolkata Metropolitan area
[J].DOI:10.1016/j.landurbplan.2020.103938 URL [本文引用: 1]
Temporal-spatial change of China’s coastal ecosystems health and driving factors analysis
[J].DOI:10.1016/j.scitotenv.2022.157319 URL [本文引用: 1]
VOR、CVOR指数在宁夏干旱风沙区荒漠草原健康评价中的应用——以盐池县为例
[J].
DOI:10.11733/j.issn.1007-0435.2018.03.009
[本文引用: 1]
本研究运用VOR和CVOR生态系统健康评价模型,结合Patrick多样性指数、Simpson优势度指数、Shannon-Wiener丰富度指数和Alatalo均匀度指数,对宁夏干旱风沙区荒漠草原的生态系统恢复状况进行了评估。结果表明:盐池县荒漠草原各监测点Patrick多样性指数均高于20,盐池县南部高于中部和北部。各监测点Simpson优势度指数、Shannon-Wiener丰富度指数和Alatalo均匀度指数均存在显著差异(P<0.05)。恢复力(R)与VOR指数极显著正相关(P<0.01),草地基况(C)、组织力(O)和恢复力(R)与CVOR指数极显著正相关(P<0.01)。VOR指数和CVOR指数对盐池县中部和南部草地健康状况评价结果一致,为“健康”状态,VOR指数评价北部草地处于“不健康”状态,CVOR指数评价为“警戒”状态,盐池县北部草地恢复工作有待加强。
Application of VOR and CVOR index for health assessment of desert steppe in ningxia:Taking Yanchi County for example
[J].
Ecosystem health assessment based on pressure state response framework using remote sensing and geographical information system
[J].
DOI:10.1088/1755-1315/767/1/012038
[本文引用: 1]
Ecosystem health (EH) is an important parameter for an areas sustainable development. This research work used remote sensing and GIS based ecological indicators under pressure-state-response (PSR) framework for ecological health assessment. Total 15 indicators were developed, from that 12 and 3 indicators were categorized for pressure and state indicators. Finally derive ecosystem health in Samara region, Russia under PSR framework, which provide an important decision making support for regional sustainable development with highly accurate new technology and can use for regular environmental mapping and monitoring.
Assessment of wetland ecosystem health using the pressure-state-response (PSR) model:A case study of mursidabad district of West Bengal (india)
[J].
DOI:10.3390/su12155932
URL
[本文引用: 1]
Wetlands are essential for protein production, water sanctification, groundwater recharge, climate purification, nutrient cycling, decreasing floods and biodiversity preservation. The Mursidabad district in West Bengal (India) is situated in the floodplain of the Ganga–Padma and Bhagirathi rivers. The region is characterized by diverse types of wetlands; however, the wetlands are getting depredated day-by-day due to hydro-ecological changes, uncontrolled human activities and rapid urbanization. This study attempted to explore the health status of the wetland ecosystem in 2013 and 2020 at the block level in the Mursidabad district, using the pressure–state–response model. Based on wetland ecosystem health values, we categorized the health conditions and identified the blocks where the health conditions are poor. A total of seven Landsat ETM+ spaceborne satellite images in 2001, 2013 and 2020 were selected as the data sources. The statistical data included the population density and urbanization increase rate, for all administrative units, and were collected from the census data of India for 2001 and 2011. We picked nine ecosystem indicators for the incorporated assessment of wetland ecosystem health. The indicators were selected considering every block in the Mursidabad district and for the computation of the wetland ecosystem health index by using the analytical hierarchy processes method. This study determined that 26.92% of the blocks fell under the sick category in 2013, but increased to 30.77% in 2020, while the percentage of blocks in the very healthy category has decreased markedly from 11.54% to 3.85%. These blocks were affected by higher human pressure, such as population density, urbanization growth rate and road density, which resulted in the degradation of wetland health. The scientific protection and restoration techniques of these wetlands should be emphasized in these areas.
基于景观格局分析的雄安城市湿地生态健康评价
[J].
Ecological health assessment of urban wetland in Xiong’an based on landscape pattern
[J].
Indicator system construction and health assessment of wetland ecosystem:Taking Hongze Lake Wetland,China as an example
[J].DOI:10.1016/j.ecolind.2020.106164 URL [本文引用: 1]
安徽省土地利用数据(1980、1990、1995、2000、2005、2010、2015年)
[EB/OL].
Land use data of Anhui Province (1980—2015)
[EB/OL].
基于土地利用变化的福建省生境质量时空变化研究
[J].
Temporal and spatial changes in habitat quality based on land-use change in Fujian Province
[J].
基于INVEST模型的洞庭湖区土地利用景观格局对生境质量的影响研究
[J].
Research on the impact of land use and landsacpe pattern on habitat quality in Dongting Lake area based on INVEST model
[J].
基于生境质量的城市增长边界研究——以长三角地区为例
[J].
DOI:10.13249/j.cnki.sgs.2017.01.004
[本文引用: 1]
基于“生态优先”理念,提出一种利用生境质量评估策略的城市增长边界划定方法。结合ArcGIS和InVEST模型,通过综合评估生境自身及其在威胁情境下的质量,模拟各市独立规划、建设用地指标再分配及区域一体化发展的三类建设用地扩张情景,分别划定2024和2034年的长三角地区城市增长边界。结果表明:研究区生境质量总体呈南高北低格局,平均生态系统服务价值密度为10 770.604元/(hm<sup>2</sup>·a),高质生境位于西南地区;根据指标再分配及一体化发展情景模拟的2024年研究区建设用地总量分别为10 583.273 km2和10 489.090 km2,2034年达到13 603.535 km2和13 252.370 km2;模拟的建设用地集中在东部沿海地区,并向北部及环杭州湾区域拓展;建设用地指标再分配能从整体上减少建设用地对优质生境的占用,区域一体化发展则能进一步降低城市发展造成的生态压力。
Urban growth boundary based on the evaluation of habitat quality:Taking the Yangtze River Delta as an example
[J].
DOI:10.13249/j.cnki.sgs.2017.01.004
[本文引用: 1]
The world’s natural ecosystem provides products of 15 trillion pounds annually, but with the universal urban expansion caused by economic development, ecological balance is gradually disrupted. Therefore, it’s critical to maintain ecosystem stability in the identification of urban growth boundary, which is regarded as an effective tool to control urban sprawl. However, very few methods, currently, have taken ecosystem into their account. With the concept that “ecology goes first”, this article put forward a method to identify the urban growth boundary based on the evaluation of habitat quality. Using the platform of ArcGIS and InVEST model, two aspects of habitat quality were considered in the assessment: the quality of habitat itself and the quality under threats. As a representative of the former quality, ecosystem service value of each cell was calculated. As to the latter one, InVEST model was used to assess cells’ threatened degree. In the prediction of the amount of future construction land, three scenarios were developed. The first scenario was based on the assumption that cities had separate development and urban planning. The second scenario assumed that in spite of the separate planning, it’s possible to conduct the redistribution of construction land index. The third scenario ignored the boundaries of administrative jurisdiction and regarded the study area as a single. By selecting districts with lower habitat quality as construction land, the simulated urban growth boundary of the Yangtze River Delta in 2024 and 2034 were determined. The conclusions showed that habitat quality in the south of the Yangtze River Delta was overall higher than that in the north and the average density of ecosystem service values was 10 770.6 yuan/(hm2?yr). Habitat with higher quality was located in the southwest area, while the lower one was in the eastern district and Round Hangzhou Bay. By 2024, the predicted quantity of construction land have been to 10 583.27 km2 (scenario 1 and 2) and 10 489.09 km2 (scenario 3), and then have been to 13 603.53 km2 (scenario 1 and 2) and 13 252.37 km2 (scenario 3) by 2034. East coastal area would be the center of construction land, and the northern districts and Round Hangzhou Bay were considered to be the main expansion area. In order to avoid the occupation of construction land on habitats with higher quality as a whole, 9 cities were classified as emigration region of construction land index, and 5 cities were categorized as immigration area, and the left 2 cities were transition regions. Moreover, regional integration of the Yangtze River Delta could also helpfully mollify the contradictions between urban development and ecological protection. Policy recommendations on the identification of urban growth boundary were proposed at the end, while possible innovations and inadequacies of this article were also concluded.
长沙都市区生境质量对城市扩张的时空响应
[J].
DOI:10.18306/dlkxjz.2018.10.004
[本文引用: 1]
生境质量是评价生态环境的重要指标,掌握其对城市扩张的时空响应规律,有助于提升都市区城乡规划质量和生态管控的合理性。本文在运用InVEST模型对长沙都市区1995-2015年生境质量时空演化的基本特征进行分析的基础上,利用缓冲区由内向外逐层剖析,探讨长沙都市区近20年来城市扩张格局及其对生境质量的影响。结果表明:①长沙都市区建设用地面积从170.26 km<sup>2</sup>增至487.19 km<sup>2</sup>;三环线以内建设用地快速扩张,从三环线起向外扩张逐渐放缓;②生境质量中等及以上的区域占比从1995年的43.49%下降到2015年的27.22%,生境质量平均值则相应地从0.46下降到0.31,且退化最明显的区域从核心外围区(5-10号缓冲区)外移到三环线附近(10-15号缓冲区);③各圈层建设用地扩张强度与生境质量变化之间存在显著的空间负相关性,生境质量变化对城市扩张响应最强烈的区域始终位于核心外围区;④建设用地空间布局零散和几何形态不规则程度的增加加剧了生境质量的退化,并在三环线附近区域(10-15号缓冲区)表现最为明显,应成为未来长沙都市区城乡规划和生态管控的重点区域。
Spatiotemporal responses of habitat quality to urban sprawl in the Changsha metropolitan area
[J].
DOI:10.18306/dlkxjz.2018.10.004
[本文引用: 1]
Observing the spatiotemporal responses of habitat quality—an important indicator for ecological environment assessment—to urban sprawl will help improve the quality of urban planning and ecological control. This study respectively analyzed habitat quality of the Changsha metropolitan area from 1995 to 2015 using the InVEST Habitat Quality Model, and revealed the characteristics of the spatiotemporal evolution based on the buffers created by the third ring road. The results show that: (1) The area of construction land in the Changsha metropolitan area increased from 170.26 km2 to 487.19 km2, which expanded rapidly within the third ring road and gradually slowed outside. (2) Areal proportion of average or above habitat quality levels decreased from 43.49% in 1995 to 27.22% in 2015, and the average level of habitat quality accordingly dropped from 0.46 to 0.31. The most seriously degraded area has shifted from the outer core area (buffer No.5 to No.10) to areas near the third ring road (buffer No.10 to No.15). (3) There is a significant negative spatial correlationship between urban sprawl intensity and habitat quality change across all buffers. The strongest response to urban sprawl in habitat quality change remains in the outer core area. (4) The degradation of habitat quality was exacerbated by the increasing degree of scattered layout pattern and irregular geometrical morphology of construction land and the areas near the third ring road (buffer No.10 to No.15) showed the most significant change. These areas should become the focus area of urban planning and ecological control in the future.
基于土地覆被变化的安徽省生境质量时空演变特征
[J].
Spatio-temporal evolution characteristics of habitat quality based on land cover change in Anhui Province
[J].
InVEST 3.9.0 user’s guide:Integrated valuation of environmental services and tradeoffs
[EB/OL].
基于DPSIR模型的长三角城市群生态安全评价研究
[J].
Urban eco-security assessment in the urban agglomerations based on DPSIR model:A case study of Yangtze River Delta,China
[J].
基于土地利用空间格局的区域生态系统健康评价——以舟山岛为例
[J].
Regional ecosystem health assessment based on land use pattern:A case of study of Zhoushan Island
[J].DOI:10.1016/j.chnaes.2010.08.003 URL [本文引用: 1]
区域生态系统健康评价——研究方法与进展
[J].
Evaluation for regional ecosystem health:Methodology and research progress
[J].DOI:10.1016/S1872-2032(08)60009-8 URL [本文引用: 1]
