

0 引言
土地利用/土地覆盖(land use/land cover,LULC)变化是全球环境变化的重要一环,也是地理学研究的热点。土地利用过程模拟是土地变化研究的重要内容之一,它是探讨土地利用驱动机制、支持城市规划和评估LULC变化对生态环境影响的重要工具[1]。截至目前,不同的机构和学者研制了大量的LULC模拟模型,如元胞自动机-马尔科夫模型[2](cellular automata-Markov,CA-Markov)、局部土地利用竞争-元胞自动机模型[3](local land use competition cellular automata,LLUC-CA)、土地变化模型[2](land change modeler,LCM)、土地利用转换及其影响模型(conversion of land use and it effects,CLUE)/小尺度土地利用转换及其影响模型[4-5](conversion of land use and it effects at small regional extent,CLUE-S)、未来土地利用模拟模型[6](future land use simulation,FLUS)、斑块生成土地利用模拟模型[7] (patch-generating land use simulation,PLUS)等。上述模型在模拟不同区域未来的LULC空间格局方面表现出众,众多学者基于这些模型取得了很好的效果[8⇓-10]。例如Darvishi等[11]通过集成多层感知器神经网络(multi-layer perceptron neural network,MLPNN)和Markov链模拟伊朗东北部2018年的LULC空间格局,其Kappa系数大于0.72。林伊琳等[12]通过FLUS模型模拟滇中城市群的国土空间分布格局,其总体精度为98.07%。崔旺来等[13]使用CA-Markov模型预测浙江大湾区2015年的土地利用状况,其精度高达0.90。
尽管LULC模拟模型众多,但不同的模型由于模拟的机理存在差异,其模拟精度不一。如林丽等[14]认为LCM模型在模拟勐腊县LULC方面性能优于CA-Markov,CLUE-S和FLUS模型; 杨济达等[15]指出在西双版纳橡胶林监测中,GEOMOD模型效果略高于CA-Markov; Yang等[3]表明在国家旅游度假区的LULC模拟中,LLUC-CA 模型的模拟精度高于CA-Markov; 陈柯欣等[16]认为,在相同的驱动力影响下,基于CA-Markov模型的黄河三角洲湿地模拟效果好于LCM模型; Wang等[17]认为用于北京市西城区LULC空间分布预测模型中,PLUS模型比FLUS模型更准确。综上,不同的研究区适用的LULC模拟模型略有差异。因此,在进行某一特定区域的LULC模拟研究时,尽可能对比不同LULC模拟模型的精度,并从中筛选出模拟效果最好的模型,这对于后续的研究至关重要。
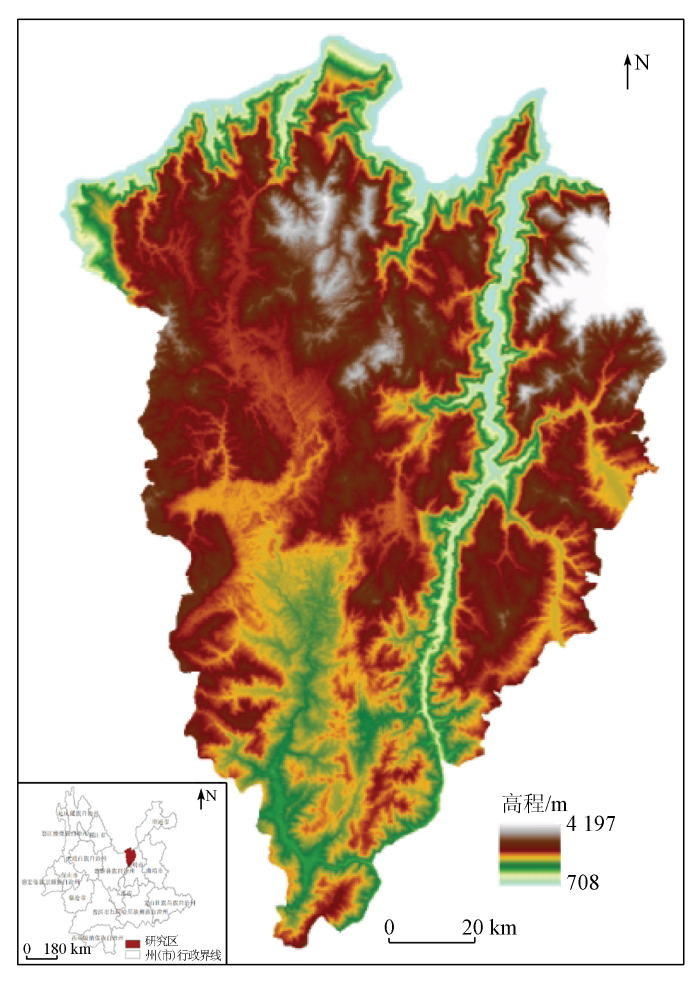
云南省禄劝彝族苗族自治县是集革命老区、民族地区、高寒山区、生态涵养区和地质灾害隐患区为一体的综合体,是云南省昆明市主要的水源地和生态涵养示范区,享有“春之源”、“水之源”的美誉[18]。近几十年来,云龙水库的建设以及禄劝县经济的快速发展,导致了禄劝县LULC变化剧烈。基于谷歌地球引擎(Google Earth Engine,GEE)云平台提取禄劝县1991年、1997年、2003年、2009年、2015年和2021年高精度的LULC信息,并分析其时空演变特征; 利用随机森林模型探究LULC变化的驱动因素; 从模拟精度、面积一致性、空间位置一致性和景观破碎度几方面对比CA-Markov,LCM,FLUS和PLUS 4种模型模拟禄劝县2021年LULC的效果,最后从上述4种模型中选择模拟效果最好的模型预测禄劝县2027年的LULC状况,为禄劝县国土空间规划提供科学参考。
1 研究区概况与数据源
1.1 研究区概况
图1
1.2 数据源及其处理
1.2.1 LULC数据
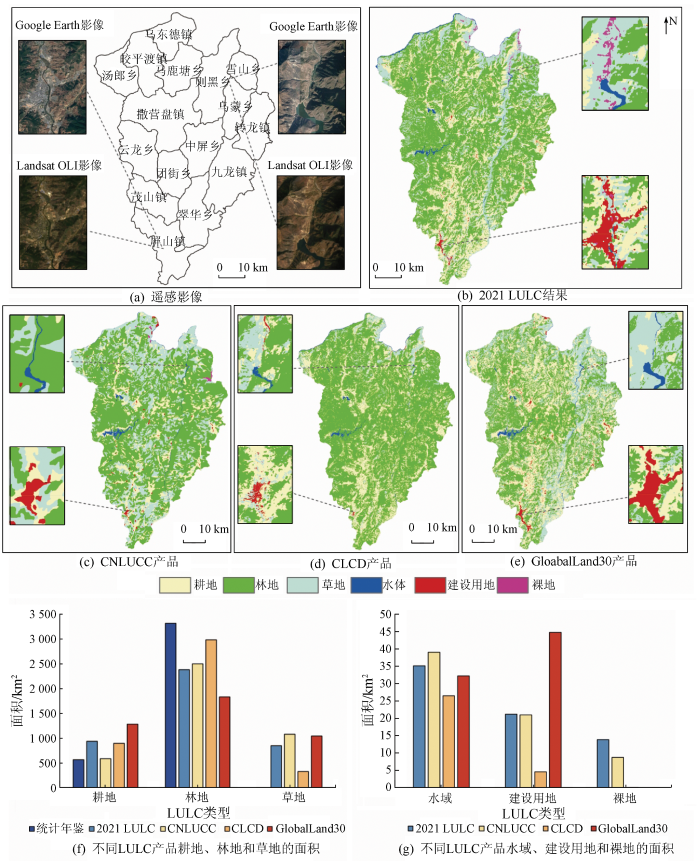
LULC数据源自GEE平台上的Landsat TM和OLI影像,根据前人研究成果[20-21],其分类体系定义为以下6种类型: 耕地、林地、草地、水体、建设用地和裸地。首先利用GEE平台的时间和空间过滤器选择禄劝县1991—2021年的6期遥感影像,其中1991年、1997年、2003年、2009年的LULC数据源于Landsat TM影像,2015和2021年的LULC数据源自Landsat OLI影像。通过该平台集成的算法对每期原始影像进行合成、裁剪、去云等操作,得到年度最小云量的影像,并基于同期影像和数字高程模型(digital elevetion model,DEM)提取归一化植被指数(normalized differonce vegetation index,NDVI)、归一化建筑指数(normalized difference built-up index,NDBI)、归一化水体指数(normalized difference water intex,NDWI)、坡度和高程这5个光谱特征和地形特征以辅助分类。基于人工目视解译,通过Landsat影像及Google Earth高清影像选取LULC分类样本点,并按照7∶3的比例设置训练样本和验证样本数量。最后利用随机森林算法提取禄劝县1991—2021年的LULC数据集。1991—2021年禄劝县LULC数据的总体精度分别为0.92,0.93,0.94,0.94,0.92和0.90; Kappa系数分别为0.87,0.88,0.91,0.91,0.87和0.84。
由于CNLUCC,CLCD和GlobalLand30这3种LULC产品的空间分辨率都是30 m且精度较高,将禄劝县2021年LULC分类结果与统计年鉴及上述3种产品进行比较,这几种LULC产品详细介绍请参考徐新良等[22]、Jun等[23]和Chen等[24]的研究。从LULC的空间格局来看(图2(a),2(b),2(c),2(d),2(e)),禄劝县2021年LULC产品与CLCD和GlobalLand30这2种产品具有较强的空间一致性,而与CNLUCC的空间差异较大。通过Landsat OLI影像和Google Earth高清影像对禄劝县县城以及云龙水库两处典型地区进行细节对比可以看出,在4种LULC产品中,禄劝县2021年的LULC分类结果更接近实际情况,它保持了地物的细节特征并精确提取出了裸地。从LULC的面积来看(图2(f),2(g)),CNLUCC的耕地面积和CLCD的林地面积与统计年鉴结果最接近。禄劝县2021年LULC产品的耕地面积略高于统计年鉴,而林地面积则略低于统计年鉴结果,草地和水域的面积与GlobalLand30最为接近,建设用地和裸地的面积与CNLUCC接近。特别说明: 由于在统计年鉴中只找到耕地和林地的实际面积,因此仅有以上2种地类的面积与统计年鉴结果进行比较。综上,本研究提取得到的禄劝县LULC产品其分类精度、空间一致性都优于常见的3种LULC产品,且耕地和林地的面积与统计年鉴的差距不大,满足研究要求。
图2
1.2.2 驱动因子数据
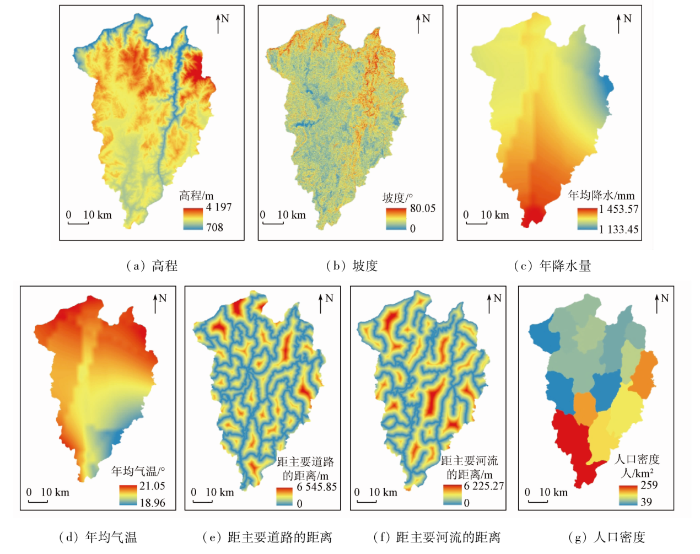
LULC变化受地形、气候、人类活动等多种因素的影响,考虑到数据获取难度、禄劝县实际情况以及先前研究[25-26],从社会经济和自然驱动2方面选取了高程、坡度、年均温度、年均降水、距主要道路的距离、距主要河流的距离和人口密度7个LULC变化驱动因子(图3)。高程和坡度从30 m的ASTER GDEM数据中提取(
图3
2 研究方法
2.1 基于随机森林模型的驱动因素分析
式中: p为变量个数; b为样本个数; MSEj 为第j个样本的残差均方; Se为标准误差; i的取值范围为[1, p]。
2.2 CA-Markov模型
2.3 LCM模型
2.4 FLUS模型
FLUS模型是由刘小平教授团队在CA模型中开发了一种自适应惯性和竞争机制,以处理不同LULC类型之间复杂的竞争和相互作用[6]。FLUS模型主要分2阶段,一是基于某一时期的LULC数据及其驱动因子,采用人工神经网络算法(artificial neural network,ANN)训练特定像元上不同LULC类型的发展适宜性概率; 二是利用轮赌盘选择的自适应惯性竞争机制模拟LULC分布。由于竞争机制的运用,该模型能有效规避LULC转换过程中的不确定性和复杂性,较好地避免误差传递[33]。本文首先利用ANN算法获取高程、年均降水等驱动因子下2015年不同地类变化的适宜性概率,然后基于CA模型以自适应惯性和竞争机制获取禄劝县2021年的LULC模拟结果。其中耕地、林地、草地、水体、建设用地和裸地的邻域权重分别设置为: 1,0.1,0.1,0.5,0.2和0.4,不同地类之间的转移规则设置如表1所示。表中,1表示地类之间可以相互转换,0则表示不可转换。
表1 不同地类之间的转移规则
Tab.1
| 土地类型 | 耕地 | 林地 | 草地 | 水体 | 建设用地 | 裸地 |
|---|---|---|---|---|---|---|
| 耕地 | 1 | 1 | 1 | 1 | 1 | 1 |
| 林地 | 1 | 1 | 0 | 0 | 1 | 1 |
| 草地 | 1 | 1 | 1 | 1 | 1 | 1 |
| 水体 | 0 | 1 | 1 | 1 | 0 | 1 |
| 建设用地 | 1 | 1 | 1 | 1 | 1 | 1 |
| 裸地 | 0 | 1 | 1 | 1 | 0 | 1 |
2.5 PLUS模型
PLUS模型是耦合了一种新的土地扩张分析策略(land expansion analysis strategy,LEAS)和基于多类型随机斑块种子的CA模型(cellular automata model based on multi-type random patch seeds,CARS),可以更好地模拟多类LULC斑块级的变化[7]。LEAS从2期LULC数据中提取出各LULC类型扩张的区域,并采用随机森林算法逐一挖掘各类LULC扩张的因素,以获得各LULC类型的发展概率。LEAS简化了LULC变化的分析,但保留了分析复杂LULC变化机理的能力,解释性更好[34]。CARS结合随机种子生成和阈值递减的机制,在发展概率的约束下,动态模拟斑块的自动生成[7]。本文首先利用2015年、2021年2期LULC提取其扩张数据; 然后利用上述LULC变化驱动因子和LULC扩张数据,计算出各类用地的适宜性概率; 最后基于CARS的CA模型获取2021年禄劝县LULC模拟结果,其中各地类的邻域权重和转换规则和FLUS模型设置一致。
2.6 精度验证
采用混淆矩阵中的总体分类精度(overall accuracy,OA)、Kappa系数(K)、生产精度(production accuracy,PA)和用户精度(user accuracy,UA)进行LULC提取和模拟结果的精度检验。具体计算公式为:
式中: n为分类类别数; N为验证样本数量;
2.7 景观格局评价
景观破碎化直接影响区域生物多样性、物质循环与能量流动等过程,景观指数是表征景观破碎化最常用的方法[36]。参考前人的研究[37⇓-39],本文从景观要素的斑块特征破碎化、景观异质性破碎化和空间相互关系破碎化3方面选取聚集度(aggregation index,AI)、平均斑块面积(AREA-MN)、蔓延度(contagion indes,CONTAG)、边缘密度(edge density,ED)、景观形状指数(landscape shape inedx,LSI)和斑块密度(patch density,PD)6个景观指数来比较不同的LULC模拟模型所成成的LULC景观格局的破碎化程度。上述景观指数的计算公式及其意义见表2。
表2 衡量景观破碎化的典型景观指数
Tab.2
| 景观指数 | 公式 | 指标描述与意义 |
|---|---|---|
| 聚集度(AI) | 式中gij为景观类型的相似邻接斑块数目。AI反映景观要素斑块的聚集程度,值越大,景观破碎度越低 | |
| 平均斑块面积(AREA_MN) | 式中A为景观总面积; N为所有斑块数量。AREA_MN为反映景观结构的有效指标,值越大,景观破碎度越低 | |
| 蔓延度(CONTAG) | 式中pi为第i类斑块所占的面积百分比; fij为第i类和第j类斑块毗邻的数量; n为斑块总数。CONTAG反映景观斑块类型的团聚程度或延展趋势,值越大,景观破碎度越低 | |
| 边缘密度(ED) | 式中Ei为第i类斑块边界总长度。ED越大,景观破碎度越高 | |
| 景观形状指数(LSI) | 式中 | |
| 斑块密度(PD) | 式中Ni为第i类景观斑块数量。PD值越高,景观破碎度越高 |
3 结果与分析
3.1 研究区LULC时空演变特征
禄劝县的LULC以耕地、林地和草地为主,耕地主要分布在南部,林地和草地在全县均有分布(图4)。耕地、林地和草地分别占地类总面积的25.76%,45.20%和28.33%。1991—2021年,禄劝县耕地面积经历了缓慢增长、剧烈减少的过程。1991—2015年其以23.71 km2/a的速率缓慢增长; 2015—2021年其以79.97 km2/a的速率剧烈减少。林地、建设用地和裸地面积不断增加,三者面积分别增加了724.25 km2,27.72 km2和21.08 km2。草地面积经历了先减少后增加的变化过程,1991—2015年其年均减少40.58 km2; 2015—2021年其年均增加16.35 km2。水体面积呈现出波动增加的趋势,其面积由7.49 km2增长至35.21 km2,年均增长约0.92 km2。
图4
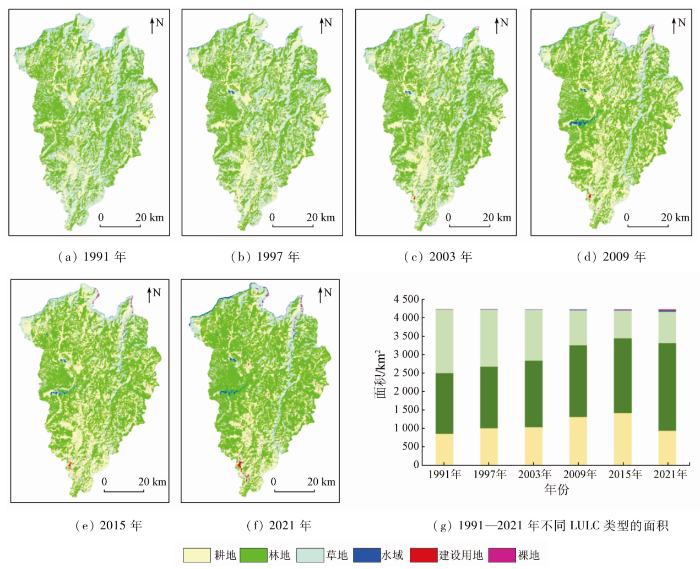
图4
1991—2021年禄劝县LULC时空变化
Fig.4
Temporal and spatial changes of LULC in Luquan from 1991 to 2021
3.2 LULC变化的驱动因素分析
基于随机森林模型评估各驱动因子对不同LULC类型变化的重要性。对禄劝县LULC类型变化影响较大的因素主要是地形条件(高程和坡度)(表3)。耕地的空间变化主要与高程、坡度和年均降水相关,因为随着高程和坡度的降低,耕地转为建设用地的概率会增加。林地和草地的发展受到高程、坡度、年均降水和年均温度的影响,因为在海拔高、坡度大且水热条件较好的区域,最适合植被生长,不适宜进行农业耕种或者城市建设,因此制约了其向其他LULC类型的转变。水域的变化与高程和坡度呈现出较强的相关性,裸地主要与高程和年均降水密切相关。建设用地的发展除了受限于高程、坡度和年均温度等自然因子外,还与人口密度密切相关,这是因为人口增长是推动城市发展的重要原因之一。表3为每种驱动因子对LULC变化的重要性。
表3 不同驱动因子对LULC变化的重要性
Tab.3
| 地类 | 高程 | 坡度 | 年均降水 | 年均温度 | 距主要道路的距离 | 距主要河流的距离 | 人口密度 |
|---|---|---|---|---|---|---|---|
| 耕地 | 0.24 | 0.19 | 0.19 | 0.13 | 0.10 | 0.09 | 0.07 |
| 林地 | 0.22 | 0.17 | 0.15 | 0.16 | 0.11 | 0.12 | 0.07 |
| 草地 | 0.25 | 0.15 | 0.14 | 0.16 | 0.10 | 0.12 | 0.07 |
| 水域 | 0.37 | 0.30 | 0.05 | 0.04 | 0.03 | 0.09 | 0.13 |
| 建设用地 | 0.24 | 0.16 | 0.09 | 0.14 | 0.13 | 0.10 | 0.14 |
| 裸地 | 0.49 | 0.06 | 0.15 | 0.09 | 0.08 | 0.05 | 0.07 |
3.3 4种LULC模拟模型评价
3.3.1 模拟精度
使用CA-Markov,LCM,FLUS和PLUS这4种LULC模拟模型分别模拟禄劝县2021年LULC状况,并将其与实际LULC数据进行验证,可以看到4种不同模型的LULC模拟效果差异巨大(表4)。就模拟的Kappa系数和总体精度来说,4种LULC模拟模型的精度排行为PLUS>FLUS>CA-Markov>LCM。对于不同地类模拟的生产精度而言, LCM模型模拟耕地的效果最好; FLUS模型模拟裸地的精度最高; PLUS模型在模拟林地、草地、水域和建设用地的精度是最高的。对于不同地类模拟的用户精度而言,PLUS模型在模拟耕地、草地和水域的精度是最高的; CA-Markov和LCM模型分别模拟林地和建设用地的精度最高; PLUS和FLUS模型模拟裸地的精度相同。
表4 不同LULC模拟模型的模拟精度
Tab.4
| 地类 | CA-Markov | LCM | FLUS | PLUS | ||||
|---|---|---|---|---|---|---|---|---|
| 生产精度 | 用户精度 | 生产精度 | 用户精度 | 生产精度 | 用户精度 | 生产精度 | 用户精度 | |
| 耕地 | 0.74 | 0.51 | 0.77 | 0.45 | 0.68 | 0.67 | 0.70 | 0.70 |
| 林地 | 0.74 | 0.89 | 0.60 | 0.85 | 0.85 | 0.85 | 0.87 | 0.87 |
| 草地 | 0.37 | 0.37 | 0.33 | 0.31 | 0.56 | 0.57 | 0.63 | 0.63 |
| 水域 | 0.46 | 0.77 | 0.35 | 0.60 | 0.41 | 0.73 | 0.61 | 0.88 |
| 建设用地 | 0.09 | 0.36 | 0.23 | 0.43 | 0.26 | 0.27 | 0.40 | 0.41 |
| 裸地 | 0.07 | 0.12 | 0.25 | 0.33 | 0.50 | 0.46 | 0.45 | 0.46 |
| Kappa系数 | 0.46 | 0.35 | 0.58 | 0.63 | ||||
| 总体精度 | 0.66 | 0.58 | 0.75 | 0.78 | ||||
3.3.2 面积一致性
4种不同的LULC模拟模型所模拟的2021年禄劝县不同LULC类型的面积差异明显(图5)。与2021年禄劝县不同LULC类型的实际面积相比,耕地在CA-Markov和LCM模型模拟中被严重高估,特别是在LCM模型中,其模拟面积约为实际面积的1.71倍; 而在FLUS和PLUS模型模拟中其面积只是略高于实际面积。林地在CA-Markov和LCM模型模拟中很大程度地被低估,两者分别被低估了397.42 km2和693.71 km2; FLUS模型模拟的林地面积和其实际面积相同; PLUS模型模拟所得的林地面积与其实际面积相近。草地在CA-Markov和LCM模型模拟中被略微高估,而在FLUS和PLUS模型模拟中其面积与实际面积几乎一致。水体在4种模型的模拟中都被低估,其低估面积分别为15.32 km2,15.25 km2,14.80 km2和12.01 km2。建设用地实际面积与FLUS模拟所得面积相同,其在CA-Markov和LCM模型被严重低估,而在PLUS模型中被略微高估。裸地在CA-Markov和LCM模型中被低估,其中CA-Markov模型低估的程度更大,而在FLUS和PLUS模型模拟中其与实际面积非常接近。
图5
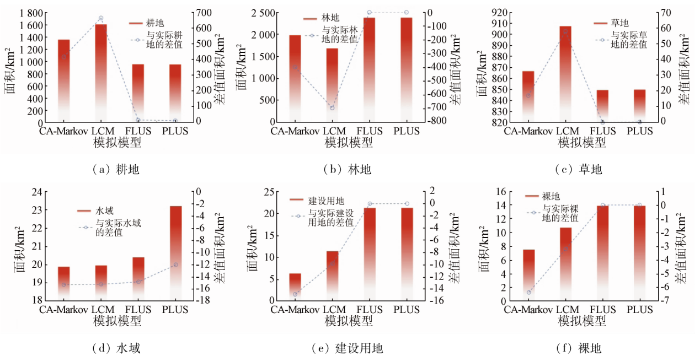
图5
4种模型模拟的禄劝县2021年不同LULC类型的面积
Fig.5
The area of different LULC types in Luquan County in 2021 simulated by the four models
3.3.3 空间位置一致性
4种不同的LULC模拟模型所模拟的2021年禄劝县LULC空间分布格局差异明显(图6)。 CA-Markov模型模拟得到的禄劝县LULC空间格局与其实际的分布格局有较大的不同,特别是在金沙江和普渡河上游地区,大量的林地和草地被模拟成了耕地。LCM模型模拟的禄劝县LULC空间分布格局整体与其实际情况存在很大差异。FLUS模型模拟的LULC空间分布格局与其实际情况比较相似,但其在汤郎乡西部和乌东德镇北部存在部分建设用地的过度模拟。PLUS模型所模拟的LULC空间分布格局与其实际情况最相似,但其转龙镇和九龙镇西部的建设用地也存在过度模拟的现象。进一步对禄劝县2处典型地物(云龙水库和禄劝县城建设用地)的细节特征对比可以发现,PLUS模型模拟得到的LULC空间分布特征与其实际情况最为接近。
图6

图6
4种模型模拟的2021年禄劝县LULC的空间格局
Fig.6
The spatial pattern of LULC in Luquan County in 2021 simulated by 4 models
3.3.4 景观破碎度
对比4种模型用于衡量景观破碎度的各项景观指数及其与2021年LULC实际景观指数之间的差值(图7)。就AI和CONTAG指数的大小而言,CA-Markov>LCM>PLUS>FLUS模型; 从AREA-MN指数来看,CA-Markov>LCM>FLUS>PLUS模型; 从ED和LSI指数分析,FLUS>PLUS>LCM>CA-Markov模型; 根据4个模型所得PD指数的大小排序,PLUS>FLUS>LCM>CA-Markov模型。 AI,CONTAG和AREA-MN指数是反映景观破碎化程度的负向指标,ED、LSI和PD指数是反映景观破碎化程度的正向指标。因此在4个模型中,CA-Markov模型模拟所得的LULC景观破碎度最小,而FLUS模型模拟的LULC景观破碎化程度最大。
图7
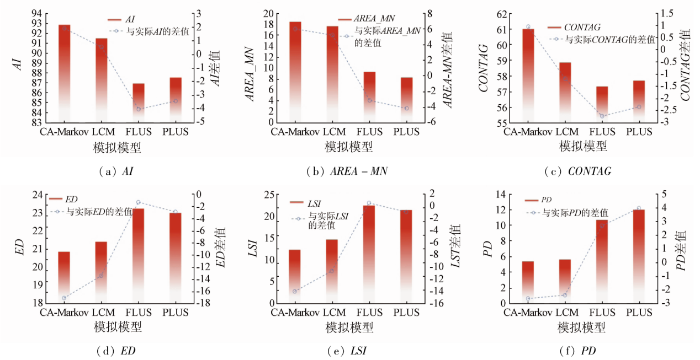
图7
4种模型模拟的LULC景观破碎度指数
Fig.7
The LULC landscape fragmentation index simulated by the 4 models
3.4 研究区2027年LULC模拟
通过上述实验,从模拟精度、面积一致性、空间位置一致性和景观破碎度4方面对CA-Markov,LCM,FLUS和PLUS这4种LULC模型的模拟效果进行了比较。其中,PLUS模型是禄劝县LULC模拟效果最佳的模型,因此基于该模型模拟了禄劝县2027年的LULC状况。2027年禄劝县的LULC空间格局依旧以林地、草地和耕地为主导,三者约占全县总面积的98.27%(图8)。2021—2027年,耕地、草地和水体的面积不断减少,其减少速率分别为40.21 km2/a,4.51 km2/a和0.70 km2/a; 林地、建设用地和裸地迅速扩张,其扩张面积分别为265.52 km2,4.85 km2和2.08 km2。其中,约有252.49 km2的耕地和26.43 km2的草地向林地流转,使得林地面积快速增加。
图8

图8
禄劝县2027年LULC的空间分布格局和面积
Fig.8
Spatial distribution pattern and area of LULC in Luquan County in 2027
4 讨论与结论
4.1 讨论
4.1.1 不同模型模拟精度差异的原因
CA-Markov,LCM,FLUS和PLUS模型模拟禄劝县LULC的精度不一,其中PLUS模型的模拟精度最高,FLUS模型次之,LCM模型的模拟效果最差,这与Liu等[6]、Liang等[7]的研究结论一致。4种模型的精度差异与其CA模型转换挖掘策略与参数校准有关。CA-Markov模型基于Logistic回归来获取CA模型的转化规则和参数,该方法虽然简单,但线性模型难以反映土地利用变化涉及的非线性复杂特征[1]。LCM和FLUS模型分布采用多层感知神经网络(multi-layer perception ANN,MLP-ANN)和ANN算法来进行训练,有效地解决了LULC预测的非线性和空间结构分布的问题[14],但ANN属黑箱结构,存在学习、局部最小值和收敛速度慢等问题[1]。PLUS模型采用了一种新的转换策略——LEAS,这种转换策略很好地结合了Logistic回归和ANN算法的优点并克服了其缺点[7]。
4.1.2 不同LULC类型模拟精度差异的原因
图9
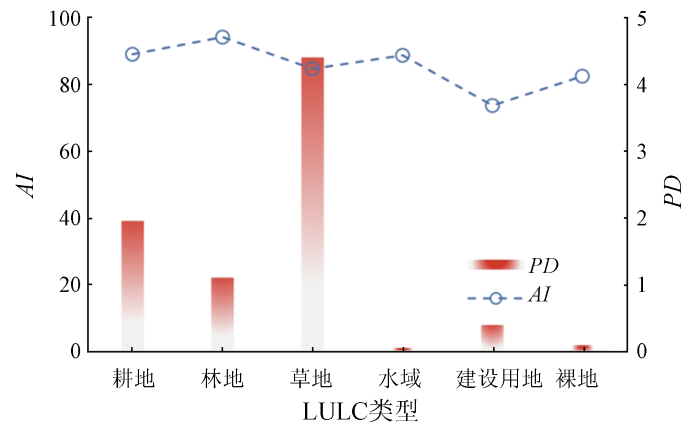
图9
2021年禄劝县不同LULC的景观指数
Fig.9
Landscape indices of different LULCs in Luquan County in 2021
4.2 结论
研究基于GEE平台提取的多期LULC数据,分析了1991—2021年禄劝县LULC变化的时空特征,并对比了CA-Markov,LCM,FLUS和PLUS 4种模型在禄劝县LULC模拟的精度,最终基于“最适宜”模型模拟了禄劝县2027年的LULC状况,为同地区LULC模拟模型的选择提供了科学依据,主要结论如下:
1)1991—2021年,禄劝县LULC以耕地、林地和草地为主,分别占地类总面积的25.76%,45.20%和28.33%。耕地和水体面积波动增加89.26 km2和27.72 km2; 林地、建设用地和裸地面积持续增加724.25 km2,21.08 km2和13.67 km2; 草地面积波动减少,其年均减少29.20 km2。
2)禄劝县LULC变化主要受到地形条件(高程和坡度)的影响。耕地、林地、草地和裸地的变化除了受地形影响外,还与年均降水、年均温度等气象因素相关。建设用地的发展不仅与地形和年均温度等自然因子有关,还与人口密度密切相关。
3)4种LULC模型的模拟精度排行为PLUS>FLUS>CA-Markov>LCM。与2021年禄劝县不同LULC类型的实际面积相比,耕地和草地在CA-Markov和LCM模型模拟中分别被高估,而林地、建设用地和裸地在这2个模型中则被低估,水体在4种模型的模拟中都被低估。PLUS模型模拟得到的LULC空间分布特征与禄劝县实际情况最为接近。在4个模型中,CA-Markov模型模拟所得的LULC景观破碎度最小,而FLUS模型模拟的LULC景观破碎化程度最大。
4)2027年禄劝县的LULC空间格局依旧以林地、草地和耕地为主。2021—2027年,耕地、草地和水体的面积分别以40.21 km2/a,4.51 km2/a和0.70 km2/a的速率减少; 而林地、建设用地和裸地分别向外扩张265.52 km2,4.85 km2和2.08 km2。
受数据获取的限制,本文LULC变化的驱动因子尚未选择GDP数据,且在未来模拟中没有将生态红线、政府调控政策等考虑其中。在未来的研究中,更多、更精细的驱动因子和宏观调控政策将被用于LULC变化模拟中,以提高模拟的精度。
参考文献
土地利用变化模拟模型及应用研究进展
[J].
Simulation model of land use dynamics and application:Progress and prospects
[J].
A local land use competition cellular automata model and its application
[J].DOI:10.3390/ijgi5070106 URL [本文引用: 2]
CLUE:A conceptual model to study the conversion of land use and its effects
[J].DOI:10.1016/0304-3800(94)00151-0 URL [本文引用: 1]
Modeling the spatial dynamics of regional land use:The CLUE- S model
[J].Land-use change models are important tools for integrated environmental management. Through scenario analysis they can help to identify near-future critical locations in the face of environmental change. A dynamic, spatially explicit, land-use change model is presented for the regional scale: CLUE-S. The model is specifically developed for the analysis of land use in small regions (e.g., a watershed or province) at a fine spatial resolution. The model structure is based on systems theory to allow the integrated analysis of land-use change in relation to socio-economic and biophysical driving factors. The model explicitly addresses the hierarchical organization of land use systems, spatial connectivity between locations and stability. Stability is incorporated by a set of variables that define the relative elasticity of the actual land-use type to conversion. The user can specify these settings based on expert knowledge or survey data. Two applications of the model in the Philippines and Malaysia are used to illustrate the functioning of the model and its validation.
A future land use simulation model (FLUS) for simulating multiple land use scenarios by coupling human and natural effects
[J].DOI:10.1016/j.landurbplan.2017.09.019 URL [本文引用: 3]
Understanding the drivers of sustainable land expansion using a patch-generating land use simulation (PLUS) model:A case study in Wuhan,China
[J].DOI:10.1016/j.compenvurbsys.2020.101569 URL [本文引用: 5]
基于Dyna-CLUE模型的滇池流域土地利用情景设计与模拟
[J].
DOI:10.11821/dlyj201509002
[本文引用: 1]

以滇池流域为研究对象,基于1999年、2002年两期TM遥感解译数据和区域自然与社会经济数据,应用Dyna-CLUE模型模拟2008年滇池土地利用空间分布。结合滇池流域土地利用变化趋势与退耕还林政策,设定了三种土地需求情景,模拟2022年区域土地利用空间分布情况。研究结果表明:① 两期模拟结果Kappa系数分别为0.6814与0.7124,具有高度的一致性,表明Dyna-CLUE模型在滇池流域有较强的适用性。② 三种情景的模拟结果显示,至2022年流域内未利用地、耕地显著减少,建设用地、林地显著增加,水域与草地相对变化较小,因加大退耕还林政策实施力度,三种情景中,位于官渡区、呈贡区、嵩明县及晋宁县的耕地与林地呈现不同的变化情况。③ 滇池流域建设用地扩张,增加了滇池非点源污染负荷。不合理的土地利用布局,将会恶化滇池水质,加剧水环境压力。研究结果可为未来滇池流域土地利用合理规划与非点源污染控制提供参考依据和决策支持。
Land use scenario design and simulation based on Dyna-CLUE model in Dianchi Lake Watershed
[J].
DOI:10.11821/dlyj201509002
[本文引用: 1]
Taking Dianchi Lake Watershed as a study area, we use Dyna-CLUE to simulate the land use spatial distribution pattern of the Dianchi Lake Watershed in 2008 in combination with the interpretation data from TM image in 1999 and 2002 and local natural and socio-economic data. According to the trend of land use change in the Dianchi Lake Watershed and the policy of returning farmland to forestland, three scenarios of land use change from 2008 to 2022 were constructed, and land use spatial pattern in 2022 in the study area was stimulated under the above-mentioned scenarios by using the Dyna-CLUE model. The results show that Kappa coefficients of the two simulated results from1999 to 2008 and from 2002 to 2008 were 0.6814 and 0.7124, compared with the interpretation data of 2008. The simulated results were credible and the Dyna-CLUE model has a good applicability in simulating land use change in the Dianchi Lake Watershed. The simulation results of the three scenarios show that the unused land and farmland will be reduced significantly, construction land and woodland will increase rapidly, and water bodies and grassland will change a little. Because of the difference in the policy of returning farmland to forestland, farmland and forestland in Guandu district, Chenggong district, Songming county and Jinning county will be different under the three scenarios. The expansion of construction land in the watershed will increase the load of non-point source pollution in the Dianchi Lake. Unreasonable distribution of land use will result in further deterioration of the water quality and increase the pressure on the water environment in the Dianchi Lake. The research can provide scientific support for rational planning of land use and prevention of non-point source pollution.
Simulating land use for protecting food crop areas in northeast Thailand using GIS and Dyna-CLUE
[J].
DOI:10.1007/s11442-019-1629-7
[本文引用: 1]
Land use in the northeast region of Thailand has changed dramatically in the past two decades. These changes are mainly due to the government policies, which launched a scheme to promote rubber plantation during 2003-2013 targeting to solve the problem of poverty in the region. At least 50,000 ha of paddy fields were found to be converted to other land use types between 2002 and 2012. This study was conducted in Nong Khai and Bueng Kan province of northeast Thailand, where massive rubber plantation is going on prompting significant amount of land-use change, with the objective of investigating how land-use changes will affect on food availability in future. We analyzed land-use changes of the past and simulated future land uses using GIS and Landsat Thematic Mapper Data. The most obvious change was the decrease in paddy field and an increase in rubber plantation. This eventually leads to decreased paddy production affecting food supply of farm households. The land use projections for 2032 were done for three scenarios using Dyna-CLUE model. Unlike business as usual scenario, which will further decrease the paddy area, other scenarios with different land use policies if implemented will help protect paddy areas and thus achieving higher food production locally. The lack of implementation of proper spatial policies will lead to a further loss of paddy areas at macro level. The smallholder farmers may be highly vulnerable to land use-change and experience significant food crop losses, food insecurity and income loss when they change the land to rubber and there is market failure.
Integrating remote sensing and a Markov-FLUS model to simulate future land use changes in Hokkaido,Japan
[J].
DOI:10.3390/rs13132621
URL
[本文引用: 1]
As the second largest island in Japan, Hokkaido provides precious land resources for the Japanese people. Meanwhile, as the food base of Japan, the gradual decrease of the agricultural population and more intensive agricultural practices on Hokkaido have led its arable land use to change year by year, which has also caused changes to the whole land use pattern of the entire island of Hokkaido. To realize the sustainable use of land resources in Hokkaido, past and future changes in land use patterns must be investigated, and target-based land use planning suggestions should be given on this basis. This study uses remote sensing and GIS technology to analyze the temporal and spatial changes of land use in Hokkaido during the past two decades. The types of land use include cultivated land, forest, waterbody, construction, grassland, and others, by using the satellite images of the Landsat images in 2000, 2010, and 2019 to achieve this goal to make classification. In addition, this study used the coupled Markov-FLUS model to simulate and analyze the land use changes in three different scenarios in Hokkaido in the next 20 years. Scenario-based situational analysis shows that the cultivated land in Hokkaido will drop by about 25% in 2040 under the natural development scenario (ND), while the cultivated land area in Hokkaido will remain basically unchanged in cultivated land protection scenario (CP). In forest protection scenario (FP), the area of forest in Hokkaido will increase by 1580.8 km2. It is believed that the findings reveal that the forest land in Hokkaido has been well protected in the past and will be protected well in the next 20 years. However, in land use planning for future, Hokkaido government and enterprises should pay more attention to the protection of cultivated land.
Modelling landscape ecological assessments of land use and cover change scenarios.Application to the Bojnourd Metropolitan Area (NE Iran)
[J].DOI:10.1016/j.landusepol.2020.105098 URL [本文引用: 1]
基于MCR-FLUS-Markov模型的区域国土空间格局优化
[J].
Optimization of regional territory space pattern based on MCR-FLUS-Markov model
[J].
基于土地利用/覆盖变化的浙江大湾区生态安全评价及多情景模拟分析
[J].
Ecological security assessment and multi-scenario simulation analysis of Zhejiang Greater Bay Area based on LUCC
[J].
山区县域土地利用/覆被变化多尺度多模型模拟对比——以云南省勐腊县为例
[J].
Multi-scale and multi-model simulation of land use/ land cover change in the mountainous county:A case study of Mengla County in Yunnan Province,China
[J].
基于CA-Markov和Geomod模型橡胶林变化预测比较
[J].
Comparison of CA-Markov and geomod models for rubber plantation prediction
[J].
CA-Markov与LCM模型的黄河三角洲湿地变化模拟比较
[J].
DOI:10.12082/dqxxkx.2019.180660
[本文引用: 2]
为了了解黄河三角洲湿地景观类型演变最优模拟模型以及景观的变化趋势,本文采用1996、2006、2016年3期黄河三角洲分类影像,分别利用CA-Markov、LCM、2种模型叠加开展变化模拟。研究发现:① 在相同驱动力因子影响下,空间模拟上LCM比CA-Markov好,数量模拟上,CA-Markov比LCM更贴合,对于变化较大研究区,综合2种模型优势来模拟该湿地变化最佳;② 对于较强的人为、自然灾害干扰,会对模拟精度有影响。在LCM模型中,驱动力相同情况下,生成适宜性图像的转移子模型数量越多,模拟精度越高。对于CA-Markov模型,比例误差系数适宜的设置对数量模拟的精度也有提升;③ 在保持2006-2016年的变化趋势下,综合2种模型模拟的2026年自然湿地面积1252.69 km <sup>2</sup>,人工湿地面积1265.00 km <sup>2</sup>,非湿地面积924.51 km <sup>2</sup>。从2026年黄河三角洲模拟的结果可看出,自然、非湿地的面积减少,人工湿地大量的增加并不断向浅海区域扩张。通过对黄河三角洲湿地变化进行预测分析,可为湿地资源的合理有效利用与管理等提供科学依据。
Comparison of the CA-Markov and LCM models in simulating wetland change in the Yellow River Delta
[J].
Spatial and temporal variation,simulation and prediction of land use in ecological conservation area of western Beijing
[J].
DOI:10.3390/rs14061452
URL
[本文引用: 1]
Exploring land use change is crucial to planning land space scientifically in a region. Taking the ecological conservation area (ECA) in western Beijing as the study area, we employ ArcGIS 10.2, landscape pattern index and multiple mathematical statistics to explore the temporal and spatial variation of land use from 2000 to 2020. Patch-generating Land Use Simulation (PLUS), Future Land Use Simulation (FLUS) and Markov models were used to simulate and predict the current land use in 2020. The models were evaluated for accuracy, and the more accurate PLUS model was selected and used to simulate and predict the potential land use in the study area in 2030 under two management scenarios. The main findings of this research are: (1) From 2000 to 2020, the construction land increased constantly, and the area of cultivated land and grassland decreased significantly. (2) For predicting the spatial distribution of land use in the study area, the PLUS model was more accurate than the FLUS model. (3) The land-use prediction of the study area in 2030 shows that the area of grassland, forest and water is approximately equal to their corresponding value in 2020, but the construction land increased constantly by occupying the surrounding cultivated land. According to this research, the continuous decrease of cultivated land in favor of increasing construction land will cause losses to the ecological service function of the ECA, which is not beneficial to the sustainable development of the region. Relevant departments should take corresponding measures to reduce this practice and promote sustainable development, particularly in the southern and western areas of the ECA where there is less construction land.
Growing-season vegetation coverage patterns and driving factors in the China-Myanmar Economic Corridor based on Google Earth Engine and geographic detector
[J].DOI:10.1016/j.ecolind.2022.108620 URL [本文引用: 1]
鄂西南地区土地利用格局时空变化及轨迹特征分析
[J].
Analysis of spatial and temporal changes and trajectory characteristics of land use pattern in the southwest Hubei
[J].
中国多时期土地利用土地覆被遥感监测数据集(CNLUCC)
[EB/OL].
Multi period remote sensing monitoring data set of land use and land cover in China (CNLUCC)
[EB/OL].
The 30 m annual land cover dataset and its dynamics in China from 1990 to 2019
[J].
DOI:10.5194/essd-13-3907-2021
URL
[本文引用: 1]
. Land cover (LC) determines the energy exchange, water and carbon cycle between Earth's spheres. Accurate LC information is a fundamental parameter for the environment and climate studies. Considering that the LC in China has been altered dramatically with the economic development in the past few decades, sequential and fine-scale LC monitoring is in urgent need. However, currently, fine-resolution annual LC dataset produced by the observational images is generally unavailable for China due to the lack of sufficient training samples and computational capabilities. To deal with this issue, we produced the first Landsat-derived annual China land cover dataset (CLCD) on the Google Earth Engine (GEE) platform, which contains 30 m annual LC and its dynamics in China from 1990 to 2019. We first collected the training samples by combining stable samples extracted from China's land-use/cover datasets (CLUDs) and visually interpreted samples from satellite time-series data, Google Earth and Google Maps. Using 335 709 Landsat images on the GEE, several temporal metrics were constructed and fed to the random forest classifier to obtain classification results. We then proposed a post-processing method incorporating spatial–temporal filtering and logical reasoning to further improve the spatial–temporal consistency of CLCD. Finally, the overall accuracy of CLCD reached 79.31 % based on 5463 visually interpreted samples. A further assessment based on 5131 third-party test samples showed that the overall accuracy of CLCD outperforms that of MCD12Q1, ESACCI_LC, FROM_GLC and GlobeLand30. Besides, we intercompared the CLCD with several Landsat-derived thematic products, which exhibited good consistencies with the Global Forest Change, the Global Surface Water, and three impervious surface products. Based on the CLCD, the trends and patterns of China's LC changes during 1985 and 2019 were revealed, such as expansion of impervious surface (+148.71 %) and water (+18.39 %), decrease in cropland (−4.85 %) and grassland (−3.29 %), and increase in forest (+4.34 %). In general, CLCD reflected the rapid urbanization and a series of ecological projects (e.g. Gain for Green) in China and revealed the anthropogenic implications on LC under the condition of climate change, signifying its potential application in the global change research. The CLCD dataset introduced in this article is freely available at https://doi.org/10.5281/zenodo.4417810 (Yang and Huang, 2021).
China:Open access to Earth land-cover map
[J].
Land use/land cover changes and their driving factors in the northeastern Tibetan Plateau based on geographical detectors and Google earth engine: A case study in Gannan prefecture
[J].
DOI:10.3390/rs12193139
URL
[本文引用: 1]
As an important production base for livestock and a unique ecological zone in China, the northeast Tibetan Plateau has experienced dramatic land use/land cover (LULC) changes with increasing human activities and continuous climate change. However, extensive cloud cover limits the ability of optical remote sensing satellites to monitor accurately LULC changes in this area. To overcome this problem in LULC mapping in the Ganan Prefecture, 2000–2018, we used the dense time stacking of multi-temporal Landsat images and random forest algorithm based on the Google Earth Engine (GEE) platform. The dynamic trends of LULC changes were analyzed, and geographical detectors quantitatively evaluated the key driving factors of these changes. The results showed that (1) the overall classification accuracy varied between 89.14% and 91.41%, and the kappa values were greater than 86.55%, indicating that the classification results were reliably accurate. (2) The major LULC types in the study area were grassland and forest, and their area accounted for 50% and 25%, respectively. During the study period, the grassland area decreased, while the area of forest land and construction land increased to varying degrees. The land-use intensity presents multi-level intensity, and it was higher in the northeast than that in the southwest. (3) Elevation and population density were the major driving factors of LULC changes, and economic development has also significantly affected LULC. These findings revealed the main factors driving LULC changes in Gannan Prefecture and provided a reference for assisting in the development of sustainable land management and ecological protection policy decisions.
Evaluation of driving forces of land use and land cover change in new England area by a mixed method
[J].
DOI:10.3390/ijgi9060350
URL
[本文引用: 1]
Understanding the driving forces of land use/cover change (LUCC) is a requisite to mitigate and manage effects and consequences of LUCC. This study aims to analyze drivers of LUCC in New England, USA. It combines meta-study, GIS, and machine learning to identify the important factors of LUCC in the area. Firstly, we conducted a meta-study of the research on LUCC in the New England area and specifically focused on the driving forces analysis. The meta-analysis revealed that the LUCC studies in the research area were highly related with many other research topics, and population and economic factors were the most mentioned drivers of the LUCC. The drivers of LUCC in this study area for the past several decades were relatively well analyzed. However, the study of the main driving forces of recent LUCC is lacking. Then, the determinants of LUCC for the recent years were quantitatively assessed using the random forests (RF) model along with geospatial data processing. Two planning regions in Connecticut and one planning region in Massachusetts were selected to serve as the case study areas. Investigated variables included environmental and biophysical variables, location measures of infrastructure and existing land use, political variables, and demographic and social variables. These drivers were examined for their relations with LUCC processes. Their importance as driving forces was ranked by the RF method. The results show both consistency and inconsistency between the meta-analysis and the RF method. We found that this mixed method can enhance our understanding of driving forces of LUCC and improve the selection quality of important drivers for modeling LUCC. With more solid information, better land management advices for sustainable development may also be provided.
基于随机森林模型的城市扩张三维特征时空变化及机制分析
[J].
Spatio-temporal changes and mechanism analysis of urban 3D expansion based on random forest model
[J].
衰退型资源城市土地利用时空变化及驱动因素分析
[J].
Analysis on the temporal and spatial change of land use and its driving factors of declining resources-based city
[J].
耦合FLUS和Markov的快速发展城市土地利用空间格局模拟方法
[J].
DOI:10.12082/dqxxkx.2022.210359
[本文引用: 1]
模拟城市土地利用空间变化格局的研究,对未来区域规划以及实现可持续发展具有十分积极的作用。以往基于FLUS的研究栅格尺度较大,如何模拟快速发展中城市的复杂土地利用变化过程,挖掘土地利用变化驱动机制值得进一步探讨。本文构建了耦合FLUS和Markov的城市土地利用格局拟合框架,创新性地引入房价指标表征社会经济属性,以深圳为研究区,基于30 m空间分辨率小栅格尺度的土地利用分类数据和基础地理、路网河网、感兴趣点等多源空间变量,模拟不同发展情景下的未来城市土地利用空间格局,并通过随机森林进行土地利用变化驱动因素分析。研究结果表明:本文提出的耦合FLUS和Markov方法相较于传统CA模型(RFA-CA和Logistic-CA)精度更高(FoM=0.22),能更准确地模拟快速发展中城市的土地利用变化过程;多情景土地利用格局制图结果验证了城市发展过程中生态控制线的重要性,进一步说明本文拟合框架在未来城市规划布局中的参考价值;医院、娱乐场所等的基础设施和公交、路网密度等的基础交通比自然因素(高程、坡度)对城市发展的影响更大,到海岸线距离会在一定程度上限制深圳内部土地利用变化过程。本研究所构建模型及精细制图结果,可为城市区域规划和空间格局模拟等相关研究提供参考依据和理论基础。
A coupled FLUS and Markov approach to simulate the spatial pattern of land use in rapidly developing cities
[J].
气候与土地利用变化对汉江流域径流的影响
[J].
DOI:10.11821/dlxb202011003
[本文引用: 1]
作为联结大气圈和地圈的纽带,水文循环同时承受气候变化和土地利用/覆被变化(LUCC)的双重影响,然而大多数的水文响应研究主要关注未来气候变化对径流的影响,忽略了未来LUCC的作用。因此,本文的研究目的是评估未来气候变化和LUCC对径流的共同影响。首先采用2种全球气候模式(BCC-CSM1.1和BNU-ESM)输出,基于DBC降尺度模型得到未来气候变化情景;然后,利用CA-Markov模型预测未来LUCC情景;最后,通过设置不同的气候和LUCC情景组合,采用SWAT模型模拟汉江流域的未来径流过程,定量评估气候变化和LUCC对径流的影响。结果表明:① 未来时期汉江流域的年降水量、日最高、最低气温相较于基准期(1966—2005年),在RCP 4.5和RCP 8.5浓度路径下,分别增加4.0%、1.8 ℃、1.6 ℃和3.7%、2.5 ℃、2.3 ℃;② 2010—2050年间,流域内林地和建设用地的面积占比将分别增加2.8%和1.2%,而耕地和草地面积占比将分别减少1.5%和2.5%;③ 与单一气候变化或LUCC情景相比,气候变化和LUCC共同影响下的径流变化幅度最大,在RCP 4.5和RCP 8.5浓度路径下未来时期年平均径流分别增加5.10%、2.67%,且气候变化对径流的影响显著大于LUCC。本文的研究结果将有助于维护未来气候变化和LUCC共同影响下汉江流域的水资源规划与管理。
Impacts of climate and land use/cover changes on runoff in the Hanjiang River Basin
[J].
DOI:10.11821/dlxb202011003
[本文引用: 1]
As a link between the atmosphere and the geosphere, the hydrological cycle is affected by both climate change and Land Use/Cover Change (LUCC). However, most existing research on runoff response focused mainly on the impact of the projected climate variation, neglecting the influence of future LUCC variability. Therefore, the objective of this study is to examine the co-impacts of both projected climate change and LUCC on runoff generation. Firstly, the future climate scenarios under BCC-CSM1.1 and BNU-ESM are both downscaled and corrected by the Daily Bias Correction (DBC) model. Secondly, the LUCC scenarios are predicted based on the Cellular Automaton-Markov (CA-Markov) model. Finally, the Soil and Water Assessment Tool (SWAT) model is used to simulate the hydrological process under different combinations of climate and LUCC scenarios, with the attempt to quantitatively evaluate the impacts of climate change and LUCC on runoff generation. In this study, the Hanjiang River basin is used as the case study area. The results show that: (1) compared with the base period (1966-2005), the annual rainfall, daily maximum and minimum air temperatures during 2021-2060 will have an increase of 4.0%, 1.8 ℃, 1.6 ℃ in RCP4.5 scenario, respectively, while 3.7%, 2.5 ℃, 2.3 ℃ in RCP8.5 scenario, respectively. (2) During 2010-2050, the area proportions of forest land and construction land in the study area will increase by 2.8% and 1.2%, respectively, while those of farmland and grassland will decrease by 1.5% and 2.5%, respectively. (3) Compared with the single climate change or LUCC scenario, the variation range of future runoff under both climate and LUCC is the largest, and the influence of climate change on future runoff is significantly greater than that of LUCC. This study is helpful to maintain the future water resources planning and management of the Hanjiang River basin under future climate and LUCC scenarios.
岱海流域土地利用动态模拟及生态系统服务价值测算
[J].
Simulation of land use and evaluation of ecosystem service value in Daihai Basin
[J].
基于CA-Markov模型的伊犁河三角洲景观格局预测
[J].
Prediction of landscape patterns in Ili River Delta based on CA-Markov model
[J].
多情景模拟下粤港澳大湾区生态系统服务评估与权衡研究
[J].
DOI:10.11821/dlyj020200943
[本文引用: 1]
城镇化快速发展导致区域的生态系统服务衰减,威胁城市的生态安全;掌握城市群地区生态系统服务权衡/协同关系量化,对提升生态系统服务总体效益和维护区域生态安全至关重要。以粤港澳大湾区为研究区域,利用InVEST模型对粤港澳大湾区1995—2018年间产水服务、固碳服务、土壤保持服务、食物供给服务共4项生态系统服务进行评估,设定历史趋势情景、规划情景和生态保护情景,借助GeoSOS-FLUS模型进行2030年生态系统服务情景分析,探讨各种生态系统服务之间的权衡/协同关系。结果表明:① 1995—2018年间,粤港澳大湾区产水服务出现增加趋势,固碳服务、土壤保持服务和食物供给服务出现下降趋势。② 不同类型生态系统服务变化存在明显的区域异质性,产水服务高值区域其值增大,低值区域其值减小;固碳服务低值区域,其值下降更大;除香港外,土壤保持量减小的区域呈零星状分布;食物供给高值及减小的最大值位于东莞、佛山、中山和深圳等中部区域。③ 产水服务在规划情景下达到最佳,固碳服务和土壤保持服务在生态保护情景下最佳,历史趋势情景下食物供给服务最佳,生态系统服务综合效益在生态保护情景下达到最佳。④ 历史趋势情景下生态系统服务之间的权衡程度最大,生态保护情景下各项生态系统服务之间的协同程度较高。基于生态耦合模型进行粤港澳大湾区生态系统服务估算,揭示生态系统服务权衡或协同的变化关系及作用机理,可为区域生态系统服务管理和社会经济发展规划提供参考。
Evaluation and trade-offs of ecosystem services in Guangdong-Hong Kong-Macao Greater Bay Area under multi-scenario simulation
[J].
DOI:10.11821/dlyj020200943
[本文引用: 1]
The Guangdong-Hong Kong-Macao Greater Bay Area is facing the challenge of the increasingly serious lack of ecosystem services, which greatly hinders the implementation of the national construction strategy and the sustainable economic development of the Greater Bay Area. It is critical to understand the quantification of ecosystem services trade-offs / synergies relationships in urban agglomeration so as to enhance the overall effectiveness of ecosystem services and maintenance. Two models are introduced in this paper. Firstly, a future land-use simulation (GeoSOS-FLUS) model was employed for a 12-year (up to 2030) land-use distribution under three scenarios, namely, history trend, planning and ecological protection, respectively. Secondly, 4 ecosystem services from 1995 to 2030, which are water service, the carbon sequestration, soil conservation, and food supply, are evaluated by using InVEST model in the study area. Then, trade-off or collaborative relationship between each pair of ecosystem service types are explored and discussed. The results are as follows. (1) The water service increased from 1995 to 2008 while the carbon sequestration, soil conservation and food supply decreased. (2) Each ecological service exhibits an obvious spatiotemporal heterogeneity, in which the water services of areas with high value increase while areas with low value decrease; the carbon sequestration drops greater in lower value area than in the other. Except Hong-Kong, soil conservation of other areas have showed a decreasing trend, which are found sporadically in the entire area; the high and reduced food supply are distributed in central regions such as Dongguan, Foshan, Zhongshan and Shenzhen. (3) Optimal status can be reached for the four ecosystem services, namely, water service under planning scenario, carbon sequestration and soil conservation under ecological protection scenario, food supply under history trend scenario, and comprehensive benefit of ecosystem service under ecological protection scenario. (4) The maximized trade-off relationship between ecosystem services are observed under history trend scenario and the maximized synergies relationship under ecological protection scenario, which witnessed has a stable development trend in 1995-2018. In summary, the estimation of ecosystem service of the Greater Bay Area and explanation to the mechanism of the synergistic effects of the ecosystem service with the ecological coupling models can bring to light the relationship and mechanism among different ecosystem services, and further provide reference for regional ecosystem service management and socio-economic development plan.
基于Markov-PLUS模型的柴北缘土地利用变化及模拟分析
[J].
Land use change and simulation analysis in the northern margin of the Qaidam Basin based on Markov-PLUS model
[J].
Simulating land use change in urban renewal areas:A case study in Hong Kong
[J].DOI:10.1016/j.habitatint.2014.10.008 URL [本文引用: 1]
汾河流域景观破碎化时空演变特征
[J].
The spatio-temporal evolution characteristics of landscape fragmentation in Fenhe River Basin
[J].
DOI:10.31497/zrzyxb.20190804
[本文引用: 1]
There is fragmented land and fragile ecological environment in the loess hilly and gully region. With the rapid population growth and socio-economic development in recent years, the degree of fragmentation has been further aggravated. Therefore, based on the interpretation data of remote sensing images in 1990, 2000 and 2015, this paper uses Fragstats 4.2 to obtain the best analysis scale combined with the standard method and moving window method. On this basis, the spatial differentiation characteristics of each landscape index are explored; The spatial and temporal evolution process of watershed landscape fragmentation is revealed; The spatial autoregressive model is used to analyze the impact factors contributing to landscape fragmentation. The results show that with the change of grain size and extent, some landscape indices show a regularity to certain degree. The 90 m grid size and 900 m square window size are the best analysis scales in the Fenhe River Basin; patch density, contagion, effective grid size, and Shannon's diversity index have a spatial agglomeration effect in the three periods, and the spatial agglomeration type distribution has strong similarity. From 1990 to 2015, the spatial pattern of landscape fragmentation in the study area has obviously changed; the slope, elevation and distance from the construction land are the main factors affecting landscape fragmentation of river basin during the three periods. The research results can provide reference for landscape fragmentation analysis in Northwest China, and provide basis for future regional landscape pattern optimization and effective land management.
澜沧江下游景观破碎化时空动态及成因分析
[J].DOI:10.16258/j.cnki.1674-5906.2018.07.020 [本文引用: 1]
Spatio-temporal dynamics of landscape fragmentation and its influencing analysis in the downstream of Lancang River Basin
[J].
景观破碎化对生态系统服务价值的影响作用分析——以苏州为例
[J].
Analysis on the effect of landscape fragmentation on ecosystem service value:A case study of Suzhou
[J].
