

0 引言
几十年来,人们为准确评估土壤盐渍化做出了巨大努力。现有文献中土壤盐渍化评价方法的发展可分为3个主要阶段: 样品分析方法、地球物理勘探测试方法和遥感(remote sensing,RS)技术[4-5]。遥感技术的优势在于长期对地观测过程中形成的有价值的历史数据的存在,为长期、大范围的土壤盐渍化动态监测提供数据支撑[6]。其中,利用光学遥感影像获得光谱指数建立线性非线性和盐渍化反演模型,与深度学习[7]、特征提取[8]、波段选择[9]等相比,具有简单、高效、成本低等优点,因此得到了广泛应用。目前,许多盐分指数已被提出并应用于土壤盐渍化监测,如盐度指数(salinity index,SI)[10-11]、归一化盐度指数(normalized difference salinity index,NDSI)[12-13]、亮度指数(brightness index,BI)[10]、强度指数(intensity index,Int)[14]及植被土壤盐度指数(vegetation soil salinity index,VSSI)[15]等。
此外,对生态环境质量进行准确评价,是生态保护的核心,也是目前湿地生态研究的热点。根据纳入评价指标的数量,现有方法一般可分为单指标法和多指标法2种[20⇓-22]。基于单一指标的方法通常关注生态状况的一个方面。例如,归一化植被指数(normalized difference vegetation index,NDVI)[23-24]、地表温度(land surface temperature, LST)[25]、永久性植被丰度(permanent vegetation fraction, PVF)[26]、叶面积指数(leaf area index, LAI)[27]等,被认为是有效的生态监测方法。虽然单指标法可以实现对生态环境质量快速评价,但由于滨海湿地环境复杂多样,导致其无法全面评价生态环境质量。
基于多指标的方法已广泛应用于生态评估。这一方法通常基于多个指标进行综合考虑[23-24]。基于P-S-R模型框架的生态环境质量评价方法主要考虑3类因素: 景观变化、景观生态系统状态和人类响应[28-29]。这类方法重点考虑了与人类活动相关的指标,如数字高程、地表温度、道路密度等,但很少涉及生态指标。Zhou等[30],Xu等[31],Firozjaei等[32]提出了基于遥感的生态指数(remote sensing-based ecological index,RSEI),从绿度、湿度、干度和热度4个方面评估生态。此外,Firozjaei等基于植被-不透水面-土壤(vegetation-impervious surface-soil,V-I-S)模型,从绿度、湿度、干度、热度和不透水度5个方面评价了洛杉矶和芝加哥等6个城市的地表生态环境状况[32]。上述方法虽然从不同的角度考虑了多个指标,但忽略了开放水域的影响。顾及水效益的生态环境质量评价指数(water benefit-based ecological index,WBEI)除了包含水生态因子外,还定义了与气候资源相对应的热环境以及土地覆盖[19]。但由于湿地生态系统组成复杂,动态性高,现有的湿地生态环境质量评价方法在植被要素精确监测中面临难题。
本研究以黄河三角洲为研究区,通过分析Landsat和实测数据光谱特征,提出虚拟盐渍化基线,构建基于基线的盐渍化指数(baseline-based soil salinity index,BSSI),抑制了不透水面和滩涂等复杂环境因素的影响,提高了复杂环境下土壤盐渍化的监测精度。通过将新型高光谱植被指数(hyperspectral image-based vegetation index,HSVI)改进应用到多光谱卫星,提高对植被要素的精确监测能力,结合WBEI构造优化的顾及水效益的生态环境质量评价指数(optimized water benefit-based ecological index,OWBEI),提高湿地区域的生态质量反演精度。基于本文构建的BSSI和OWBEI,建立土壤盐渍化对滨海湿地生态环境质量影响分析体系,探究土壤盐渍化现象对生态环境质量的影响机制。
1 研究区概况与数据源
1.1 研究区概况
图1
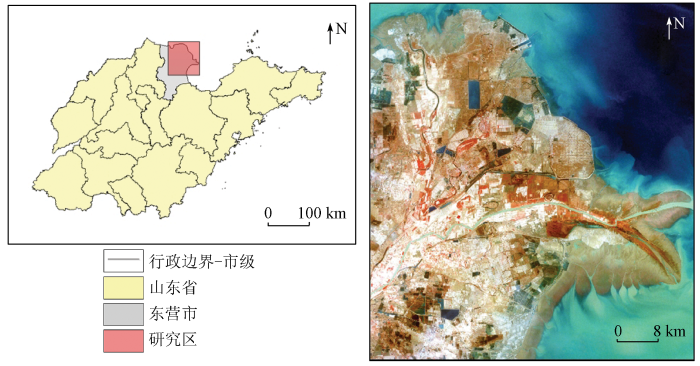
黄河三角洲属暖温带季风大陆性气候,气候温和,四季分明,雨热同期,降水约70%发生在夏季,年平均温度约为12.1 ℃,年平均降水量约为551.6 mm,但年平均蒸发量约为1 928.2 mm[36]。受海水侵蚀的影响,土壤盐碱化严重。
1.2 遥感数据
表1 Landsat影像数据
Tab.1
| 影像获取时间 | 传感器 | 分辨率/m |
|---|---|---|
| 2006-05-03 | TM | 30 |
| 2012-05-03 | TM | 30 |
| 2017-04-23 | OLI | 30 |
| 2020-05-01 | OLI | 30 |
1.3 实测数据
为了准确应用土壤样品建立含盐量和光谱反射率之间的关系,土壤样品的野外采集时间要求与遥感卫星的成像时间一致。因此数据采集时间为2006年5月3日,采样点的深度为20~30 cm,在每个采样点共设置5次重复采样,共采样70个样本点,数据来自国家科技基础设施平台国家地球系统科学数据中心(
2 研究方法
建立土壤盐渍化对滨海湿地生态环境质量影响机制分析体系,如图2所示。
图2
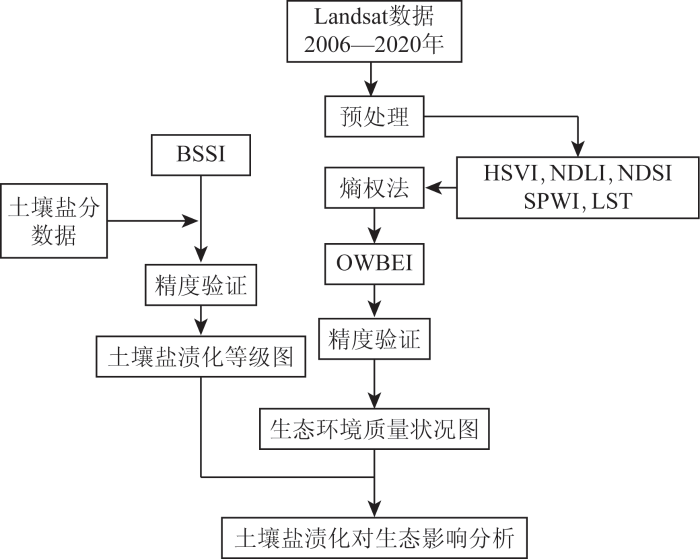
图2
土壤盐渍化对滨海湿地生态影响机制分析体系
Fig.2
The mechanism analysis system of soil salinization on coastal wetland ecology
首先,使用预处理的Landsat影像及实测数据,利用指数法建立回归模型获取土壤盐渍化状况; 其次,构造OWBEI获得生态质量状况; 最后,分析土壤盐渍化对黄河三角洲湿地生态环境质量的影响机制。
2.1 土壤盐分反演
表2 盐渍土分类等级
Tab.2
| 等级 | SSC% |
|---|---|
| 非盐渍土 | [0.0, 0.3] |
| 轻度盐渍土 | (0.3, 0.5] |
| 中度盐渍土 | (0.5, 1.0] |
| 重度盐渍土 | (1.0, 2.0] |
| 盐土 | (2.0, +∞) |
图3显示了BSSI的构建原则,分为2个步骤: 首先,构建虚拟盐渍化基线; 然后,计算短波红外-1(first short-wave infrared,SWIR1)和虚拟盐渍化基线之间的距离。
图3
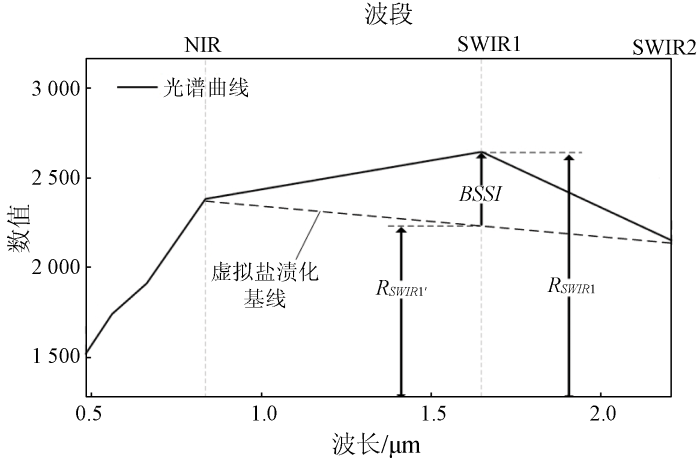
如图3所示,BSSI计算公式为:
式中: λNIR,λSWIR1和λSWIR2分别为波长为 0.835 μm,1.648 μm和2.206 μm 的光谱带; RNIR,RSWIR1和 RSWIR2分别为近红外波段、短波红外-1波段和短波红外-2波段的反射率。
2.2 生态环境质量评估
本研究针对传统生态环境质量评价方法繁琐、低效的指标融合框架,构建一种新的简单、高效的生态环境质量评价方法(OWBEI),包括生态指标计算和多生态指标融合2部分。
2.2.1 生态指标计算
1)水环境生态指标构建。Jiao等[19]通过研究构建了一个新的指标,即地表潜在水丰度指数(surface potential water abundance index,SPWI)来表征地表潜在水含量的空间分布。SPWI可以有效提高水因子区分效果,让结果更符合实际,其计算方法为:
式中: RNIR,RSWIR2和RB分别为近红外波段、短波红外-2波段和蓝光波段的反射率。
式中: RG,RR和RSWIR1分别为绿光波段、红光波段和短波红外波段-1波段的反射率。
2)土地覆盖生态指标构建。HSVI在绿地精细化检测中具有优异表现,既可以有效抑制阴影、蓝色彩钢瓦等因素的影响,又可以有效解决植被指数饱和问题[44]。本文摒弃了HSVI中复杂的阴影抑制项,选择了更为有效的指数函数结构和非归一化差值指数结构,并将其应用到植被指数的构造中,构建了基于多光谱数据的HSVI,其计算公式为:
3)热环境生态指标构建。为了更全面地反映生态环境状况,本文选择LST作为热环境指标, 使用辐射传输方程法反演LST[48]。
通过辐射传输方程变形可知,卫星传感器接收到的热红外辐射亮度值LZ的计算公式为[49]:
式中:
利用普朗克公式计算获取地物表面实际温度TS,公式为:
式中,K1和K2为热红外波段特定的热转换系数。
2.2.2 多生态指标融合
首先,计算每个指标的权重。定义ej为第j个评价指标的熵值,计算公式为:
式中: fij为第i个像素在第j个指标中所占的比例; xij为第j个指标中像素i的反射率; n为第j个指标的像素个数。
其次,定义wj为第j个评价指标的权重,计算公式[54]为:
式中m为指标个数。
最后,在确定各指标及其权重后,采用线性叠加的方法对各指标进行融合,以确保融合结果的准确性,计算公式为:
式中: w1,w2,w3,w4和w5分别为OWBEI中NDLI,HSVI,SPWI,LST和NDSI的权重; NNDLI,NHSVI,NSPWI,NLST和NNDSI分别为NDLI,HSVI,SPWI,LST和NDSI归一化后的结果。
2.3 精度验证
2.3.1 土壤盐渍化验证方法
2.3.2 生态环境质量评价验证方法
本文利用中国生态环境状况公报给出的各区县级生态环境质量结果生态环境指数(ecological index,EI)(
式中: BRI,VCI,WNDI,LSI,PLI和ERI分别为生物丰富度指数、植被覆盖指数、水网密度指数、土地压力指数、污染负荷指数和环境限制指数。
3 结果与分析
3.1 黄河三角洲土壤盐渍化状况
3.1.1 土壤盐渍化结果验证
表4 盐渍土分类精度
Tab.4
| 方法 | OA/% | Eo/% | Ec/% | Kappa |
|---|---|---|---|---|
| SI | 67.88 | 58.06 | 12.90 | 0.376 2 |
| SI1 | 67.15 | 51.61 | 20.97 | 0.354 2 |
| SI2 | 70.07 | 64.52 | 1.61 | 0.427 2 |
| VSSI | 81.02 | 41.94 | 0.00 | 0.630 4 |
| BSSI | 91.24 | 17.74 | 1.61 | 0.825 7 |
3.1.2 土壤盐渍化空间分布
图4
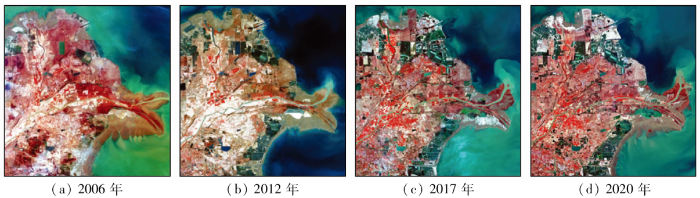
图5
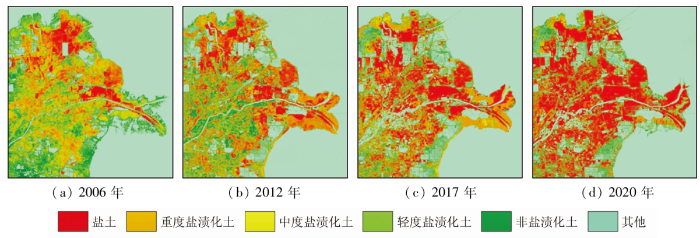
表5 黄河三角洲土壤盐渍化面积和比例
Tab.5
| 等级 | 年份 | ||||
|---|---|---|---|---|---|
| 2006 | 2012 | 2017 | 2020 | ||
| 非盐 渍化 | 面积/km2 | 2 921.67 | 2 965.70 | 3 060.77 | 2 976.00 |
| 占比/% | 58.15 | 59.10 | 60.94 | 59.20 | |
| 轻度 盐渍化 | 面积/km2 | 298.39 | 203.46 | 111.27 | 97.99 |
| 占比/% | 5.94 | 4.05 | 2.22 | 1.95 | |
| 中度 盐渍化 | 面积/km2 | 709.58 | 442.31 | 288.55 | 210.44 |
| 占比/% | 14.12 | 8.81 | 5.74 | 4.19 | |
| 重度 盐渍化 | 面积/km2 | 753.27 | 789.58 | 707.17 | 428.03 |
| 占比/% | 14.99 | 15.73 | 14.08 | 8.51 | |
| 盐土 | 面积/km2 | 341.85 | 617.44 | 854.98 | 1 314.54 |
| 占比/% | 6.80 | 12.30 | 17.02 | 26.15 | |
计算得到2006年研究区非盐渍化(2 921.67 km2,占总面积的58.15%)占主导地位(图6)。然而,近40%的面积受到土壤盐渍化的威胁,其中轻度盐渍化占5.94%,中度盐渍化占14.12%,重度盐渍化占14.99%。同样地,2012年,2017年和2020年非盐渍化也都占据主导地位,分别为59.10%,60.94%和59.20%。2012年轻度盐渍化占4.05%,中度盐渍化占8.81%,重度盐渍化占15.73%,盐土占12.30%。2017年轻度盐渍化占2.22%,中度盐渍化占5.74%,重度盐渍化占14.08%,盐土占17.02%。2020年轻度盐渍化占1.95%,中度盐渍化占4.19%,重度盐渍化占8.51%,盐土占26.15%,土壤盐渍化面积高达2 051.00 km2。
图6
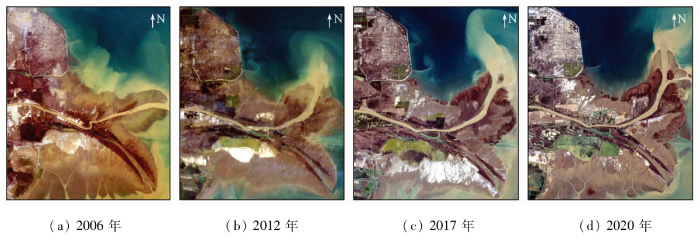
图6
现黄河入海口地表真彩色图像
Fig.6
True color images of the surface of the Yellow River Estuary
受自然因素(如降水、气温、土壤条件)和社会经济因素(如人口、城市化、政策等)的影响不同,不同地区土壤盐渍化程度不同。2006—2020年非盐渍化面积较稳定,保持在60%左右,轻度盐渍化和中度盐渍化呈现下降趋势。然而,随着人类活动的增加,该区的荒地被不透水表面所取代,从而导致盐土的面积呈现上升趋势,年增长率约1.5%。
3.2 黄河三角洲湿地生态环境质量状况
表6 2006年到2020年EI与OWBEI对比结果
Tab.6
| 研究区 | 方法 | 2006年 | 2012年 | 2017年 | 2020年 |
|---|---|---|---|---|---|
| 河口区 | EI | 较差 (0.20~ 0.35) | 较差 (0.20~ 0.35) | 较差 (0.20~ 0.35) | 较差 (0.20~ 0.35) |
| OWBEI | 较差 (0.31) | 较差 (0.33) | 较差 (0.34) | 较差 (0.28) | |
| 垦利区 | EI | 一般 (0.35~ 0.55) | 一般 (0.35~ 0.55) | 一般 (0.35~ 0.55) | 一般 (0.35~ 0.55) |
| OWBEI | 一般 (0.37) | 一般 (0.48) | 一般 (0.46) | 较差 (0.25) |
3.3 黄河三角洲土壤盐渍化对生态环境质量的影响
图7
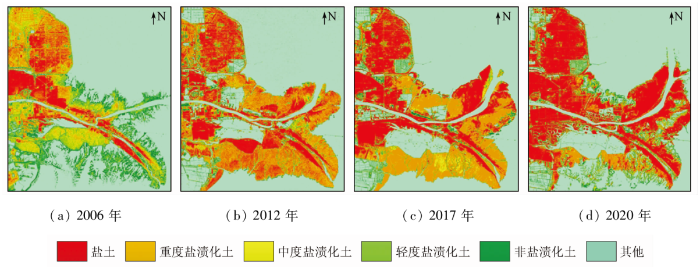
图8
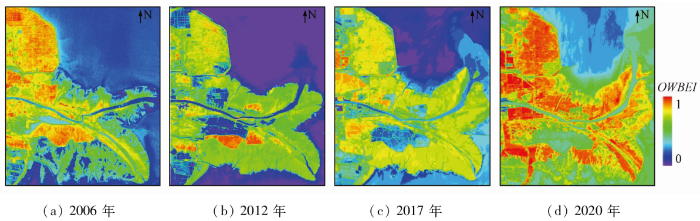
图9
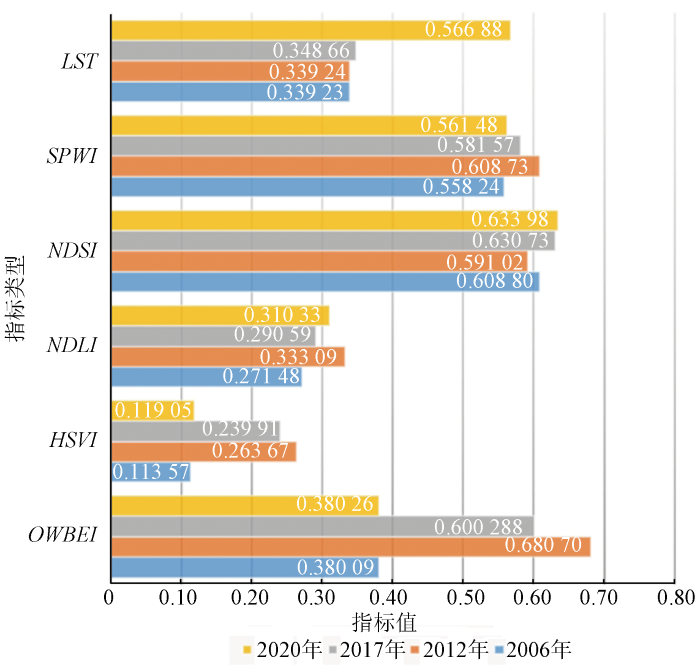
图9
现黄河入海口各生态指标的平均值
Fig.9
Average values of various ecological indicators at the Yellow River estuary
然而,2012—2020年该区由于盐土面积的增加,植被数量骤减,导致地表水分蒸发加快并且空气湿度也显著降低,最终导致黄河入海口的总体生态质量状况下降。图9中的NDSI和OWBEI也证实了这一结论。
综上可知,土壤盐渍化作为滨海湿地的突出特征对生态环境质量影响明显,在未来湿地治理方面应更加注重对土壤盐渍化的问题的解决,以期间接改善滨海湿地的生态状况。
4 结论
本文通过构造虚拟盐渍化基线,增强了盐渍化土壤的光谱特征,有效抑制滨海湿地不透水面、裸土等复杂地物的影响。BSSI的构建有效提高了地表盐渍化反演精度,为土壤盐渍化监测提供了一种新的可靠指数。此外,本文将HSVI应用到多光谱领域,解决了WBEI在湿地区域植被监测不准确问题,建立新型湿地生态评价方法OWBEI,提高湿地区域生态环境反演精度。
BSSI和OWBEI的结合形成了一整套土壤盐渍化对滨海湿地生态环境质量影响机制分析体系。分析掌握土壤盐渍化对滨海湿地生态环境质量的影响机制,为滨海湿地的区域治理提供科学的数据支撑。未来将在此工作的基础上将研究内容迁移到鄱阳湖湿地以验证不同湿地在该体系上的适用性。
参考文献
Regional-scale soil salinity assessment using Landsat ETM+canopy reflectance
[J].DOI:10.1016/j.rse.2015.08.026 URL [本文引用: 2]
Soil salinity inversion based on novel spectral index
[J].DOI:10.1007/s12665-021-09752-x [本文引用: 3]
Global mapping of soil salinity change
[J].DOI:10.1016/j.rse.2019.111260 URL [本文引用: 2]
Evolution of soil salinization under the background of landscape patterns in the irrigated northern slopes of Tianshan Mountains,Xinjiang,China
[J].DOI:10.1016/j.catena.2021.105561 URL [本文引用: 2]
Regional suitability prediction of soil salinization based on remote-sensing derivatives and optimal spectral index
[J].DOI:10.1016/j.scitotenv.2021.145807 URL [本文引用: 1]
Estimation of soil salt content (SSC) in the Ebinur Lake Wetland National Nature Reserve (ELWNNR),Northwest China,based on a Bootstrap-BP neural network model and optimal spectral indices
[J].DOI:10.1016/j.scitotenv.2017.10.025 URL [本文引用: 1]
Developing and applying novel spectral feature parameters for classifying soil salt types in arid land
[J].DOI:10.1016/j.ecolind.2015.02.028 URL [本文引用: 1]
Soil salinity retrieval from advanced multi-spectral sensor with partial least square regression
[J].DOI:10.3390/rs70100488 URL [本文引用: 1]
Detecting salinity hazards within a semiarid context by means of combining soil and remote-sensing data
[J].DOI:10.1016/j.geoderma.2005.10.009 URL [本文引用: 1]
Assessment of hydrosaline land degradation by using a simple approach of remote sensing indicators
[J].DOI:10.1016/j.agwat.2004.09.038 URL [本文引用: 3]
Mapping salt-affected soils using remote sensing indicators:A simple approach with the use of GIS IDRISI
[C]//
A ratio vegetation index adjusted for soil brightness
[J].DOI:10.1080/01431169008955053 URL [本文引用: 2]
Modeling of soil salinity within a semi-arid region using spectral analysis
[J].DOI:10.1007/s12517-015-2004-3 URL [本文引用: 2]
Soil salinity assessment by using near-infrared channel and vegetation soil salinity index derived from Landsat8 OLI data:A case study in the Tra Vinh Province,Mekong Delta,Vietnam
[J].
DOI:10.1186/s40645-022-00505-3
[本文引用: 1]

The Vietnamese Mekong Delta has been devastatingly impacted by climate change coupled with sea level rise and natural hazards. As a result, salinity intrusion has become a pressing issue in the coastal provinces of the Mekong Delta in recent years. This environmental problem has called a great attention from the global scientists as demonstrated by the paper Nguyen et al. (Prog Earth Planet Sci 7:1, 2020. 10.1186/s40645-019-0311-0) “Soil salinity assessment by using an indicator derived from Landsat 8 OLI data: A case study in the Tra Vinh, Mekong Delta, Vietnam” (reached 27 k accesses as of July 31, 2022). Recently, Silvestri et al. (PEPS, 2022) have commented on Nguyen et al. (2020) article with three main points highlighted: (1) Within the coastal portion of the Mekong Delta, extensively ponded due to widespread shrimp farming, about 90% of Landsat 8 pixels are fully or partially covered by water so that Landsat 8 OLI spatial resolution is not suitable to distinguish between ponded and non-ponded areas; (2) The decreased near-infrared (NIR) reflectance ascribed to increased soil salinity is instead due to the presence of water in Landsat 8 mixed pixels; and (3) NIR reflectance is equally reduced independently of whether the water ponding area is salt or freshwater. We appreciate Silvestri et al. (2022) for their correspondence regarding our 2020 article (Nguyen et al. 2020) where we showed the capacity of using freely accessible Landsat 8 OLI image for the rapid soil salinity detection at the top soil layer in the agricultural land that is of valuable information for agricultural activities. We conducted field survey and collected the soil samples during the dry season at different agricultural soil types. Notably, the soil samples were collected at the same time with the satellite passing over the study area. The soil salinity derived from Landsat 8 is in line with the analysis from in situ data and consistent with the findings of previous studies. Importantly, two points are stressed in this reply: (1) The goal of our study is to utilize the freely accessible data source with rapid method of mapping soil salinity to investigate the salinity in the agricultural land, but not in the water body. Therefore, it has been a serious mistake to state that 90% of Landsat 8 pixels are fully or partially covered by water as claimed in Silvestri et al. (2022); and (2) The Tra Vinh Province has recorded the highest salinity level normally in March or April every year when the rainfall exhibits the lowest of the year, and at this time, most of the water in the river/canal is affected by saline intrusion. Thus, it is advised that Silvestri et al. (2022) should use the images acquired in March or April rather than random months.
Evaluation of different soil salinity mapping using remote sensing techniques in arid ecosystems,Saudi Arabia
[J].
Wildfire probability mapping:Bivariate vs.multivariate statistics
[J].
DOI:10.3390/rs11060618
URL
[本文引用: 1]
Wildfires are one of the most common natural hazards worldwide. Here, we compared the capability of bivariate and multivariate models for the prediction of spatially explicit wildfire probability across a fire-prone landscape in the Zagros ecoregion, Iran. Dempster–Shafer-based evidential belief function (EBF) and the multivariate logistic regression (LR) were applied to a spatial dataset that represents 132 fire events from the period of 2007–2014 and twelve explanatory variables (altitude, aspect, slope degree, topographic wetness index (TWI), annual temperature, and rainfall, wind effect, land use, normalized difference vegetation index (NDVI), and distance to roads, rivers, and residential areas). While the EBF model successfully characterized each variable class by four probability mass functions in terms of wildfire probabilities, the LR model identified the variables that have a major impact on the probability of fire occurrence. Two distribution maps of wildfire probability were developed based upon the results of each model. In an ensemble modeling perspective, we combined the two probability maps. The results were verified and compared by the receiver operating characteristic (ROC) and the Wilcoxon Signed-Rank Test. The results showed that although an improved predictive accuracy (AUC = 0.864) can be achieved via an ensemble modeling of bivariate and multivariate statistics, the models fail to individually provide a satisfactory prediction of wildfire probability (EBFAUC = 0.701; LRAUC = 0.728). From these results, we recommend the employment of ensemble modeling approaches for different wildfire-prone landscapes.
Evaluation of groundwater quality and its suitability for domestic and irrigation use in parts of the Chandauli-Varanasi Region,Uttar Pradesh,India
[J].DOI:10.4236/jwarp.2015.77046 URL [本文引用: 1]
A novel ocean color index to detect floating algae in the global oceans
[J].DOI:10.1016/j.rse.2009.05.012 URL [本文引用: 1]
Water benefit-based ecological index for urban ecological environment quality assessments
[J].DOI:10.1109/JSTARS.2021.3098667 URL [本文引用: 3]
Normalized difference latent heat index for remote sensing of land surface energy fluxes
[J].DOI:10.1109/TGRS.2018.2866555 URL [本文引用: 1]
Ecological environment quality assessment based on remote sensing data for land consolidation
[J].DOI:10.1016/j.jclepro.2019.118126 URL [本文引用: 1]
A novel and direct ecological risk assessment index for environmental degradation based on response curve approach and remotely sensed data
[J].DOI:10.1016/j.ecolind.2018.11.038 URL [本文引用: 1]
Soil and climate differently impact NDVI patterns according to the season and the stand type
[J].
DOI:10.1016/j.scitotenv.2018.10.052
[本文引用: 2]
Several studies use satellite-based normalized difference vegetation index (NDVI) to monitor the impact of climate change on vegetation covers. Good understanding of the drivers of NDVI patterns is hindered by the difficulties in disentangling the effects of environmental factors from anthropogenic changes, by the limited number of environmental predictors studied, and by the diversity of responses according to periods and land covers. This study aims to improve our understanding of the different environmental drivers of NDVI spatial variations for different stand type characteristics of mountain and Mediterranean biomes. Using NDVI values extracted from MODES Terra time series, we calculated Spring Greenness (SG) and annual Relative Greenness (RGRE) to depict spring and summer vegetation activity, respectively, in a contrasted area of 10,255 km(2) located in the south of France. We modeled SG and RGRE at different scales. using 20 environmental predictors characterizing available energy, water supply, and nutrient supply calculated for different periods of the year. In spring, high minimum temperatures, good nitrogen availability, and acidic or neutral pH turned out to be determining for greenness, particularly for stand types located in altitude. In summer, an important soil water reserve and low temperatures promoted vegetation dynamics, particularly for stands located in areas with a Mediterranean climate. Our results show that NDVI dynamics was not only driven by climatic variability, and should not be studied using only mean temperature and rainfall. They highlight that different environmental factors act complementarily, and that soil parameters characterizing water stress and soil nutrition should be taken into account. While the factors limiting NDVI values varied according to the season and the position of the stands along the ecological gradients, we identified a global temperature and water-stress threshold when considering the whole vegetation. (C) 2018 Elsevier B.V.
Assessment of ASTER land cover and MODIS NDVI data at multiple scales for ecological characterization of an arid urban center
[J].DOI:10.1016/j.rse.2005.04.024 URL [本文引用: 2]
Remote sensing of urban thermal environments within local climate zones:A case study of two high-density subtropical chinese cities
[J].DOI:10.1016/j.uclim.2019.100568 URL [本文引用: 1]
Estimating the ecological status and change of riparian zones in Andalusia assessed by multi-temporal AVHHR datasets
[J].DOI:10.1016/j.ecolind.2008.05.013 URL [本文引用: 1]
Bayesian maximum entropy data fusion of field observed LAI and Landsat ETM+ derived LAI
[C]//
The evolution of landscape ecological security in Beijing under the influence of different policies in recent decades
[J].DOI:10.1016/j.scitotenv.2018.07.146 URL [本文引用: 1]
Ecological environment assessment for Greater Mekong Subregion based on Pressure-State-Response framework by remote sensing
[J].DOI:10.1016/j.ecolind.2020.106521 URL [本文引用: 1]
Ecological environment assessment of mining area by using moving window-based remote sensing ecological index
[C]//
Prediction of ecological effects of potential population and impervious surface increases using a remote sensing based ecological index (RSEI)
[J].DOI:10.1016/j.ecolind.2018.05.055 URL [本文引用: 1]
Remotely sensed urban surface ecological index (RSUSEI):An analytical framework for assessing the surface ecological status in urban environments
[J].
DOI:10.3390/rs12122029
URL
[本文引用: 2]
Urban Surface Ecological Status (USES) reflects the structure and function of an urban ecosystem. USES is influenced by the surface biophysical, biochemical, and biological properties. The assessment and modeling of USES is crucial for sustainability assessment in support of achieving sustainable development goals such as sustainable cities and communities. The objective of this study is to present a new analytical framework for assessing the USES. This analytical framework is centered on a new index, Remotely Sensed Urban Surface Ecological index (RSUSEI). In this study, RSUSEI is used to assess the USES of six selected cities in the U.S.A. To this end, Landsat 8 images, water vapor products, and the National Land Cover Database (NLCD) land cover and imperviousness datasets are downloaded for use. Firstly, Land Surface Temperature (LST), Wetness, Normalized Difference Vegetation Index (NDVI), and Normalized Difference Soil Index (NDSI) are derived by remote sensing methods. Then, RSUSEI is developed by the combination of NDVI, NDSI, Wetness, LST, and Impervious Surface Cover (ISC) with Principal Components Analysis (PCA). Next, the spatial variations of USES across the cities are evaluated and compared. Finally, the association degree of each parameter in the USES modeling is investigated. Results show that the spatial variability of LST, ISC, NDVI, NDSI, and Wetness is heterogeneous within and between cities. The mean (standard deviation) value of RSUSEI for Minneapolis, Dallas, Phoenix, Los Angeles, Chicago and Seattle yielded 0.58 (0.16), 0.54 (0.17), 0.47 (0.19), 0.63 (0.21), 0.50 (0.17), and 0.44 (0.19), respectively. For all the cities, PC1 included more than 93% of the surface information, which is contributed by greenness, moisture, dryness, heat, and imperviousness. The highest and lowest mean values of RSUSEI are found in “Developed, High intensity” (0.76) and “Developed, Open Space” (0.35) lands, respectively. The mean correlation coefficient between RSUSEI and LST, ISC, NDVI, NDSI, and Wetness, is 0.47, 0.97, −0.31, 0.17, and −0.27, respectively. The statistical significance of these correlations is confirmed at 95% confidence level. These results suggest that the association degree of ISC in USES modeling is the highest, despite the differences in land cover and biophysical characteristics in the cities. RSUSEI could be very useful in modeling and comparing USES across cities with different geographical, climatic, environmental, and biophysical conditions and can also be used for assessing urban sustainability over space and time.
Landscape evolution and agricultural land salinization in coastal area:A conceptual model
[J].DOI:10.1016/j.scitotenv.2017.12.083 URL [本文引用: 1]
The influence of farm landscape shape on the impact and management of dryland salinity
[J].DOI:10.1016/j.agwat.2006.12.005 URL [本文引用: 1]
黄河三角洲湿地演变特征及生态系统健康评价研究
[D],
Characteristics and ecosystem health evaluation research of the Yellow River Delta wetland
[J].
黄河三角洲地区人类活动对景观结构的影响分析──以山东省东营市为例
[J],
Analysis of impact of human activity on landscape structare in Yellow River Delta:A case study of Dongying region
[J].
An atmospheric correction parameter calculator for a single thermal band earth-sensing instrument
[C]//
Validation of a web-based atmospheric correction tool for single thermal band instruments
[C]//
Optical remote-sensing data based research on detecting soil salinity at different depth in an arid-area oasis,Xinjiang,China
[J].DOI:10.1007/s12145-018-0358-2 [本文引用: 1]
Air humidity characteristics of local climate zones:A three-year observational study in Nanjing
[J].DOI:10.1016/j.buildenv.2020.106661 URL [本文引用: 1]
Analysis on land ecological security change and affect factors using RS and GWR in the Danjiangkou Reservoir area,China
[J].DOI:10.1016/j.apgeog.2019.02.009 URL [本文引用: 1]
Hyperspectral image-based vegetation index (HSVI):A new vegetation index for urban ecological research
[J].DOI:10.1016/j.jag.2021.102529 URL [本文引用: 1]
Relationships of LST to NDBI and NDVI in Wuhan City based on Landsat ETM+ Image
[C]//
Evaluation of soil conditions using spectral indices from hyperspectral datasets
[C]//
Estimation of crop LAI using hyperspectral vegetation indices and a hybrid inversion method
[J].DOI:10.1016/j.rse.2015.04.032 URL [本文引用: 1]
A practical split‐window algorithm for retrieving land‐surface temperature from MODIS data
[J].DOI:10.1080/01431160500044713 URL [本文引用: 1]
Land surface emissivity retrieval from different VNIR and TIR sensors
[J].DOI:10.1109/TGRS.36 URL [本文引用: 1]
Theoretical analysis of Tsallis entropy-based quality measure for weighted averaging image fusion
[J].DOI:10.1016/j.inffus.2019.12.010 URL [本文引用: 1]
Bayesian entropy network for fusion of different types of information
[J].DOI:10.1016/j.ress.2019.106747 URL [本文引用: 1]
TOPSIS model with entropy weight for eco geological environmental carrying capacity assessment
[J].
A fuzzy entropy approach for design of hydrometric monitoring networks
[J].DOI:10.1016/j.jhydrol.2020.124797 URL [本文引用: 1]
Application of a hybrid Entropy-McKinsey Matrix method in evaluating sustainable urbanization:A China case study
[J].DOI:10.1016/j.cities.2014.06.006 URL [本文引用: 1]
光谱与纹理信息结合的黄河三角洲土壤盐渍化信息提取——以垦利区为例
[J].
Extraction of soil salinization information by combining spectral and texture data in the Yellow River Delta:A case study in Kenli District,Shandong Province
[J].
基于Landsat TM/ETM影像的黄河三角洲盐渍土动态变化分析
[J].
Analysis on dynamic variation of salinized soil in Yellow River Delta based on Landsat TM/ETM image
[J].
