Impact of soil salinization on the eco-environment quality of coastal wetlands:A case study of Yellow River Delta
ZHANG Zhimei1(), FAN Yanguo1(), JIAO Zhijun2, GUAN Qingchun1
1. College of Oceanography and Space Informatics, China University of Petroleum (East China), Qingdao 266580, China 2. School of Geosciences and Info-physics, Central South University, Changsha 410012, China
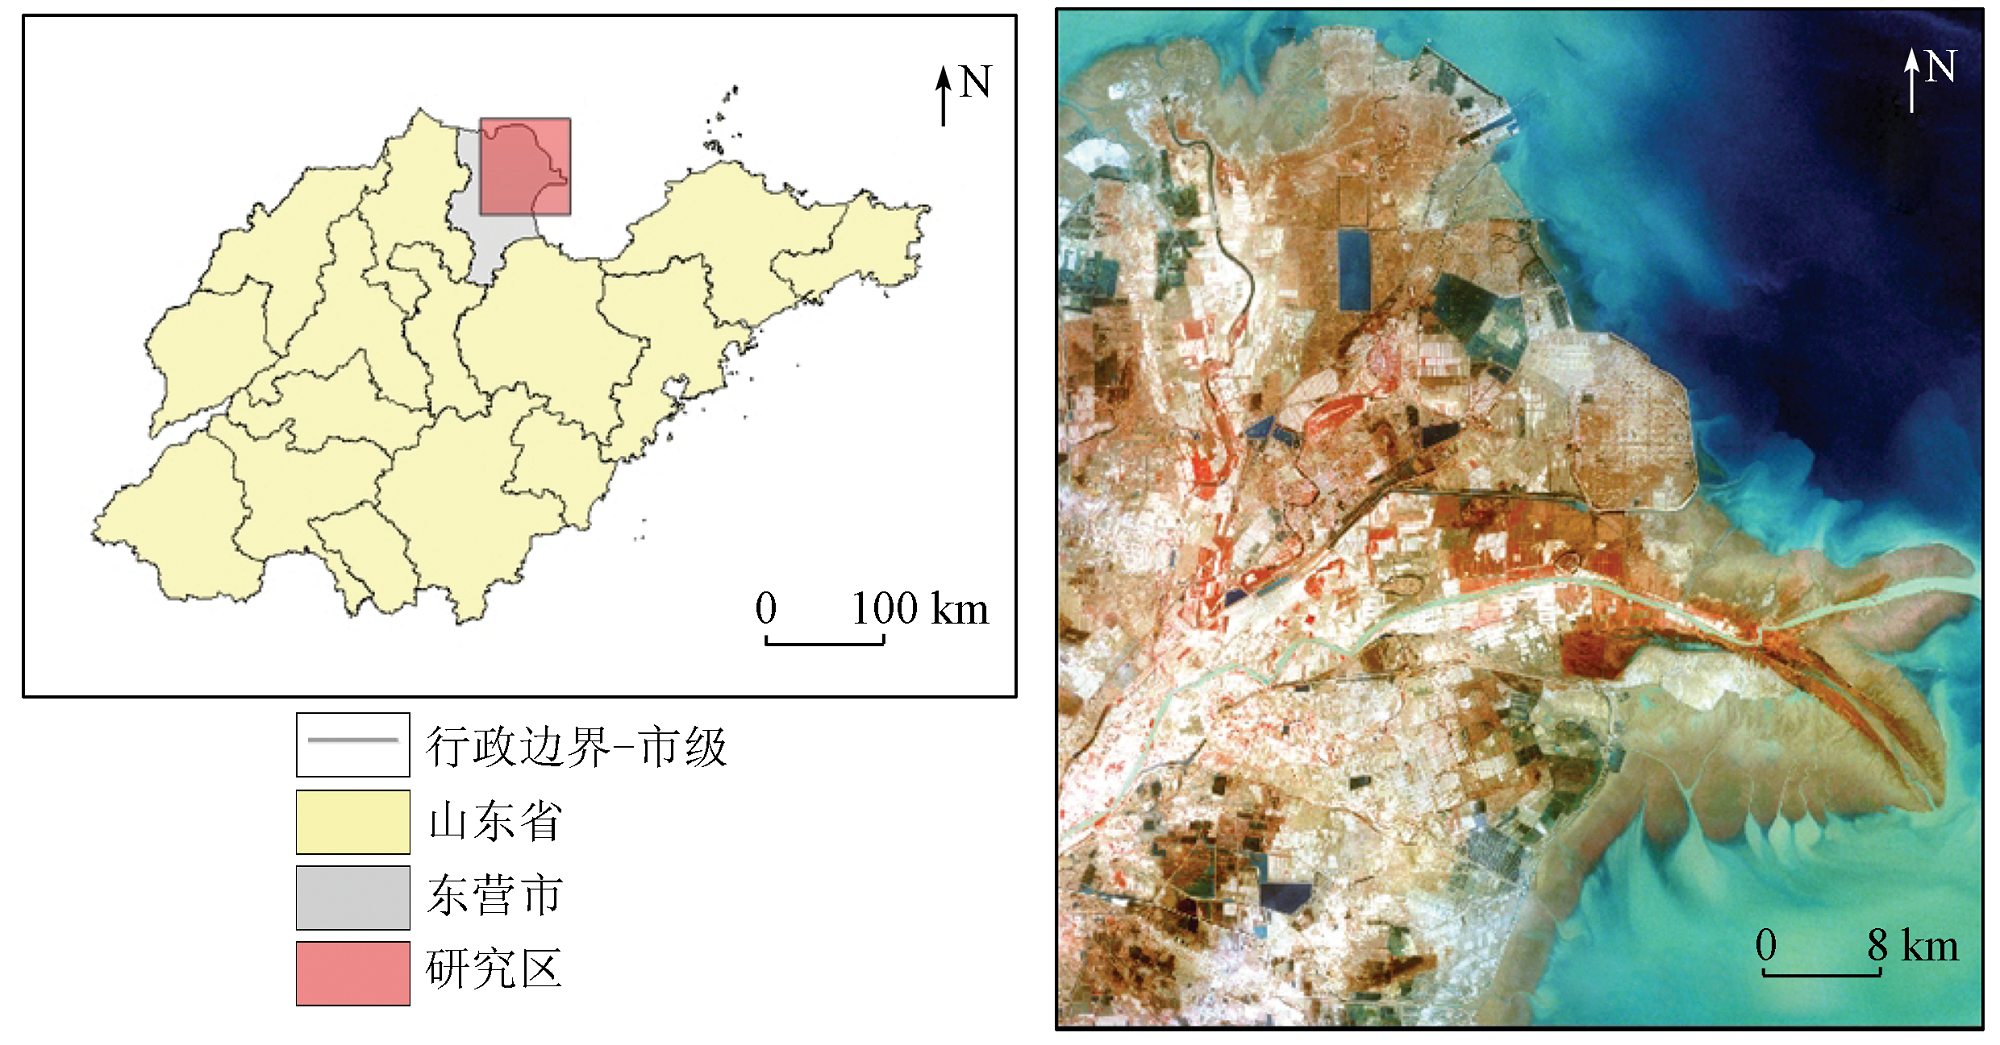
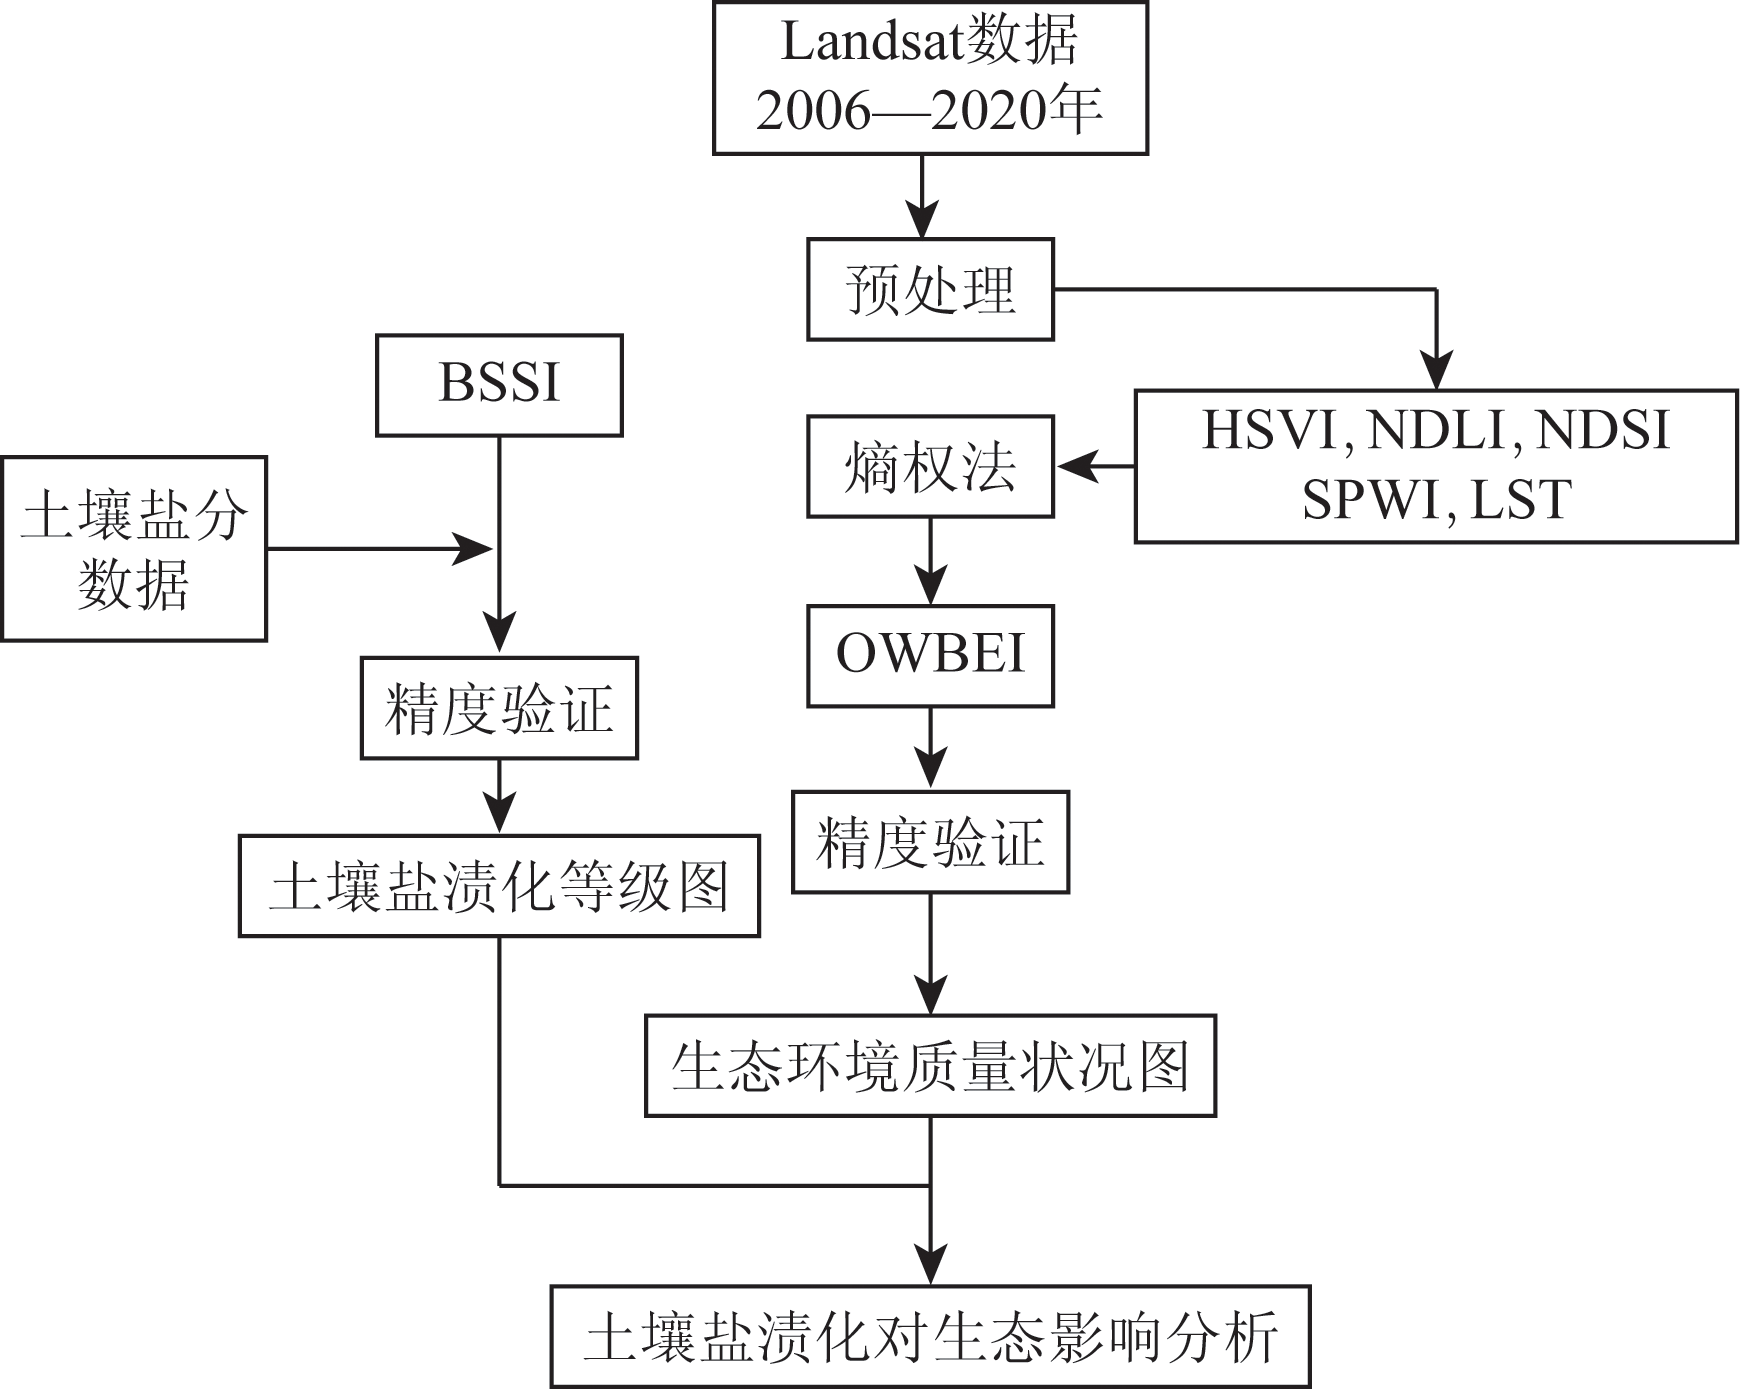
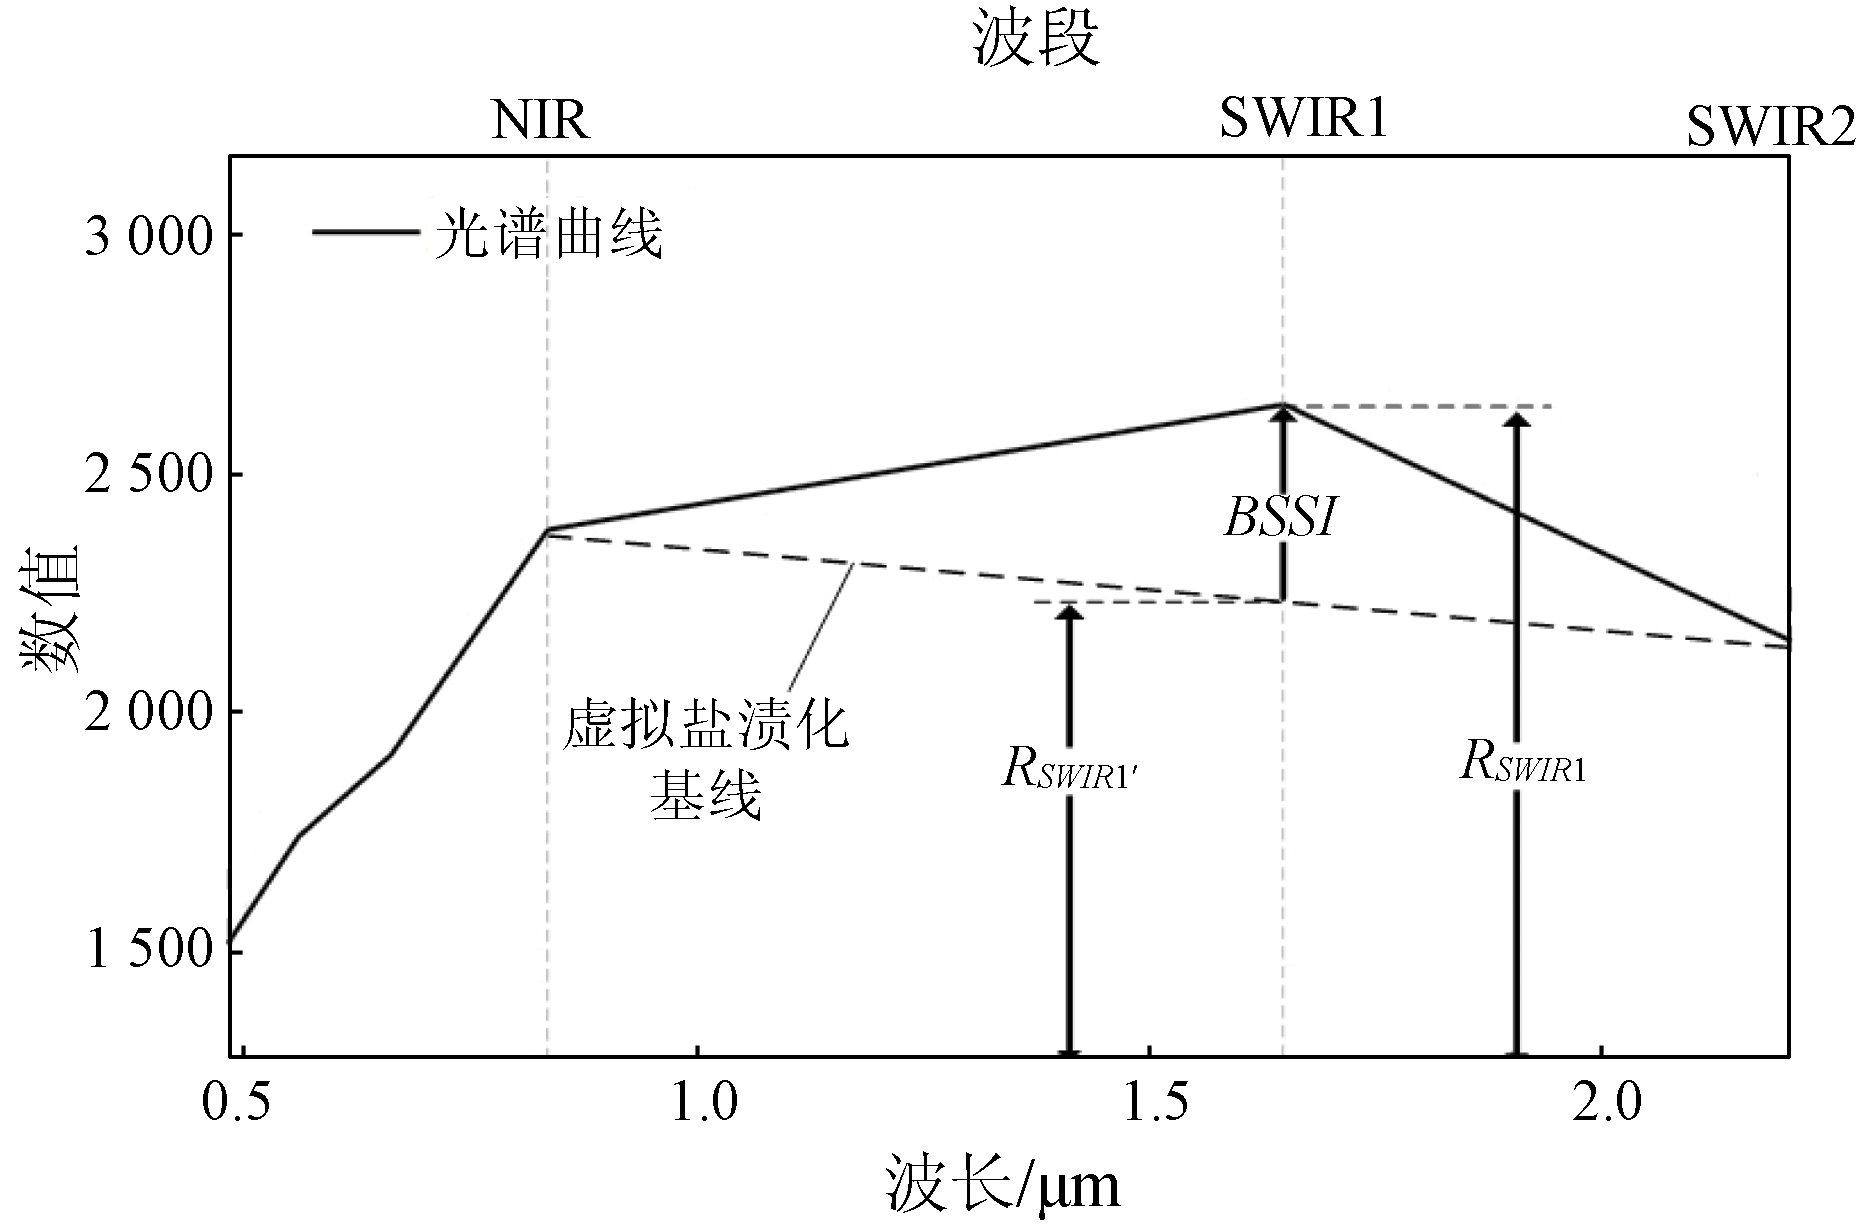
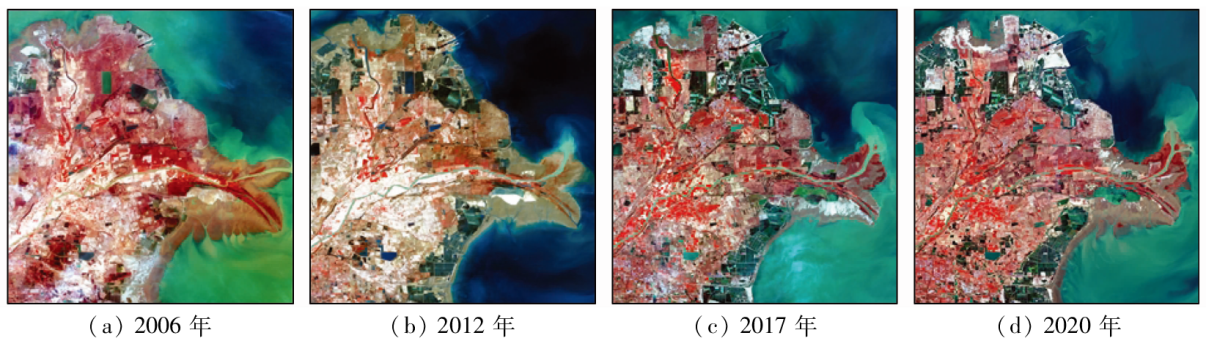
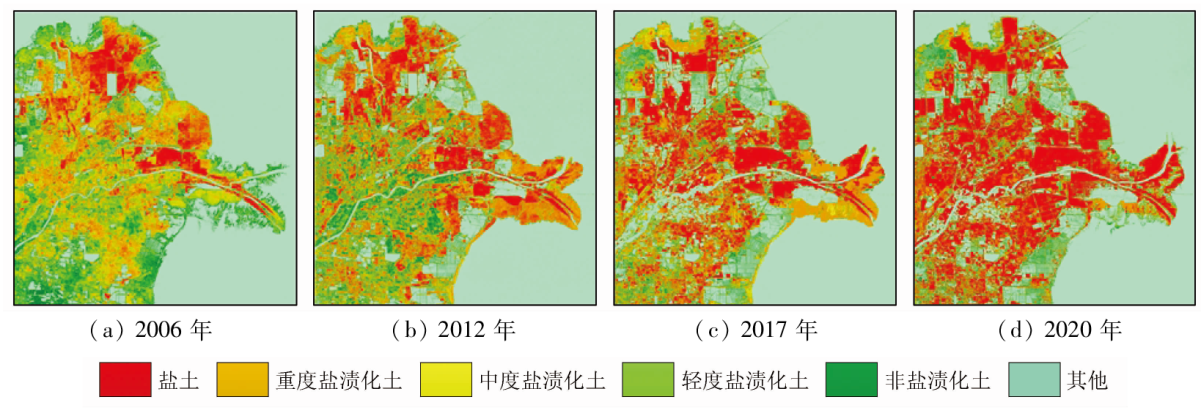
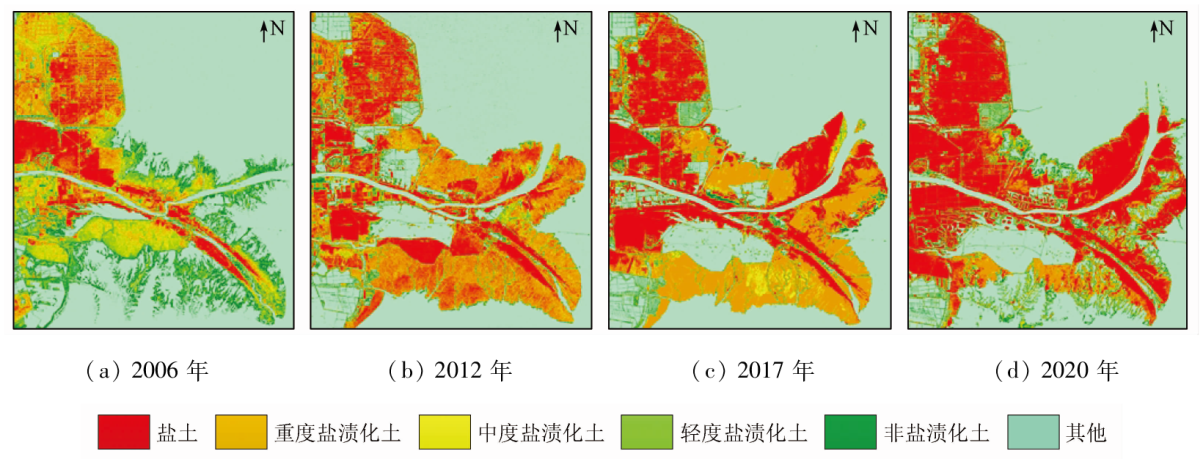
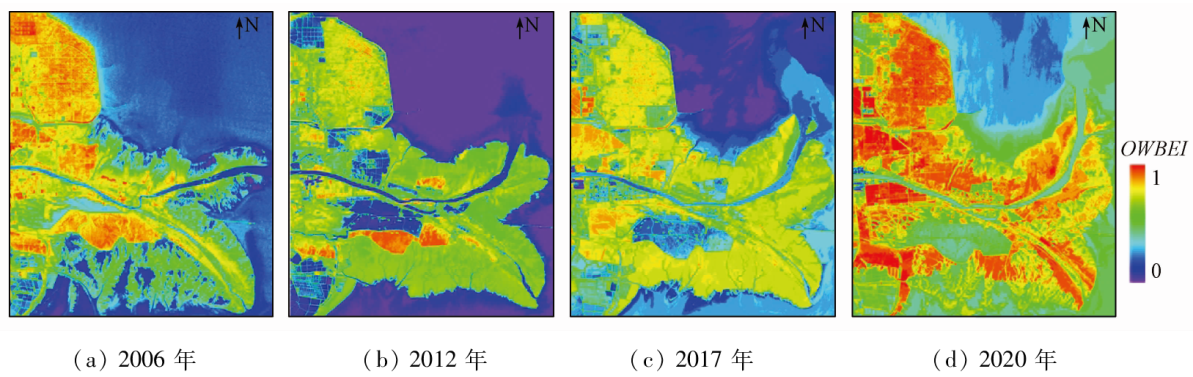
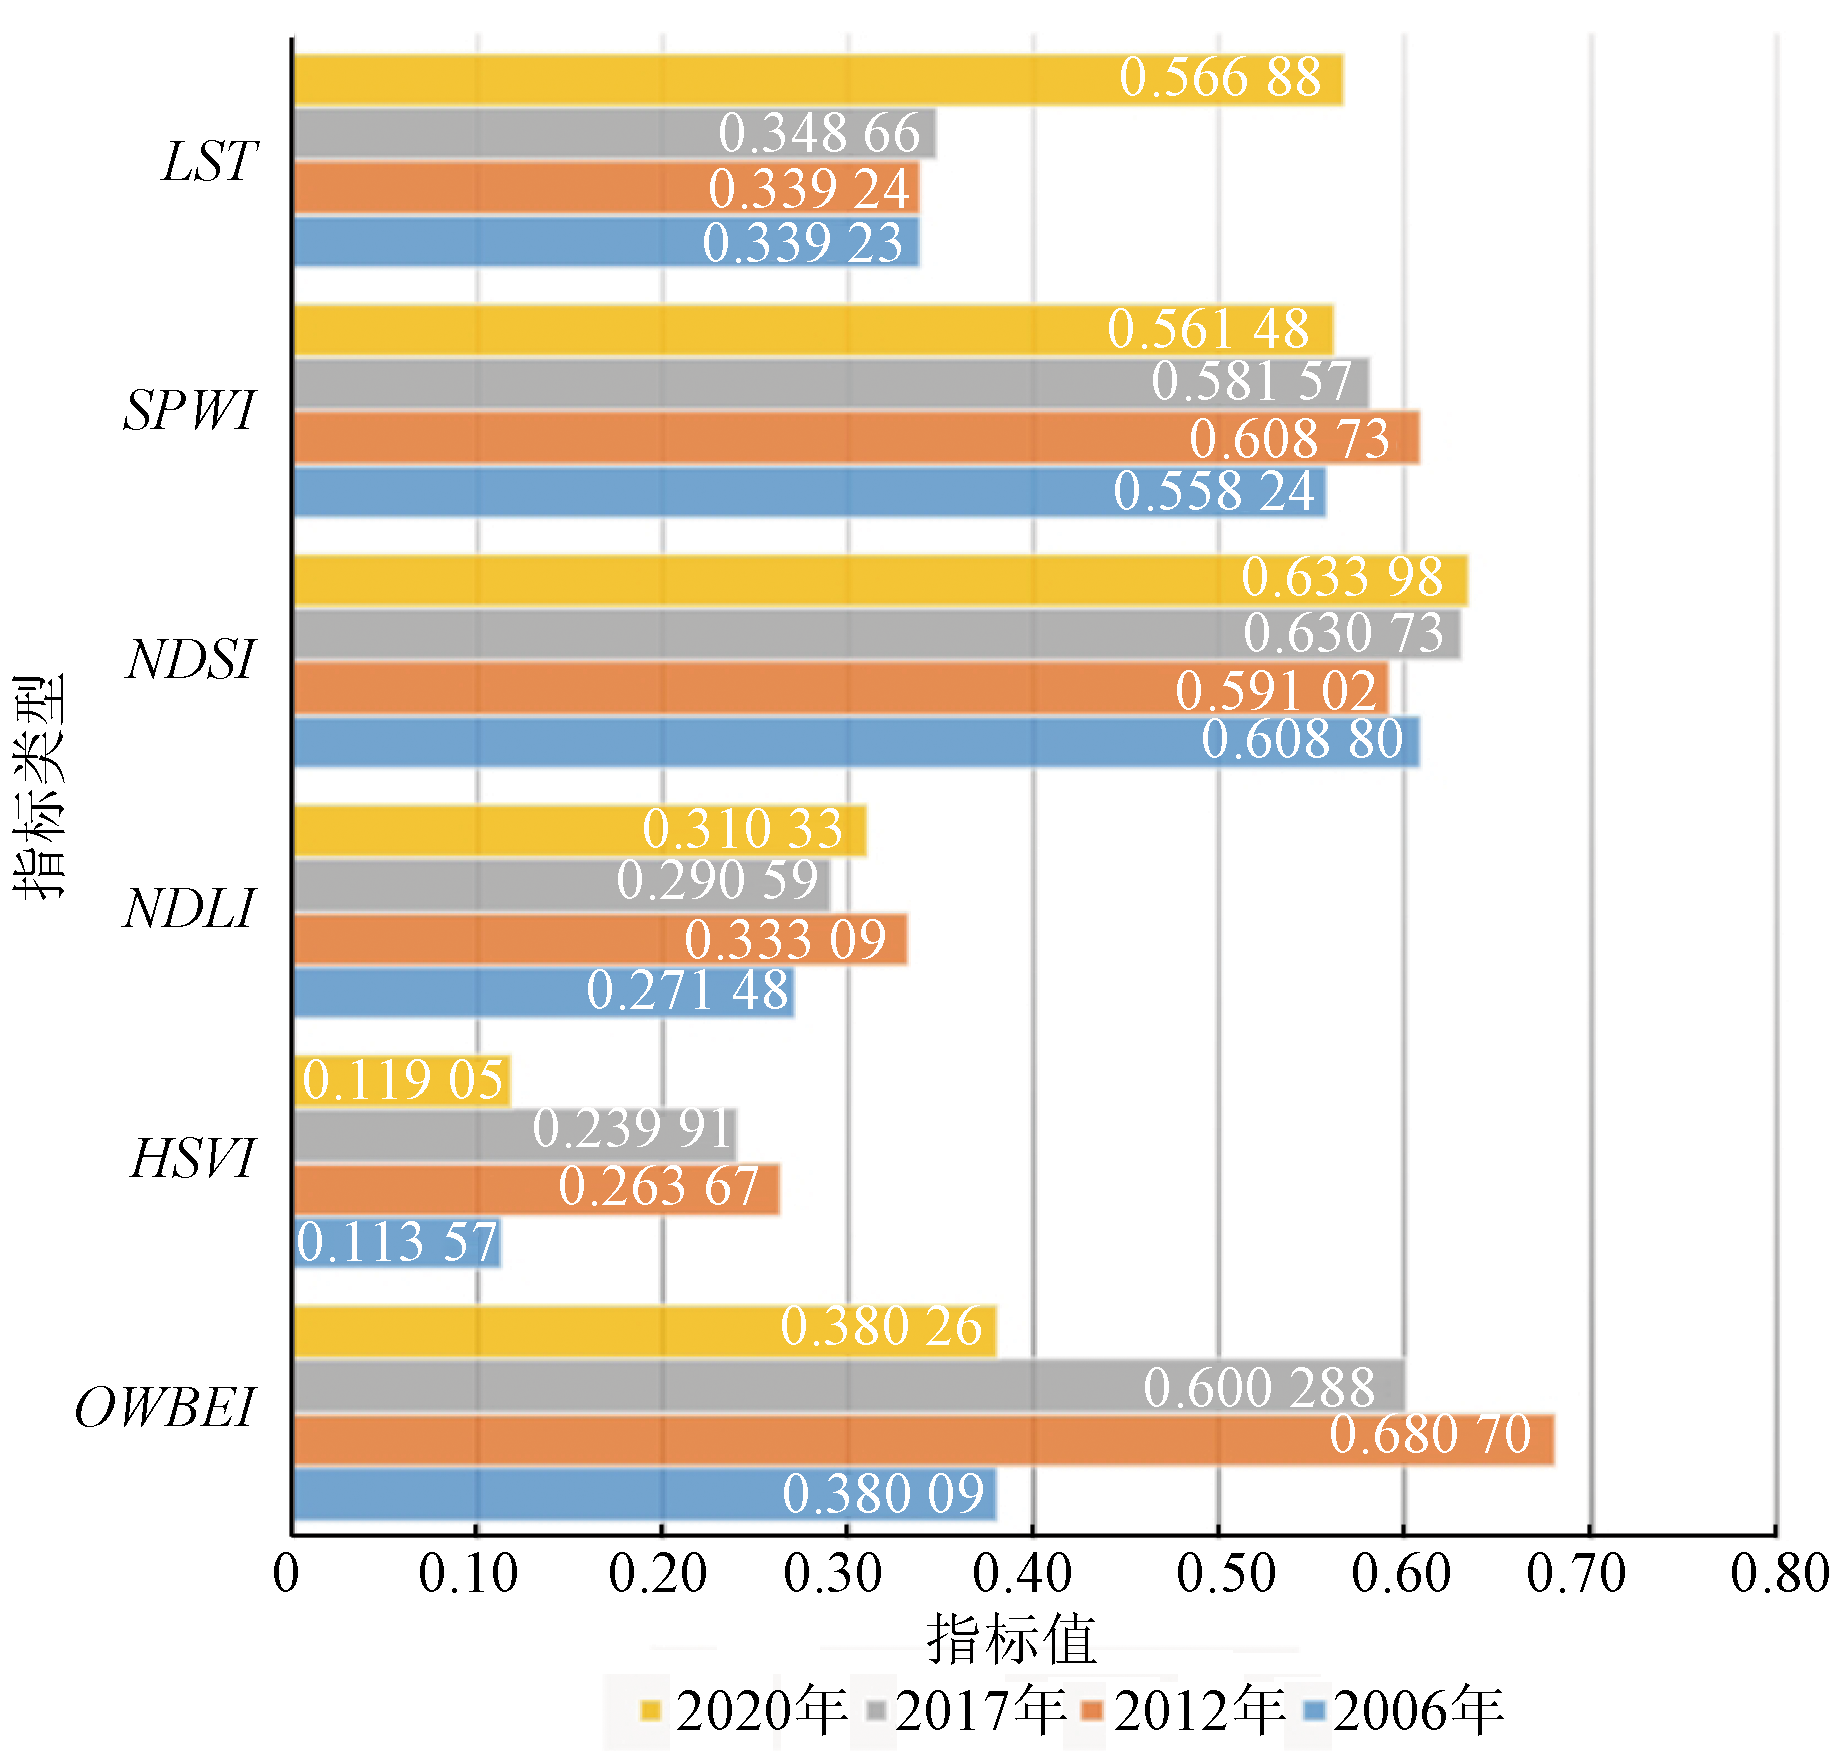
Soil salinization is an important reason for land degradation and desertification and has a huge impact on the eco-environment. Coastal wetlands are typical areas subjected to a weak eco-environment and severe salinization, and there is an urgent need to investigate the impact of soil salinization on their eco-environment. This study proposed the baseline-based soil salinity index (BSSI), which can effectively suppress the influence of complex features on surface salinization monitoring and improve the accuracy of saline soil extraction by 10% compared to other salinity index models. Furthermore, this study proposed the optimized water benefit-based ecological index (OWBEI) by optimizing the water benefit-based ecological index (WBEI), which can effectively increase the accuracy of eco-environment quality assessment to 87%. Finally, this study explored the mechanical processes of the influence of soil salinization on the eco-environment quality based on the distribution of soil salinization and eco-environment quality obtained from the Yellow River Delta. The results show that the deterioration of soil salinization has led to an increase in the soil vulnerability of coastal wetlands, indirectly resulting in a continuous decrease in eco-environment quality. Although eco-environment protection measures have been continuously proposed, few of them are tailored to the solving of salinization. This leads to the deterioration of the ecological quality, which then yields negative feedback to the soil and eventually forms a vicious circle. This adversely affects local production, life, and social development.
张治梅, 樊彦国, 矫志军, 管青春. 土壤盐渍化对滨海湿地生态环境质量的影响——以黄河三角洲为例[J]. 自然资源遥感, 2023, 35(4): 226-235.
ZHANG Zhimei, FAN Yanguo, JIAO Zhijun, GUAN Qingchun. Impact of soil salinization on the eco-environment quality of coastal wetlands:A case study of Yellow River Delta. Remote Sensing for Natural Resources, 2023, 35(4): 226-235.
Scudiero E, Skaggs T H, Corwin D L. Regional-scale soil salinity assessment using Landsat ETM+canopy reflectance[J]. Remote Sensing of Environment, 2015, 169:335-343.
doi: 10.1016/j.rse.2015.08.026
[2]
Zhou X H, Zhang F, Liu C J, et al. Soil salinity inversion based on novel spectral index[J]. Environmental Earth Sciences, 2021, 80(16):501-514.
doi: 10.1007/s12665-021-09752-x
[3]
Ivushkin K, Bartholomeus H, Bregt A K, et al. Global mapping of soil salinity change[J]. Remote Sensing of Environment, 2019, 231:111260.
doi: 10.1016/j.rse.2019.111260
[4]
Zhuang Q W, Shao Z F, Huang X, et al. Evolution of soil salinization under the background of landscape patterns in the irrigated northern slopes of Tianshan Mountains,Xinjiang,China[J]. CATENA, 2021, 206:105561.
doi: 10.1016/j.catena.2021.105561
[5]
Wang Z, Zhang F, Zhang X L, et al. Regional suitability prediction of soil salinization based on remote-sensing derivatives and optimal spectral index[J]. Science of The Total Environment, 2021, 775:145807.
doi: 10.1016/j.scitotenv.2021.145807
[6]
Wang X P, Zhang F, Ding J L, et al. Estimation of soil salt content (SSC) in the Ebinur Lake Wetland National Nature Reserve (ELWNNR),Northwest China,based on a Bootstrap-BP neural network model and optimal spectral indices[J]. Science of The Total Environment, 2018, 615(15):918-930.
doi: 10.1016/j.scitotenv.2017.10.025
[7]
Jin P B, Li P H, Wang Q, et al. Developing and applying novel spectral feature parameters for classifying soil salt types in arid land[J]. Ecological Indicators, 2015, 54:116-123.
doi: 10.1016/j.ecolind.2015.02.028
[8]
Fan X W, Liu Y B, Tao J M, et al. Soil salinity retrieval from advanced multi-spectral sensor with partial least square regression[J]. Remote Sensing, 2015, 7(1):488-511.
doi: 10.3390/rs70100488
[9]
Douaoui A, Nicolas H, Walter C. Detecting salinity hazards within a semiarid context by means of combining soil and remote-sensing data[J]. Geoderma, 2006, 134(1/2):217-230.
doi: 10.1016/j.geoderma.2005.10.009
[10]
Khan N M, Rastoskuev V V, Sato Y, et al. Assessment of hydrosaline land degradation by using a simple approach of remote sensing indicators[J]. Agricultural Water Management, 2005, 77(1/2/3):96-109.
doi: 10.1016/j.agwat.2004.09.038
[11]
Khan N M, Rastoskuev V V, Shalina E V, et al. Mapping salt-affected soils using remote sensing indicators:A simple approach with the use of GIS IDRISI[C]// 22nd Asian Conference on Remote Sensing.Singapore, 2001:5-9.
[12]
Major D J, Baret F, Guyot G. A ratio vegetation index adjusted for soil brightness[J]. International Journal of Remote Sensing, 1990, 11(5):727-740.
doi: 10.1080/01431169008955053
[13]
Fourati H T, Bouaziz M, Benzina M, et al. Modeling of soil salinity within a semi-arid region using spectral analysis[J]. Arabian Journal of Geosciences, 2015, 8(12):11175-11182.
doi: 10.1007/s12517-015-2004-3
[14]
Nguyen K A, Liou Y A, Tran H P, et al. Soil salinity assessment by using near-infrared channel and vegetation soil salinity index derived from Landsat8 OLI data:A case study in the Tra Vinh Province,Mekong Delta,Vietnam[J]. Progress in Earth and Planetary Science, 2022, 9(1):46.
doi: 10.1186/s40645-022-00505-3
[15]
Elhag M. Evaluation of different soil salinity mapping using remote sensing techniques in arid ecosystems,Saudi Arabia[J]. Journal of Sensors, 2016:7596175.
[16]
Jaafari A, Mafi-Gholami D, Pham B T, et al. Wildfire probability mapping:Bivariate vs.multivariate statistics[J]. Remote Sensing, 2019, 11(6):618.
doi: 10.3390/rs11060618
[17]
Singh S, Raju N J, Ramakrishna C. Evaluation of groundwater quality and its suitability for domestic and irrigation use in parts of the Chandauli-Varanasi Region,Uttar Pradesh,India[J]. Journal of Water Resource and Protection, 2015, 7(7):572-587.
doi: 10.4236/jwarp.2015.77046
[18]
Hu C. A novel ocean color index to detect floating algae in the global oceans[J]. Remote Sensing of Environment, 2009, 113(10):2118-2129.
doi: 10.1016/j.rse.2009.05.012
[19]
Jiao Z J, Sun G Y, Zhang A Z, et al. Water benefit-based ecological index for urban ecological environment quality assessments[J]. IEEE Journal of Selected Topics in Applied Earth Observations and Remote Sensing, 2021, 14:7557-7569.
doi: 10.1109/JSTARS.2021.3098667
[20]
Liou Y, Le M S, Chien H. Normalized difference latent heat index for remote sensing of land surface energy fluxes[J]. IEEE Transactions on Geoscience and Remote Sensing, 2019, 57(3):1423-1433.
doi: 10.1109/TGRS.2018.2866555
[21]
Shan W, Jin X B, Ren J, et al. Ecological environment quality assessment based on remote sensing data for land consolidation[J]. Journal of Cleaner Production, 2019, 239:118126.
doi: 10.1016/j.jclepro.2019.118126
[22]
Tan J B, Li A N, Lei G B, et al. A novel and direct ecological risk assessment index for environmental degradation based on response curve approach and remotely sensed data[J]. Ecological Indicators, 2019, 98:783-793.
doi: 10.1016/j.ecolind.2018.11.038
[23]
Piedallu C, Chéret V, Denux J P, et al. Soil and climate differently impact NDVI patterns according to the season and the stand type[J]. Science of the Total Environment, 2019, 651:2874-2885.
doi: 10.1016/j.scitotenv.2018.10.052
[24]
Stefanov W L, Netzband M. Assessment of ASTER land cover and MODIS NDVI data at multiple scales for ecological characterization of an arid urban center[J]. Remote Sensing of Environment, 2005, 99(1/2):31-43.
doi: 10.1016/j.rse.2005.04.024
[25]
Chen X L, Xu Y, Yang J X, et al. Remote sensing of urban thermal environments within local climate zones:A case study of two high-density subtropical chinese cities[J]. Urban Climate, 2020, 31:100568.
doi: 10.1016/j.uclim.2019.100568
[26]
Ivits E, Cherlet M, Mehl W, et al. Estimating the ecological status and change of riparian zones in Andalusia assessed by multi-temporal AVHHR datasets[J]. Ecological Indicators, 2009, 9(3):422-431.
doi: 10.1016/j.ecolind.2008.05.013
[27]
Li A H, Bo Y C, Chen L. Bayesian maximum entropy data fusion of field observed LAI and Landsat ETM+ derived LAI[C]// Proceedings of IEEE International Geoscience and Remote Sensing Symposium.Vancouver, 2011:2617-2620.
[28]
Wang S D, Zhang X Y, Wu T X, et al. The evolution of landscape ecological security in Beijing under the influence of different policies in recent decades[J]. Science of the Total Environment, 2019, 646:49-57.
doi: 10.1016/j.scitotenv.2018.07.146
[29]
Wu J J, Wang X, Zhong B, et al. Ecological environment assessment for Greater Mekong Subregion based on Pressure-State-Response framework by remote sensing[J]. Ecological Indicators, 2020, 117:106521.
doi: 10.1016/j.ecolind.2020.106521
[30]
Zhou D Y, Chen T, Niu R Q, et al. Ecological environment assessment of mining area by using moving window-based remote sensing ecological index[C]// Proceedings of IEEE International Geoscience and Remote Sensing Symposium.Yokohama, 2019:9942-9945.
[31]
Xu H Q, Wang M Y, Shi T T, et al. Prediction of ecological effects of potential population and impervious surface increases using a remote sensing based ecological index (RSEI)[J]. Ecological Indicators, 2018, 93:730-740.
doi: 10.1016/j.ecolind.2018.05.055
[32]
Firozjaei M K, Fathololoumi S, Weng Q, et al. Remotely sensed urban surface ecological index (RSUSEI):An analytical framework for assessing the surface ecological status in urban environments[J]. Remote Sensing, 2020, 12(12):2029.
doi: 10.3390/rs12122029
[33]
Bless A E, Colin F, Crabit A, et al. Landscape evolution and agricultural land salinization in coastal area:A conceptual model[J]. Science of the Total Environment, 2018, 625:647-656.
doi: 10.1016/j.scitotenv.2017.12.083
[34]
Kingwell R, John M. The influence of farm landscape shape on the impact and management of dryland salinity[J]. Agricultural Water Management, 2007, 89(1/2): 29-38.
doi: 10.1016/j.agwat.2006.12.005
[35]
杨欢. 黄河三角洲湿地演变特征及生态系统健康评价研究[D], 郑州,华北水利水电大学, 2019.
Yang H. Characteristics and ecosystem health evaluation research of the Yellow River Delta wetland[J]. Zhengzhou:North China University of water Resources and Electric Power, 2019.
Chen L D, Fu B J. Analysis of impact of human activity on landscape structare in Yellow River Delta:A case study of Dongying region[J]. Acta Ecologica Sinica, 1996, 16(4):337-344.
[37]
Barsi J A, Schott J R, Palluconi F D, et al. An atmospheric correction parameter calculator for a single thermal band earth-sensing instrument[C]// Proceedings of IEEE International Geoscience and Remote Sensing Symposium.Toulouse, 2003(5):3014-3016.
[38]
Julia A B, John R S, Frank D P, et al. Validation of a web-based atmospheric correction tool for single thermal band instruments[C]// Proceedings of Spie the International Society for Optical Engineering.San Diego, 2005,58820.
[39]
Jiang H N, Shu H. Optical remote-sensing data based research on detecting soil salinity at different depth in an arid-area oasis,Xinjiang,China[J]. Earth Science Informatics, 2019, 12(1):43-56.
doi: 10.1007/s12145-018-0358-2
[40]
Yang X, Peng L H, Chen Y, et al. Air humidity characteristics of local climate zones:A three-year observational study in Nanjing[J]. Building and Environment, 2020, 171:106661.
doi: 10.1016/j.buildenv.2020.106661
[41]
Liu C X, Wu X L, Wang L. Analysis on land ecological security change and affect factors using RS and GWR in the Danjiangkou Reservoir area,China[J]. Applied Geography, 2019, 105:1-14.
doi: 10.1016/j.apgeog.2019.02.009
[42]
Sun G Y, Jiao Z J, Zhang A Z, et al. Hyperspectral image-based vegetation index (HSVI):A new vegetation index for urban ecological research[J]. International Journal of Applied Earth Observation and Geoinformation, 2021, 103: 102529.
doi: 10.1016/j.jag.2021.102529
[43]
Chen L, Li M, Huang F, et al. Relationships of LST to NDBI and NDVI in Wuhan City based on Landsat ETM+ Image[C]// Proceedings of 2013 6th International Congress on Image and Signal Processing (CISP).Hangzhou, 2013:840-845.
[44]
Vibhute A D, Dhumal R, Nagne A, et al. Evaluation of soil conditions using spectral indices from hyperspectral datasets[C]// Proceedings of 2017 2nd International Conference on Man and Machine Interfacing (MAMI).Bhubaneswar, 2017:1-6.
[45]
Liang L, Di L P, Zhang L P, et al. Estimation of crop LAI using hyperspectral vegetation indices and a hybrid inversion method[J]. Remote Sensing of Environment, 2015, 165:123-134.
doi: 10.1016/j.rse.2015.04.032
[46]
Mao K, Qin Z, Shi J, et al. A practical split‐window algorithm for retrieving land‐surface temperature from MODIS data[J]. International Journal of Remote Sensing, 2005, 26(15):3181-3204.
doi: 10.1080/01431160500044713
[47]
Sobrino J A, Jimenez-Munoz J C, Soria G, et al. Land surface emissivity retrieval from different VNIR and TIR sensors[J]. IEEE Transactions on Geoscience and Remote Sensing, 2008, 46(2):316-327.
doi: 10.1109/TGRS.36
[48]
Sholehkerdar A, Tavakoli J, Liu Z. Theoretical analysis of Tsallis entropy-based quality measure for weighted averaging image fusion[J]. Information Fusion, 2020, 58:69-81.
doi: 10.1016/j.inffus.2019.12.010
[49]
Wang Y H, Liu Y M. Bayesian entropy network for fusion of different types of information[J]. Reliability Engineering and System Safety, 2020, 195:106747.
doi: 10.1016/j.ress.2019.106747
[50]
Li X F. TOPSIS model with entropy weight for eco geological environmental carrying capacity assessment[J]. Microprocessors and Microsystems, 2021:103805.
[51]
Sreeparvathy V, Srinivas V V. A fuzzy entropy approach for design of hydrometric monitoring networks[J]. Journal of Hydrology, 2020, 586:124797.
doi: 10.1016/j.jhydrol.2020.124797
[52]
Shen L Y, Zhou J Y, Xia B, et al. Application of a hybrid Entropy-McKinsey Matrix method in evaluating sustainable urbanization:A China case study[J]. Cities, 2015, 42:186-194.
doi: 10.1016/j.cities.2014.06.006
Huang J, Zhao G X, Xi X, et al. Extraction of soil salinization information by combining spectral and texture data in the Yellow River Delta:A case study in Kenli District,Shandong Province[J]. Journal of Agricultural Resources and Environment, 2022, 39(3):594-601.
Cao J R, Liu W Q, Huang C, et al. Analysis on dynamic variation of salinized soil in Yellow River Delta based on Landsat TM/ETM image[J]. Bulletin of Soil and Water Conservation, 2014, 34(6):179-183,371.
 2023, Vol. 35
  ), 樊彦国1(